I am a big fan of trading with harmonic patterns in the spot forex market because they provide very precise conditions for evaluating the validity of the patterns, and offer a high reward to risk ratio when traded properly. There are various patterns which fall into the “harmonic” group, but today we will highlight one of the oldest recognized harmonic patterns – the Gartley pattern. In the following material, will dive into some rules and best practices around trading the Gartley pattern.
What is the Gartley Pattern in Forex
Gartley is a special chart pattern within the harmonic pattern universe. And as with the other harmonic trading patterns, it must meet its own specific Fibonacci levels in order to qualify as a valid formation. H.M Gartley, who lived during the same era as R.N Elliott and W.D Gann, introduced the Gartley pattern to the world in his book entitled “Profits in the Stock Market” which he wrote back in 1935. In the book and specifically on page 222, H.M. Gartley discusses the Gartley pattern and refers to it as “one of the best trading opportunities” in the market. And so, the Gartley pattern is also sometimes referred to as Gartley 222 or the 222 pattern by some harmonic traders.
The pattern resembles an M/W shape on the chart, depending on whether it is a bullish or a bearish Gartley. As such, the pattern consists of five points on the chart. These points are marked with X, A, B, C, and D. This is how a Gartley harmonic pattern appears:
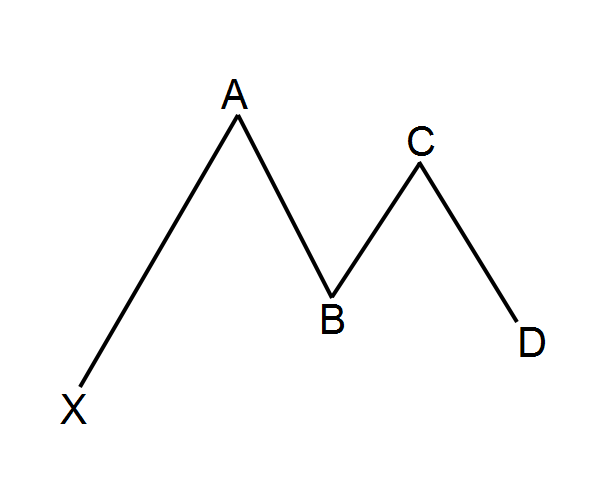
This is a sketch of the Gartley chart figure. The pattern starts with point X and it creates four swings until point D is completed.
Rules of the Gartley Pattern
Since the pattern is a member of the Harmonic family, each swing should conform to specific Fibonacci levels. We will now go through each component of the Gartley structure:
XA: The XA move could be any price activity on the chart. There are no specific requirements in relation to the XA price move of the Gartley chart formation.
AB: The AB move should be approximately 61.8% of the XA size. So, if the XA move is bullish, then the AB move should reverse the price action and should reach the 61.8% Fibonacci retracement of XA.
BC: The BC move should then reverse the AB move. At the same time, the BC move should finish either on the 38.2% Fibonacci level, or on the 88.6% Fibonacci level of the prior AB leg.
CD: The CD should be a reversal of the BC move. Then if BC is 38.2% of AB, then CD should respond to the 127.2% extension of BC. If BC is 88.6% of AB, then CD should be the 161.8% extension of BC.
AD: Then there is the last rule for the Gartley pattern. When the CD move is complete, you should measure the AD move. A valid Gartley on the chart will show an AD move, which takes a 78.6% retracement of the XA move.
Refer to the illustration below which will help you visualize these rules for the Gartley pattern:
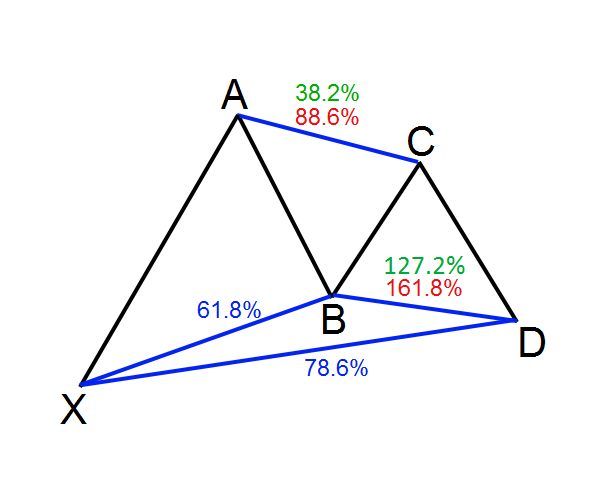
If these five rules are met, you can confirm the presence of the Gartley pattern on your chart.
Potential of the Forex Gartley Pattern
But what is the potential, once the Forex Gartley Pattern has been confirmed? Remember, the expected outcome of the Gartley figure could be bullish or bearish depending on whether we have a bullish Gartley or a Bearish Gartley.
Let’s take a closer look:
Bullish Gartley Pattern
The Bullish Gartley is the one we took as an example in the images above. It starts with a bullish XA move. AB is then bearish. BC is bullish, and CD is bearish again.
In this manner, the expectation of the pattern is a reversal of the CD move. This means that the expected outcome from the bullish Gartley is a price increase from Point D:
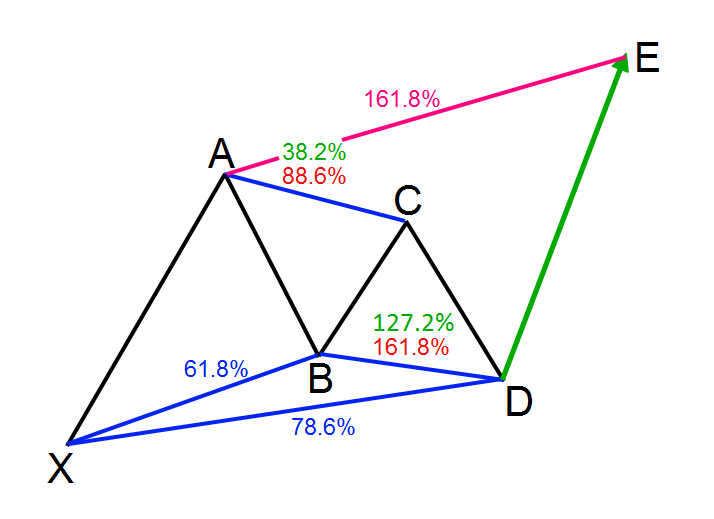
This is the bullish Gartley. The green arrow on the image represents the expected price move of the bullish Gartley pattern. The full target of the pattern is the 161.8% Fibonacci extension of the AD move, which resembles the AB=CD pattern upon completion. However, there are three intermediary targets before that.
Target 1: B Swing
Target 2: C Swing
Target 3: A Swing
Target 4: E (161.8% of AD)
These four levels on the chart are the four minimum targets of the bullish Gartley. That doesn’t mean that the bullish trend will end when the price completes point E. You are always free to use additional price action rules or a trailing stop to attain further out exit points on your trade.
Bearish Gartley Pattern
The bearish Gartley pattern is the absolute equivalent of the bullish Gartley pattern, but inverted. In this manner, the bearish Gartley has a bearish XA move, a bullish AB move, a bearish BC move, and a bullish CD move. This means that the potential of the bearish Gartley is a price decline from Point D. The generally expected price target of the bearish Gartley is the 161.8% extension of the AD move. Below you will see a sketch of the bearish Gartley setup.
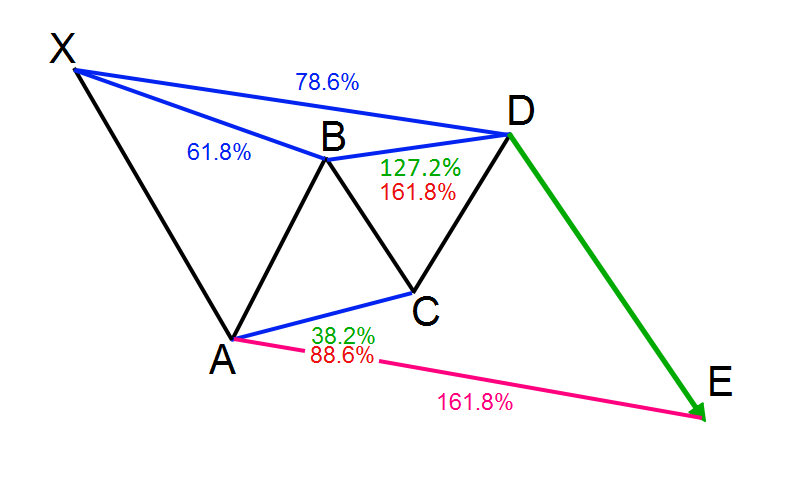
As you see, the figure is absolutely identical to the bullish Gartley, but everything is upside down. Therefore, the pattern shares the same target rules with the bullish Gartley:
Target 1: B Swing
Target 2: C Swing
Target 3: A Swing
Target 4: E (161.8% of AD)
Again, when the target at point E is completed, it is not necessary to close your short trade out entirely. You can always stay in for a further price decrease by using price action rules or a trailing stop.
Gartley Trading Strategy
Now that you are familiar with the Gartley identification rules, I will show you a simple way to trade this chart pattern. Our Gartley trading method objectively pinpoints the proper location of the entry point, stop loss, and exit point.
Gartley Trade Entry
In order to enter a Gartley trade you should first identify the pattern and then confirm its validity. To draw the Gartley pattern on your chart, you should outline the four price swings on the chart and check to make sure they respond to their respective Fibonacci levels. Make sure to mark each price action swing with the relevant letter X, A, B, C, and D. This way you will be able to gauge the general size of the pattern and have a clear idea about the parameters. If you have a bullish Gartley figure on the chart, you can open a long trade when you identify these two conditions:
- CD finds support at 127.2% or 161.8% Fibonacci level of the BC move.
- The price action bounces in a bullish direction from the respective Fibonacci level.
When the Gartley pattern is bearish, then you use the same two rules to open a trade. However, in this case your trade will to the short side.
Gartley Stop Loss
Regardless of your preferred entry signal, it is always recommended that you use a stop loss order. This way you will protect yourself from any rapid or unexpected price moves. If you open a bullish Gartley trade, your stop loss order should be located right below the D point of the pattern. If you open a bearish Gartley trade, your stop loss order should be located right above the D point of the pattern. Below you will find an image showing you the proper location of a Bullish Gartley stop loss order:
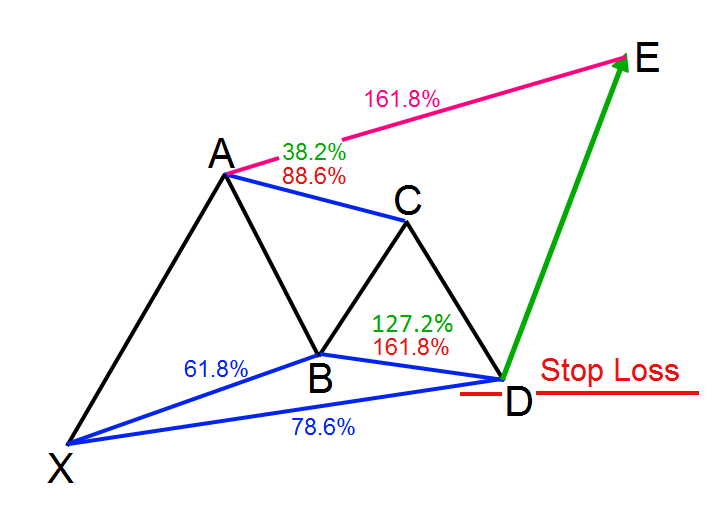
The sketch above shows you the exact location of a properly positioned stop loss order of a bullish Gartley pattern.
Gartley Take Profit
When you open your Gartley trade and you place your stop loss order, you expect the price to move in your favor, right? And if and when it does, you should know how long you expect to stay in the trade.
My preferred method for trading Gartleys is to enter a full position after the D bounce and then scale out at different levels. As mentioned earlier, the targets that I look for are as follows:
Target 1: B Swing
Target 2: C Swing
Target 3: A Swing
Target 4: E (161.8% of AD)
Then if the price momentum continues to show signs of strength, you can opt to keep a small portion of the trade open in an attempt to catch a large move. You would want to use price action clues such as support/resistance techniques, trend lines, channels, and candle patterns to find an appropriate final exit point. But in general, if the price action shows no signs of interrupting the new trend, just stay in it for as long as you can.
Gartley Trading Example
Now we will apply the rules we discussed above into a practical trading example using a Gartley indicator. We will open trades after identifying the pattern rules and after the price action bounces from the 127.2%/161.8% Fibonacci retracement level of BC. We will place a stop loss order beyond point D on the final Gartley swing. We will attempt to stay in our trades until price reaches the four targets we discussed. Ok so let’s see how this all looks:
Bullish Gartley Pattern Example
The image below is a bullish Gartley pattern example:
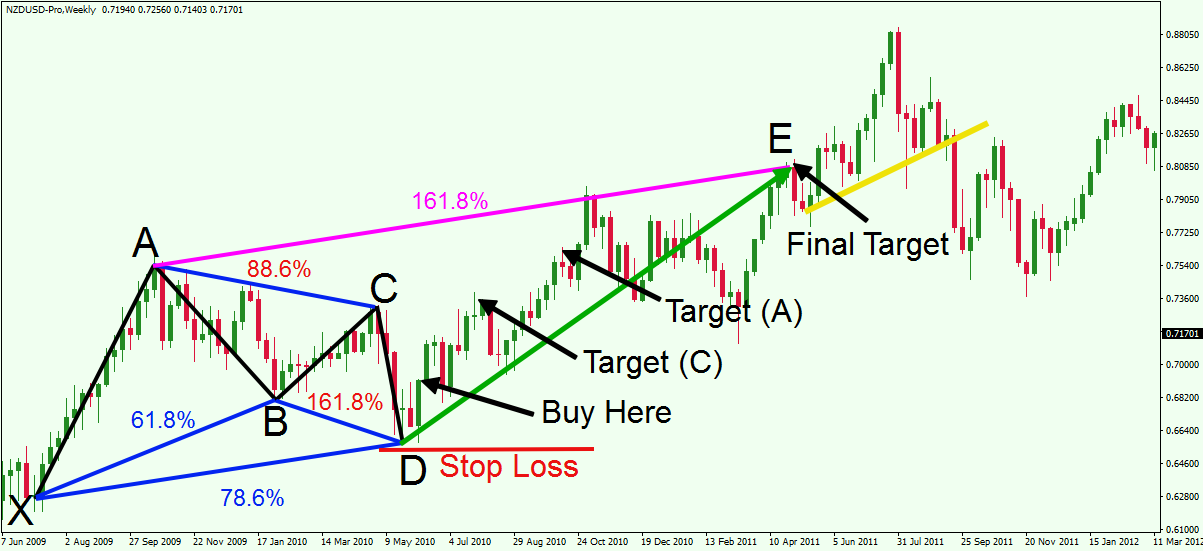
You are now looking at the weekly chart of the NZD/USD Forex pair. The image illustrates a Gartley pattern using a Metatrader MT4 Gartley indicator.
The figure consists of a bullish XA, bearish AB, bullish BC, and bearish CD. AB is 61.8% of XA, BC is 88.6% of AB, CD is the 161.8% extension of BC. At the same time, AD is 78.6% of XA. Therefore, we confirm the presence of a bullish Gartley pattern on our NZD/USD chart.
Since this is a bullish Gartley setup, the expected price move is to the upside. For this reason, we would prepare to buy the NZD/USD pair when CD finishes at the 161.8% of BC and the price action bounces upwards. When this happens, we want to go long putting a stop loss below point D as shown on the image.
The first target of this long trade is located at the level of point B. The price bounce after the creation of point D is sharp and it instantly completes this target. The second target is at point C and it gets accomplished 7 periods after we buy the NZD/USD Forex pair based on our bullish Gartley strategy. Then 10 weeks later the price action reaches the level of point A, which is the next target on the chart. However, we are not done yet. We have our last target on the chart. It is located at the 161.8% Fibonacci extension of the AD price move. This target takes a little bit longer to be complete. Twenty-seven periods after the previous target is achieved, the price action manages to reach the 161.8% extension of AD.
We can attempt to stay in this trade for further profit and use price action signals to guide us. As you see, the price creates a couple more peaks on the chart. Notice the adjoining bottoms of these peaks create a small bullish trend line on the chart (yellow), which we can use to settle a final exit point on the chart. The breakdown through this trend line is very sharp and it is created by a big bearish candle. In this case, we would have been better off had we exited the trade altogether at the last fixed target.
Bearish Gartley Pattern Example
Now we will demonstrate an example using the bearish Gartley pattern
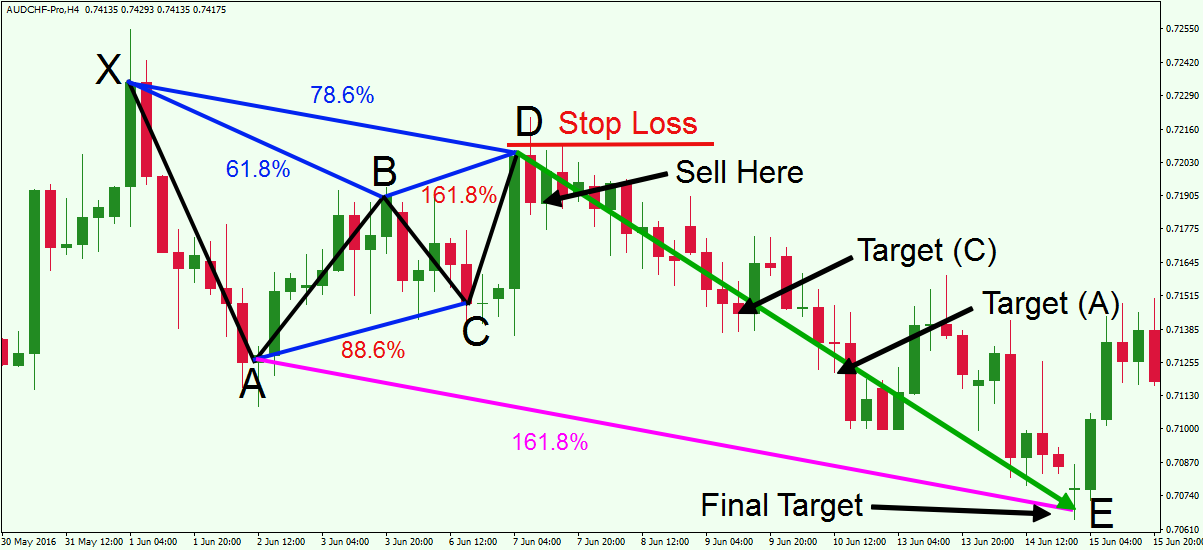
This is the H4 chart of the AUD/CHF Forex pair. The image illustrates another Gartley pattern, where we apply our trading strategy.
The figure starts with a bearish XA move. AB is then bullish and BC is bearish. CD then reverses the bearish BC move. AB takes 61.8% of XA. BC is the 88.6% level of AB. CD reaches the 161.8% extension of BC. When the CD move is finished and the price creates a bearish bounce from the 161.8% extension of BC, we confirm the validity of a bearish Gartley Pattern. In this manner, we would prepare to sell the AUD/CHF Forex pair, placing a stop loss order above the swing at point D.
After we sell the AUD/CHF, and place our stop loss, we want price to start pursuing our targets. The first target at point B gets completed at the moment of the bearish bounce after the CD move. Therefore, this target is accomplished even before we manage to enter the market. The next target is located on the level of point C and the price action reaches it 14 periods after the short Gartley signal. The price then proceeds its down move and 6 periods later the AUD/CHF pair reaches the target at point A.
Now there is one more target left, which is located at the 161.8% extension of the AD move. Fourteen periods after price reaches the A target, we see that the final target is reached. Therefore, you could close the deal here and collect your realized profit.
Conclusion
The Gartley formation is part of the harmonic family of patterns.
Other names for the Gartley pattern:
- Gartley 222 pattern
- 222 pattern
The pattern looks like an M/W and its swings are designated with the points X, A, B, C, and D.
As a harmonic pattern, the Gartley swings should correspond to specific Fibonacci levels:
- XA could be any move on the chart.
- AB should be 61.8% of XA.
- BC should be either 38.2% or 88.6% of AB.
- If BC is 38.2% of AB, CD should be the 127.2% extension of BC. If BC is 88.6% of AB, CD should be the 161.8% extension of BC.
- The general AD move should be 78.6% of XA.
There are two types of Gartley patterns:
- Bullish Gartley Pattern: XA is bullish; AB is bearish; BC is bullish; CD is bearish
- Bearish Gartley Pattern: XA is bearish; AB is bullish; BC is bearish; CD is bullish
The price targets of the Gartley pattern are:
- Target 1: The level of point B
- Target 2: The level of point C
- Target 3: The level of point A
- Target 4: E (161.8% of AD)
- You can attempt to stay with your trade beyond the fourth target by using price action clues or a trailing stop.
The rules for trading the Gartley chart figure are as follows:
- Open a trade when the price completes the CD move and bounces in the opposite direction.
- Put a stop loss at the end of the CD move beyond the D point in order to protect your trade.
- Attempt to stay in the trade for each of the four targets.
- If you want to extend your gains, you can opt to keep a portion of the trade open in order to try to catch a larger move.