If you have studied harmonic patterns, then you should be familiar with the more popular types of patterns within the harmonic trader’s collection including Gartley, Bat, Butterfly, Crab, and Cypher patterns. But there is also a slightly less known, but equally effective Harmonic pattern called the ABCD pattern. So in today’s lesson we will discuss the AB=CD pattern in depth and show you how to best use it within your personal trading program.
What is the AB=CD Pattern
The ABCD pattern is part of the well-known harmonic group of patterns. Some traders refer to the ABCD pattern as AB=CD, so for the purposes of this discussion, we use the terms interchangeably.
The ABCD is considered the simplest harmonic pattern. One of the reasons for this is that it has significantly less requirements than most of the other harmonic setups. In addition the ABCD formation is much easier to recognize on the price chart. Let’s take a look now at what the AB=CD pattern looks like.
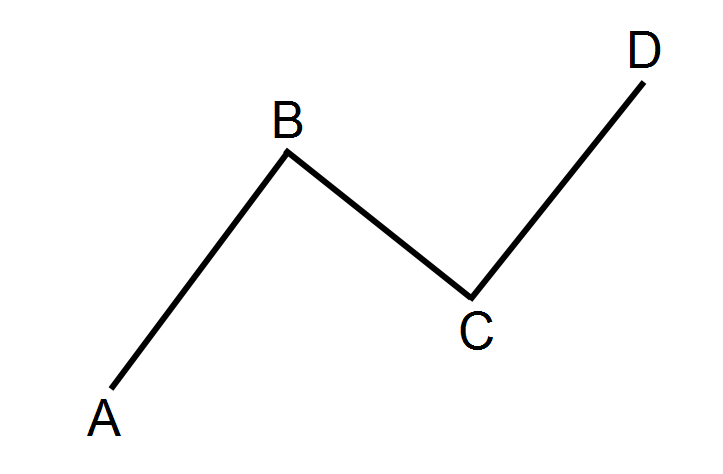
The price action behavior of the ABCD pattern starts with price moving in new direction (A) which later creates an important swing level (B), then retraces a portion of the A leg (C), and finally resumes to take out the important swing created at B, and continues until it reaches a distance equivalent to AB (D). And so when the CD leg reaches an equivalent distance to the AB leg, we expect a reversal of the CD price move. At the same time, BC and CD should respond to specific Fibonacci levels.
When the AB=CD pattern is confirmed, traders will look to set entry points on the chart right at the beginning of the emerging reversal after the CD move. The idea is to be in the market early with a trading position just after the reversal of the CD move.
There are two types of ABCD patterns – bullish AB=CD and bearish AB=CD
Bullish AB=CD
The Bullish ABCD pattern starts with a price decrease (AB), followed by a reversal and an increase (BC). The BC move then gets reversed into a new bearish move (CD), which goes below the bottom created at point B. This is all shown on the sketch below:
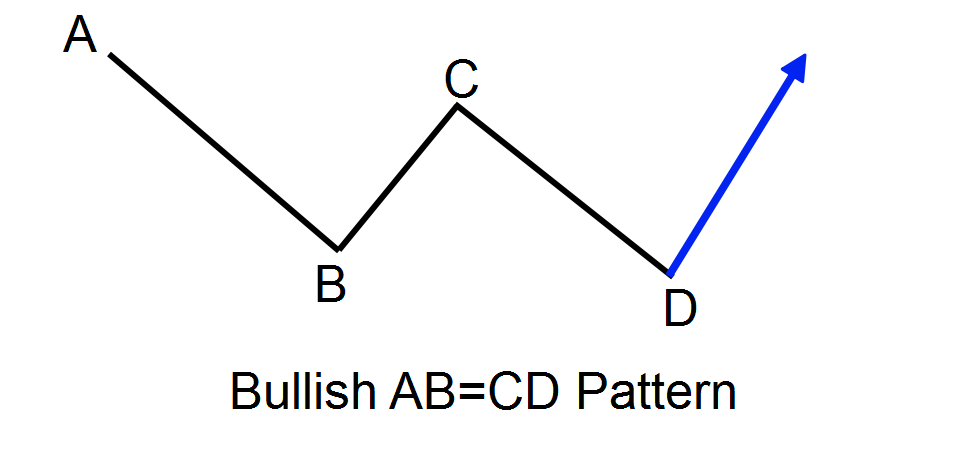
This is a standard bullish AB=CD pattern. After the price completes the CD price move, we expect a reversal and a price increase. This is shown with the blue arrow on the chart.
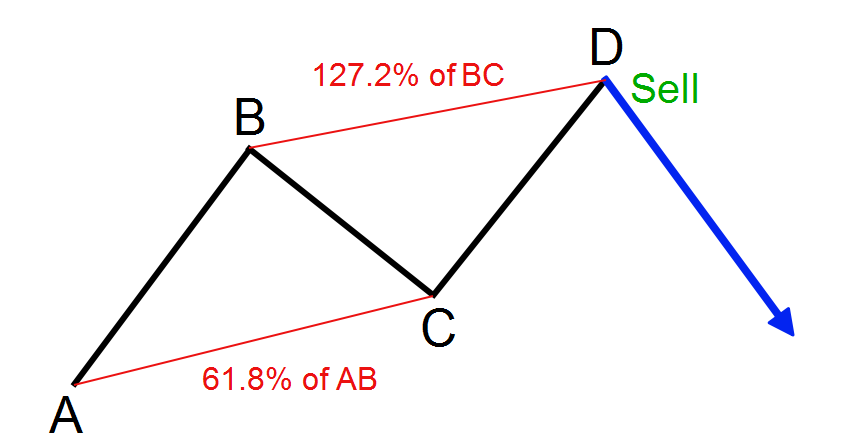
Bearish AB=CD
The Bearish AB=CD chart pattern is absolutely the same as the bullish AB=CD, but everything is upside down. The pattern begins with a bullish AB line, which gets reversed by a new bearish move (BC). The BC move then gets reversed by a new bullish move (CD), which goes above the top at point B.
When you get these characteristics on the graph, you can expect the price to reverse again creating a new bearish run.
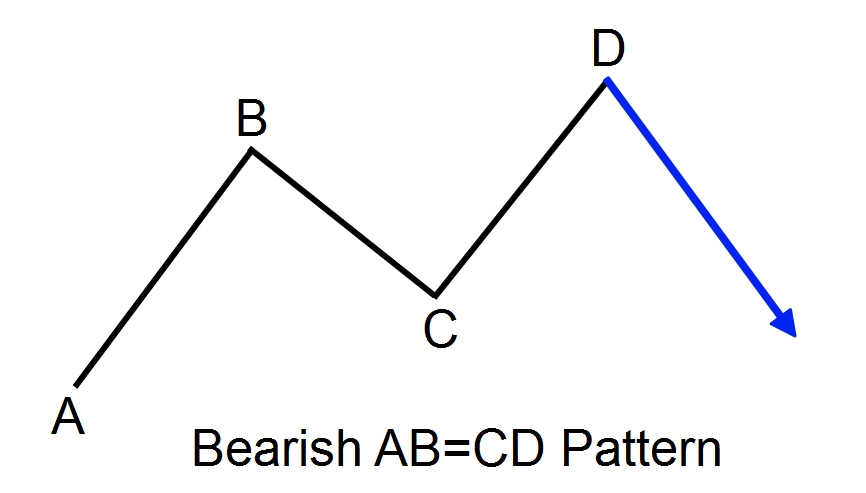
The bearish potential of the pattern is shown with the blue arrow on the sketch above.
Take note that there are three price moves prior to the confirmed AB=CD pattern, the AB leg, the BC leg and the CD leg. And only when the CD leg reaches a distance equal to the AB leg, are we looking to initiate a trade.
As you see, the bullish and the bearish ABCD patterns are a mirror image of each other. Therefore, the same trading rules are applied to each of them, but in the opposite direction.
Fibonacci Ratios in the AB=CD Pattern
The AB=CD chart pattern needs to conform to specific Fibonacci ratios. Below you will find a list of the Fibonacci levels, which are associated with the AB=CD trading pattern.
There are two Fibonacci rules associated with the AB=CD figure:
- BC is the 61.8% Fibonacci Retracement of AB.
- CD is the 127.2% Fibonacci Extension of BC.
You should always confirm the Fibonacci levels when trading the ABCD pattern. There are several free AB=CD Fibonacci indicators available for Metatrader to help you in confirming the pattern requirements as well.
Let me now show you how the Fib ratios are incorporated into the ABCD pattern:
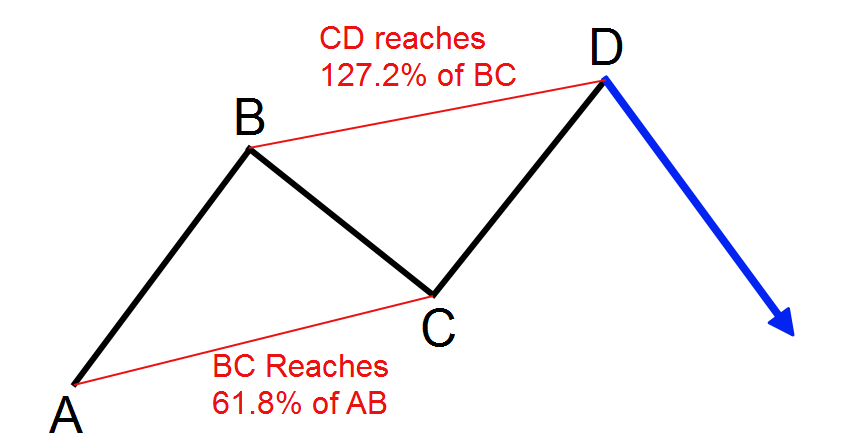
As you see on the image above, BC should be 61.8% of AB and CD should be the 127.2% extension of BC. At the same time, the AB and CD price moves should be of equal distance and take approximately the same time to develop.
In other words, if you see the price action creating an AB=CD pattern and at the same time the swings are conforming to the specific Fibonacci Ratios, then you can safely assume that you have a very strong, high probability signal on the chart.
AB=CD Trading System
It is a good idea for the novice Harmonic trader to start with the ABCD setup before moving to the more advanced Harmonic chart patterns like the Crab, Bat, or Butterfly to name a few.
So then, let’s discuss how you can trade the Harmonic ABCD pattern. Since it is a unique chart formation, it has its own set of rules for trading. If you learn how to implement this set of rules, you can expect to trade the ABCD chart pattern with a positive edge. It’s advised that you examine the following section outlining the set of rules with a high attention to details.
AB=CD Entry Point
To enter the market on the AB=CD chart pattern you would first need to attain confirmation for the pattern’s validity. This means you will need to find two parallel price swings which are equal in size (AB=CD). At the same time, BC should be the 61.8% retracement level of AB and CD should be the 127.2% extension of BC. Meanwhile AB should also equal CD in terms of time. If you are able to identify these characteristics on the price chart, then you are probably looking at a valid AB=CD pattern.
After you confirm the pattern, you should enter the market at the moment when the price action during the CD move bounces from the 127.2% extension of the BC move. You should initiate a trade in the direction of the bounce which is counter to the CD leg.
The illustration above depicts a bearish ABCD pattern. You should look to short when the CD move reaches the 127.2% Fibonacci extension of move BC and then bounces downwards.
The same is in force with the bullish ABCD pattern. The difference though is that everything will be upside down.
AB=CD Stop Loss
When you open a position based on an AB=CD signal you should set a stop loss order so that you will be protected in case of unexpected price moves against your trade. The proper location of your stop loss would be just beyond the price extreme formed at the end of the CD move.
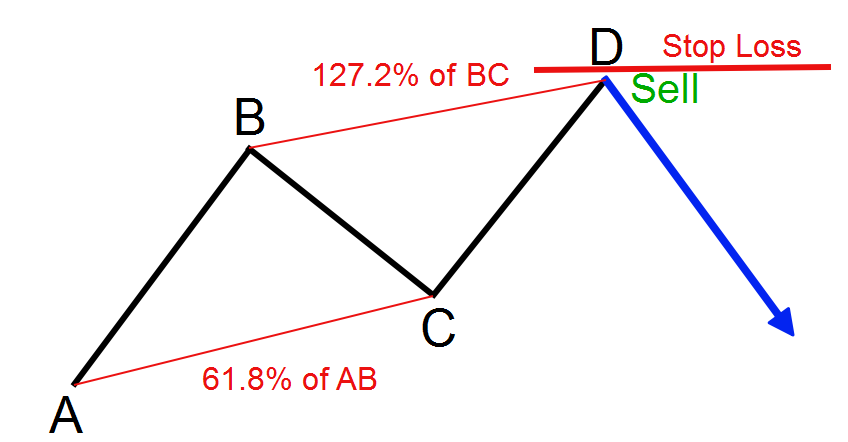
This is the same sketch from above. This time, we have pointed the proper location of the stop loss order with the thick red line on the image.
As we discussed earlier, the AB=CD pattern gives us the opportunity to trade a price reversal right from its beginning. In other words, we open the trade with the emerging of the new trend. This means that our entry point and our stop loss order are very close to each other. In this manner, the ABCD Forex strategy provides a very attractive win-loss ratio.
AB=CD Take Profit
The minimum target which you should pursue with your ABCD trading system is a price move which is equals to the CD leg in size. In this manner, the place where the CD move started emerging is your target. Have a look at the example below:
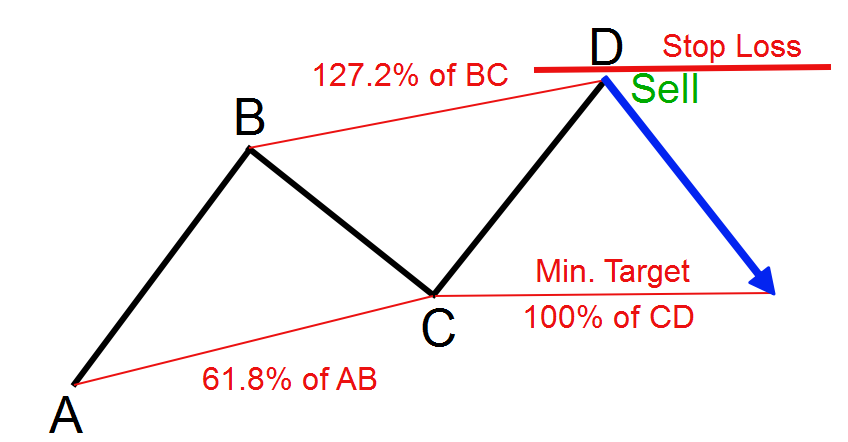
The price move, which is expected to appear after CD, should reach the 100% Fibonacci Retracement of CD. In other words, the price action which comes after CD should equal CD in size as shown on the sketch above. However, this is the minimum potential of the formation. In other words, the price could extend its move further and it would be to our advantage if we were to keep a portion of the trade open in order to catch a bigger move.
Therefore, after the price completes the minimum target, I typically close 50% of the position size and keep 50% open in the trade to try to ride the continued momentum.
And when doing so, it’s important to keep an eye out for price action clues using support and resistance levels, trend lines, price channels, chart patterns, or candle formations. When you find the weight of evidence shifting in the opposite direction, you should close your trade with your realized profit.
Trading the ABCD Setup
Now that we discussed the ABCD pattern and the associated trading rules, we will now combine all of these concepts into a complete ABCD trading strategy.
We perform an AB=CD chart analysis. The next most important step is to validate the pattern.
This means we must evaluate the BC leg and make certain that it is a 61.8% retracement of AB, and that CD reaches the 127.2% extension of BC. At the same time, the AB leg should equal CD leg in terms of size and duration.
If the pattern is bullish we can go long placing a stop loss below the D point. Then we should stay in the trade at least until the price reaches the level of point C.
If the pattern is bearish, then we should short the Forex pair putting a stop loss order above point D. Then we should stay in the trade at least until the price reaches the level of point C.
Let’s now combine these concepts and bring our attention to AB=CD example on an actual chart:
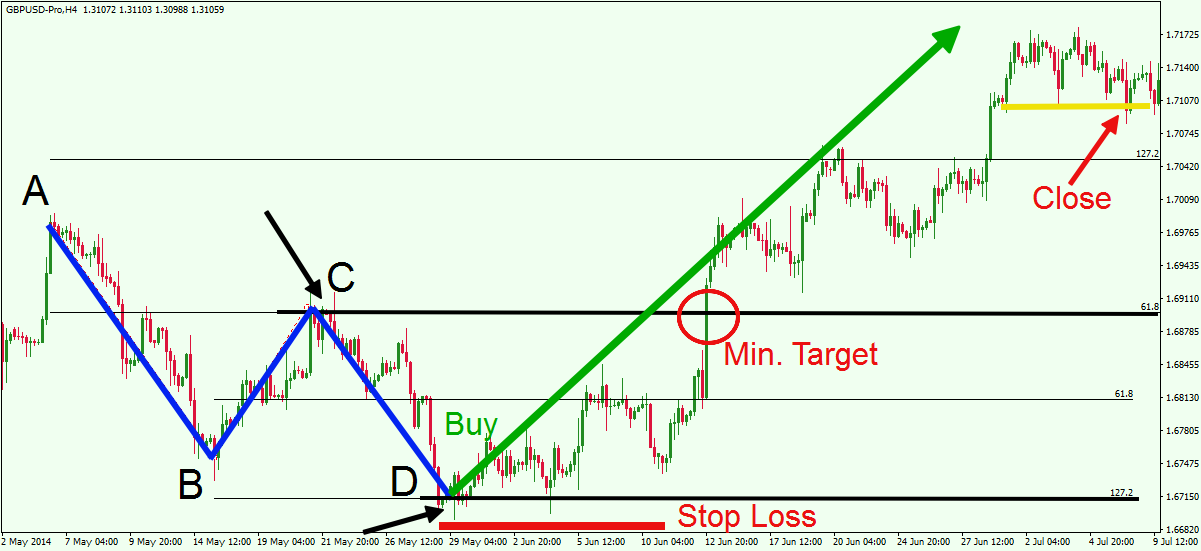
You are now looking at the 4-hour chart of the GBP/USD for May – July, 2014. Our ABCD swing analysis identifies an AB=CD chart pattern on the graph. The pattern is displayed with the blue lines on the image. The black horizontal lines and the black arrows correspond to the respective Fibonacci levels. See that AB is approximately equal to CD. Also, AB takes approximately the same time to develop as CD. BC is the 61.8% Fibonacci Retracement of the AB move and CD is the 127.2% extension of BC. Therefore, we confirm the validity of the ABCD formation on the chart.
As you probably have noticed, we have a bullish ABCD pattern on the chart here, because the AB and the CD swings point downwards. In this manner, we expect that this valid ABCD pattern leads to a bullish price move.
The CD move finishes in the area of the 127.2% Fibonacci extension of the BC move and the price then bounces upwards. Once you have noticed this, it’s time to execute a long trade. You should place your stop loss order below the lowest point of the CD swing as shown with the red thick line on the chart.
After a few tests of the 127.2% Fibonacci extension, GBP/USD price starts increasing. A couple of weeks afterwards, the Cable price reaches the minimum target of the pattern. In other words, the price increases to the level of the C top. Here we would have two viable options – to either close the trade in full and to collect the realized profit, or close a portion of the trade and keep a portion open in order to catch a further price move.
In this particular case if you had decided to stay in the trade for further profit, your decision would have been rewarded. On the way up, the price creates only higher bottoms, and doesn’t test any critical support areas, which bolsters our long position. Therefore, the best course of action is to hold the trade further until the price breaks one of its support levels. This happens on July 4, 2014 when the GBP/USD decreases through the level of its last bottom, which we have marked with yellow on the chart. This would have provided an exit signal on this trade.
Notice that the minimum target of this ABCD pattern is only half of the total price move from this example. This shows why it is so important to try to ride a winning trade for as long as the market allows.
Let’s now approach another AB=CD Forex pattern:
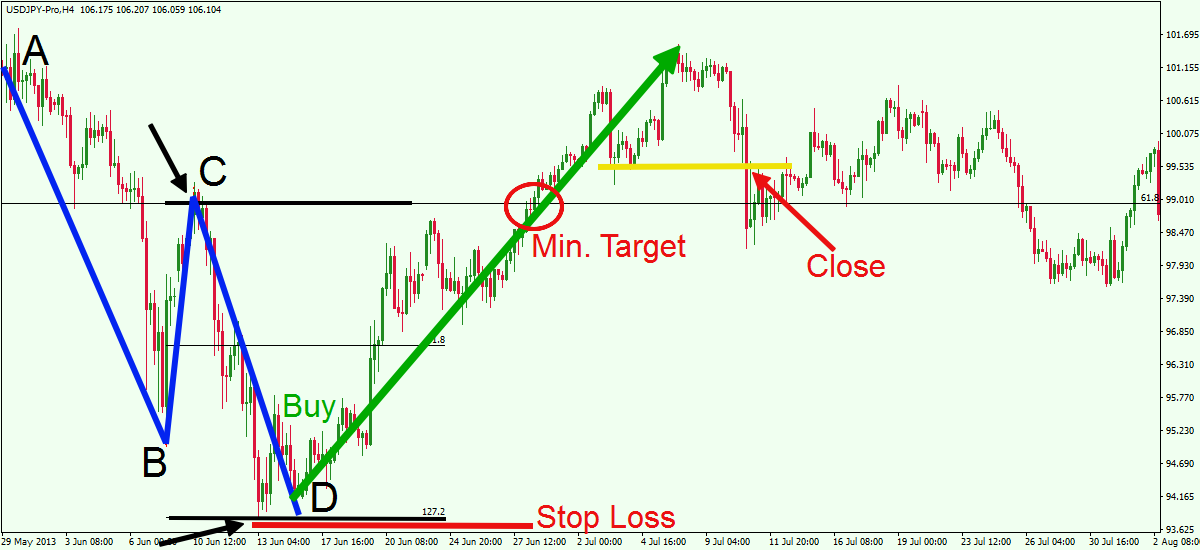
This time, we have the 4-hour USD/JPY Forex pair on the chart. The Time frame covered is June – Aug, 2013. The image displays a bullish ABCD pattern. The blue lines on the image outlines the pattern from point A to point D. The black horizontal levels on the image and the two black arrows correspond to the respective Fibonacci levels and the directional shift in price after interacting with the levels.
Move AB is approximately equal to move CD in terms of size and time to develop. At the same time, BC retraces 61.8% of the AB move and CD has reached the 127.2% Fibonacci extension of the BC move. Therefore, we confirm the validity of the pattern.
Since the figure above represents a bullish ABCD pattern, we would look to buy the USD/JPY Forex pair after the price bounces from the 127.2% extension of BC.
Once we realize the price bounce off the 127.2% extension level, we can see price starts its upward movement. A few weeks after the long signal on the chart, the price action completes the minimum target of the bullish ABCD pattern. Again, we would face two viable options at this moment – to close the trade in full and collect the generated profit, or keep a portion of the position open and stay in the trade for a potential price increase.
If you decided to trade the USD/JPY further, you would experience another price impulse in the bullish direction. However, the results are not as profitable as in the previous example. Two weeks after the minimum target is completed, the price action creates a very big bearish candle which breaks an important support on the chart. We have marked this support with the yellow horizontal line on the image above. This creates a relatively strong sell signal on the chart and any long positions at this point become suspect.
Conclusion
- The AB=CD pattern is one of the most basic harmonic patterns.
- Requirements of the AB=CD formation:
- AB should equal CD in terms of size.
- AB should equal CD in terms of time to be created.
- BC should be the 61.8% retracement of AB.
- CD should reach the 127.2% extension of BC.
- There are two types of ABCD patterns:
- Bearish ABCD – AB is bullish, BC is bearish, CD is bullish. The potential outcome is bearish.
- Bullish ABCD – AB is bearish, BC is bullish, CD is bearish. The potential outcome is bullish.
- A high probability ABCD trading system for a bearish AB=CD pattern is below: ( the opposite would be true for a bullish AB=CD setup:
- Confirm the validity of the pattern with the size of the AB and CD, as well as with the respective Fibonacci levels.
- Sell when after CD reaches the 127.2% Fibonacci extension of BC and the price action bounces from this level.
- Put a stop loss above the D point on the chart.
- Stay in the trade for a minimum price move equal to the size of CD.
- Keep a portion of your position open for the possibility of a further price move and utilize simple price action rules for a final exit signal.