The three drives pattern is a harmonic formation that helps clue us into the possibility of a market reversal following a prolonged price trend. We will study this price pattern from a few different perspectives. You’ll learn the most important Fibonacci ratios within the pattern, the best times to trade the 3 drives pattern, and develop a trading strategy around it.
Harmonic Three Drives Pattern
The three drivers pattern is one of several patterns which are classified under the harmonic class of price patterns. The three drives pattern was outlined in Scott Carney’s book, the Harmonic Trader. The pattern is similar to the ending diagonal structure which is referenced within the Elliott wave theory. Essentially, it is an exhaustion pattern that occurs in both uptrends and downtrends after a prolonged directional price move. It indicates waning momentum in the direction of the prevailing trend, and calls for a potential reversal in the market.
The pattern appears as three legs forming swing highs in an uptrend, and as three legs forming swing lows in a downtrend. These legs are also known as drives, as the name of the pattern implies. The upshot of this is that the three drives pattern is trend reversal pattern. Although most trend reversals do not exhibit the three drives pattern, whenever it is present, it provides a powerful signal for a trend reversal.
The difference between the pattern as described within the Elliott wave theory, as an ending diagonal versus the pattern as described within the context of Harmonic trading, is in the application of Fibonacci ratios within the pattern. More specifically, within the Elliott wave theory, the description of the three drive pattern, labeled as an ending diagonal, does not require a strict adherence to specific Fibonacci ratios within the overall structure.
On the other hand, the harmonic trader version of this pattern requires a strict adherence to specific Fibonacci ratios within the structure. Said another way, this pattern under the Elliott wave principle can be identified in a more qualitative manner, whereas, under the harmonic trading rules, this pattern would need to be identified in a more quantitative manner. In this lesson, we will be focusing on the more quantitative method for identifying and trading the three drives pattern.
Identifying And Drawing The 3 Drives Pattern
The three drives pattern has a very distinctive look to it. In an uptrend the pattern consists of a series of three consecutive swing highs. In a downtrend the pattern consists of a series of three consecutive swing lows. After the final swing has completed, the market will often make a sharp reversal. Let’s take a closer look at how we would go about recognizing the three drive pattern.
On the illustration below you can see an example of a bullish three drives pattern.
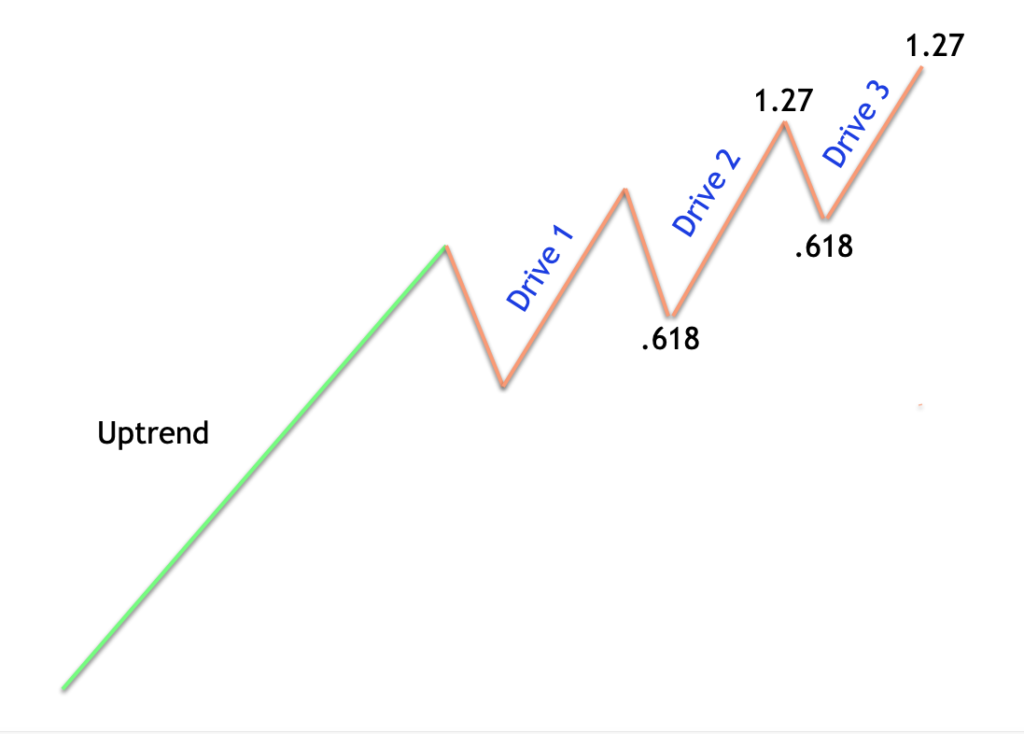
The first thing that we want to look for when identifying a three drives pattern is a strong trend preceding the pattern. So essentially, three drive patterns will occur at the terminal points of strong price rallies and price declines. Notice on this price chart, you can see the strong uptrend leading to the bullish three drives pattern. Next, we will want to measure the respective drives using our Fibonacci toolset. More specifically, we will need to apply the Fibonacci retracement tool, and the Fibonacci extension tool. The Fibonacci retracement tool will measure the corrective pullbacks within the structure, and the Fibonacci extension tool will measure the external impulsive legs within the structure.
Here are the most important Fibonacci ratios and guidelines for the three drives pattern:
- The corrective wave following the initial drive should be a 61.8% retracement.
- You would measure this level using the fib retracement tool, by selecting the high and low points of the first drive.
- The corrective wave following the second drive should also be a 61.8% retracement.
- You would measure this level using the fib retracement tool, by selecting the high and low points of the second drive.
- The second drive should be a 127% extension of the prior corrective wave.
- You would measure this level using the fib extension tool by selecting the high and low points of the corrective wave preceding drive 2 within the structure.
- The third drive should be a 127% extension of its prior corrective wave.
- You would measure this level using the fib extension tool by selecting the high and low points of the corrective wave preceding drive 3 within the structure.
As you can see, the three drives pattern under the harmonic trading rules require a very strict adherence to specific Fibonacci ratios. This pattern can be seen across many different trading instruments and time frames. This includes the equities markets, the futures markets, the Forex market, and the crypto markets. Although, the pattern does appear at varying time frequencies, it is most reliable when seen on the eight hour charts and above. It is especially worthy of attention when it shows up on the daily chart.
During the progression of the three drives pattern, volume will tend to dry up in the instrument, and we will often see a divergence between the price and various momentum oscillators, including the Stochastics, RSI and MACD. These indicators can help provide additional confirmation for trading the potential reversal following the termination of the three drives pattern.
Bullish 3 Drives Pattern
We showed an example of a bullish three drives pattern in the previous section, and described the process of identifying and drawing the pattern on the price chart. Let’s now take a look at the same pattern again, but this time, adding in the potential targets that can be expected following pattern completion.
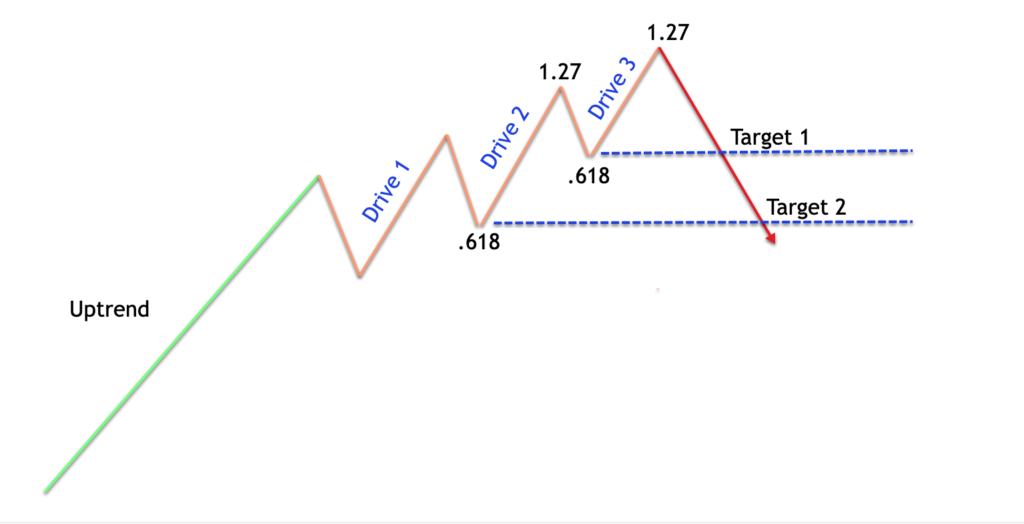
On the illustration above you will notice the targets marked for the bullish three drives pattern. Just to recap, the bullish three drives pattern is a formation wherein there are three legs or drives higher leading to a potential termination point. Additionally, the corrective legs following the first and second drive should be equivalent to a 61.8% retracement. And finally the second and third drives should be a 127% extension of their previous corrective leg.
Now, there are many different ways that a trader can manage their exits with the three drives trading pattern. The traditional method for exiting a position using this formation is to close the trade at the 61.8% retracement of the entire structure.
However, my preferred method is to scale out using two targets. The first target for the bullish three drives pattern is the swing low seen at the start of drive three. The second target would be the swing low seen at the start of drive two. These targets tend to offer the best combination of win rate coupled with a favorable risk reward ratio.
Bearish 3 Drives Pattern
The bearish three drives pattern is the inverse of the bullish three drives version. The rules are the same, with the exception that, the bearish three drives variety is seen within a downtrend.
Let’s take a look at an example of the bearish three drives pattern formation.
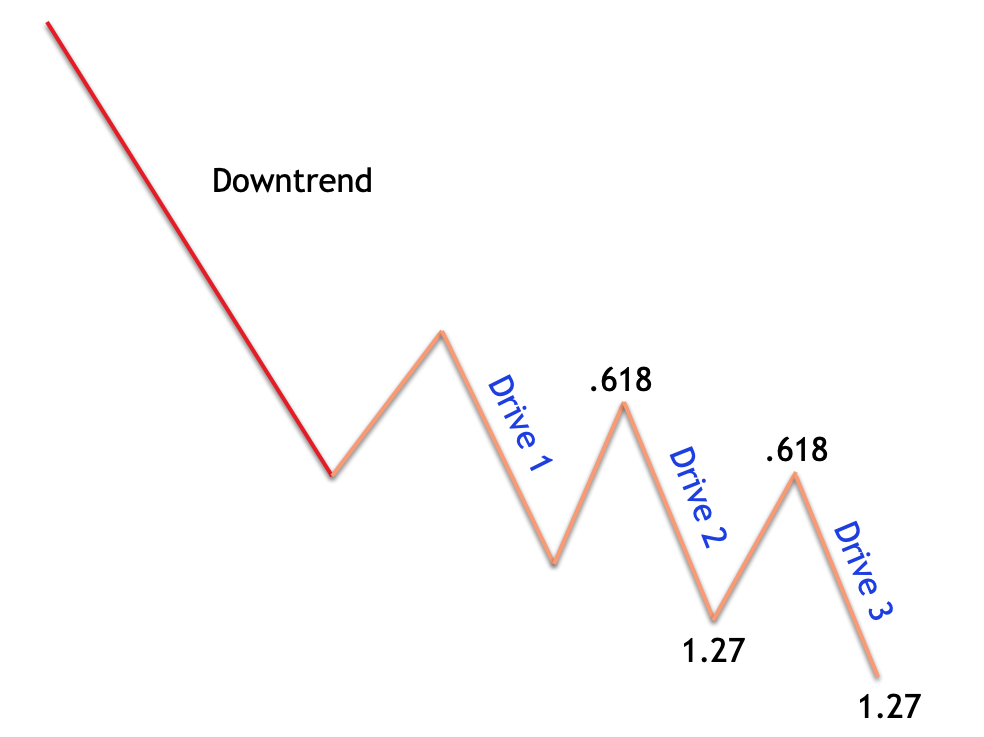
On the illustration above, you can see what the bearish variety of the three drives pattern looks like. Notice how the first and second corrective legs within the bearish structure retraces the previous impulsive legs by the 61.8 retracement level. Furthermore, take note of how the second and third drives within the bearish three drive structure are a 127% Fibonacci extension of their previous respective corrective legs. This creates an idealized version of the bearish three drives pattern. At the termination of the third and final drive, the market will reverse the prior downtrend.
It’s important to note that in real-time market conditions, we have to allow for some flexibility in these measurements. This is because the markets do not provide for idealized scenarios, and as such, applying some good old-fashioned common sense during the evaluation process is a must.
Specifically, what I mean to say is that if the required fib ratios for the three drives pattern fits all but a few measurements, by a slight amount, and those measurements that are off slightly do not inherently distort the overall structure of the pattern, it would make practical sense to continue labeling the structure as a three drives pattern. Obviously, there is a fine line in the use of discretion here. While we do not want to be overly rigid in our assessment, we cannot be too liberal in our labeling rules either.
Now that we have seen what the bearish three drives pattern appears like, let’s now, take a closer look at the target levels as it relates to this bearish version.
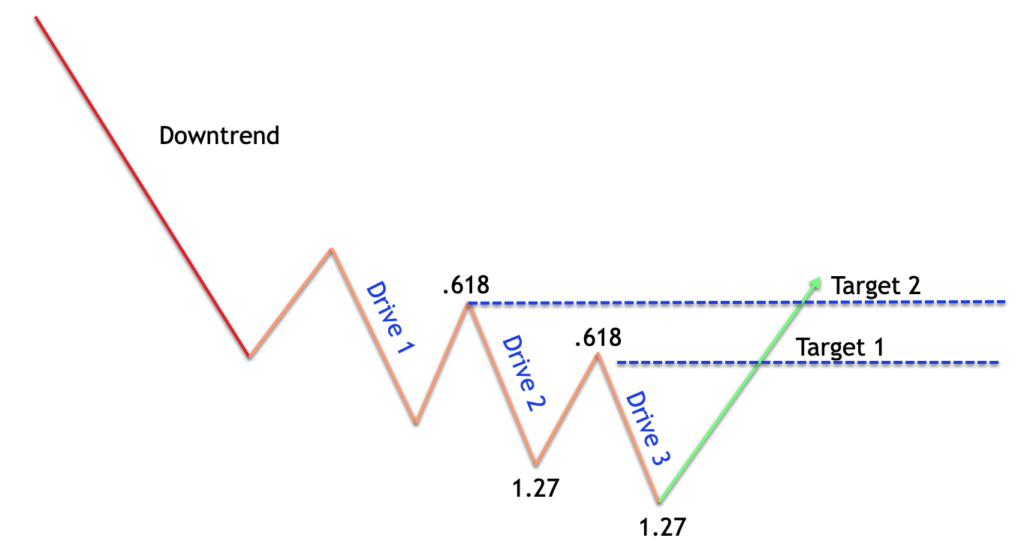
Referencing the image above, you will again note that we will utilize a two tiered target following the termination of the three drives pattern. The first target, the initial target point, will be the swing high of the third and final drive within the pattern. And our second target will be the swing high of the second drive within the pattern. These levels represent areas of resistance where upside price action will be challenged. As such they represent logical levels for taking profits.
Trading The Three Drives Pattern
Let’s now create a trading strategy using the three drive pattern. We have dissected both the bullish and bearish three drives pattern, and have discussed potential target zones for the pattern. We’ll now add in all the necessary components to have a fully functional working model that can be applied to the market. This includes an entry mechanism, a confirmation filter, and risk containment element in the form of a stoploss.
We have described the Fibonacci ratios that are most important within this harmonic structure. Once we have recognized a potential three drives pattern, we will need to go through a repeatable workflow in evaluating the viability of the trading set up. Firstly, we will want to confirm that an established trend exists prior to the development of the three drives pattern. Once we have confirmed this, then we can move on to the next step.
As a requirement for entering into the three drives set up, we will set up a filter that helps establish that the current market is trading at overextended levels. Essentially, we will incorporate the RSI, the Relative Strength Index and look for a reading of at least 70 or above during the bullish three drive pattern. This will validate an overbought market condition. Similarly, we will require an RSI reading of 30 or lower during the bearish three drives pattern, which will help validate the presence of an oversold market environment.
Once the RSI filter has been confirmed, then we will look to execute our entry in the final stages of the third Drive within the pattern. More specifically, a limit order entry will be placed just shy of the 127% Fibonacci extension level. We know that in this pattern both the second drive and the third Drive will extend to this level before pulling back. As such, our strategy will call for entering into that final push just before an imminent reversal. This will serve as the three drives pattern signal.
When our entry order is executed, will need to immediately place a stop loss order on our trade. The stoploss level should be placed at the 161% Fibonacci extension of the last drive within the pattern. This level will typically act as hidden resistance following the three drives pattern in an uptrend, and will provide an area of support following the three drives pattern in a downtrend. As such, we will use that tendency as a means for placing a logical stoploss around this trade setup.
As for the take profit levels, we know that we will be using a tiered exit plan. The first take profit point will be the start of drive three, and the second and final take profit point will occur at the start of drive two. And with that, we now have a complete and fully functional trading strategy for the three drives pattern. In the following section, we will detail both a bullish three drives pattern, and a bearish three tries pattern on actual price charts.
Bullish Three Drives Setup – Trade Example
Now that we have a detailed trading plan for executing the three drives set up, it’s now time to demonstrate what that might look like on the price chart. Below you will find the eight hour chart for the Australian Dollar to New Zealand dollar currency pair.
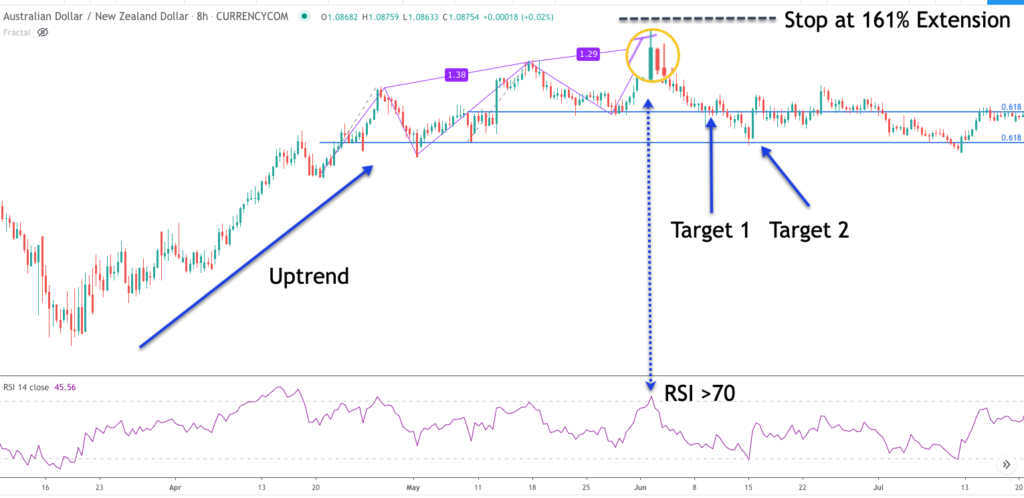
Let’s go step-by-step in analyzing the bullish three drives pattern in forex illustrated on this chart. Firstly, as the market was making consecutively higher swing highs, as can be seen towards the center area of the chart, we would have been alerted to the possibility of a bullish three drives pattern emerging.
You can see the three drives pattern indicator outlined. Notice how after the first drive, the price retraces just beyond the 61% retracement level, and how the after the second drive, price retraces at nearly the 61% retracement level. This can be seen by the two blue horizontal lines running across the price chart.
Furthermore, notice how the second drive extends a bit beyond our ideal fib extension of 127%, and ultimately creates a swing high at the 138% extension level. Although this is not ideal, keep in mind that most patterns in the market will not conform to ideal proportions. But based on the overall structure here it would be considered a viable bullish three drives pattern.
Now, before we move on to trade execution, we must confirm that there is an uptrend prior to the formation of the three drives pattern. Obviously we can see from the price action leading up to the bullish three drives pattern that there was indeed an uptrend present. With that confirmation in place now, the next step would be to analyze the RSI oscillator to confirm a reading of 70 or above at or near the termination of the bullish three drives pattern. If you refer to the blue dotted vertical line you can see that as the third drive within the structure was in progress, that the RSI exceeded the overbought threshold of 70.
Now, it is time to prepare for a short trade entry. As per our rules, a short entry would be executed using a limit order at a price just below the 127% extension of the final drive within the pattern. Note the magnified area on the price chart showing where that entry could have occurred. The final drive terminated at the 129% fib extension, and so our limit order to sell would have been triggered just below this level.
The stoploss would be placed at the 161% extension level of the final corrective leg within the structure. Notice the black dashed line on the price chart that illustrates where the stoploss would have been placed. As for closing out of a profitable trade, we will utilize a two-tiered take profit exit.
The first target will be placed just above the start of the third drive within the structure, and the second target will be placed just above the start of the second drive. Again if you refer to the two blue horizontal lines on the price chart, you can get a sense of where those exits would have occurred. You can also see those levels as shown by the two blue arrows denoted as target one and target two.
Bearish Three Drives Formation – Trade Example
Let’s now take a look at the bearish variety of the three drives set up. Below you will find the price chart of Canadian Dollar vs. Swiss Franc based on the eight hour timeframe.
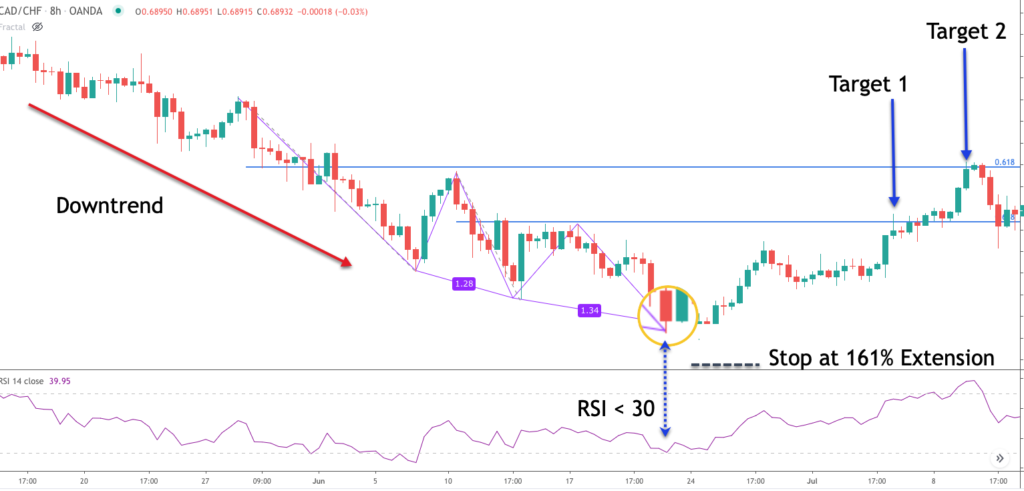
As we can see here, the price action was making a series of lower swing lows and lower swing highs. Towards the center of this price chart we should have been able to recognize an emerging bearish three drives pattern. Once we were clued into the possibility of this pattern forming, we would pull up the Fibonacci retracement and extension tools to confirm the fib ratios within the structure.
Notice how after both the first and second drives within this pattern, price retraced just shy of the 61% retracement level. The two blue horizontal lines across the price chart illustrate the 61% retracement levels following the first and second drives within the pattern. Next, we will use the Fibonacci extension tool to measure the price move within the second and third drives. Notice how the second drive ends at the 128% extension of its prior corrective leg.
With this backdrop in mind, we can conclude that a bearish three drives pattern was forming and which fit our Fibonacci ratio requirements quite nicely. The next step would be to confirm that a downtrend was present prior to the emergence of this bearish three drives pattern. It’s quite clear from the price action and the accompanying downward pointing red arrow that the price action was moving lower steadily in a stairstep fashion.
The next step in the process would be to confirm that the Relative Strength Index, RSI, registers a reading of 30 or below during the downward price movement within the three drives formation. During the final leg of the bearish three drives pattern that the RSI registered a reading of 30, with satisfied the requirement for a potential long set up opportunity.
Based on our trading plan, we would place a buy limit order just before the 127% Fibonacci extension of the final drive within the pattern. Referring to the magnified area within this price chart, you can see that the final drive reached its termination point at the 134% extension level. As such, our buy limit order would have been triggered and placed us into a long position within this currency pair.
The stop loss would be set at the 161% fib extension as noted by the black dashed line towards the lower end of the chart. Finally, we would need to incorporate a two-tiered exit strategy for closing out the trade as the price moved in our intended direction. You’ll notice the two target levels marked, and which correspond to the highs at the start of drive two and drive three.
Summary
The three drives a pattern is a lesser known harmonic pattern compared to the Gartley, Bat, and Butterfly formations. But just as with other harmonic patterns, the three drives and Fibonacci ratios are closely linked. The pattern offers a solid trading opportunity when traded in the right market context, and with the right combination of risk reward setting.
Many harmonic traders simply trade any and all three drive patterns seen on the price chart. However it’s important to recognize that the best three drive patterns occur after a prolonged market move. These scenarios offer the highest probability trading opportunities as it relates to both the bullish and bearish varieties of the three drives pattern. As such, it would be prudent to focus on this harmonic pattern setup only during such times.