The average retail forex trader should be familiar with Fibonacci retracement levels, and may even use it regularly within their trading program. In this article, we will dive into a somewhat lesser known Fibonacci tool that you can also use to find hidden levels of support and resistance. We will introduce you to the Fibonacci extension tool and discuss some technique on how to incorporate it in your own trading.
What are the Fibonacci Extension Levels?
Fibonacci Extensions are also sometimes referred to as Fibonacci Expansions, or Fibonacci Projections and are external levels that go beyond the 100% level. You may already be familiar with these important Fibonacci levels – 23.6%, 38.2%, 50.0%, and 61.8%. These are considered internal retracements that are measured inside of a specific swing being analyzed. But there are important Fibonacci levels that extend beyond the 100% level and where price action tends to react regularly. And these are what we call Fibonacci Extension levels.
As you probably know, Fibonacci levels help us measure the size of the current price move compared to the previous leg. Typically, when measuring for internal Fibonacci retracements, we are looking for corrective price moves within a larger trend.
And when we are measuring for external Fibonacci extensions, we are looking for impulsive price moves after a corrective phase.
In this relationship, you probably figured out that since we are talking about Fibonacci levels beyond 100%, this means that the Fib Projections are used to measure price moves larger than the previous leg.
Fibonacci extensions work similarly to Fibonacci retracements in that you would use them as hidden support and resistance levels in the market. The psychological factor works the same way as with the standard internal Fib levels. Now let me introduce to you these important extension levels:
123.6%; 138.2%, 150.0%, 161.8%, and 261.8%.
How to Calculate Fibonacci Extensions?
I will first start with a brief explanation of how to calculate the basic Fibonacci sequence. The Fibonacci sequence starts from 0 and 1 and then creates a new number by adding the two-previous number. So, this is the calculated Fib sequence:
0, 1, 1, 2, 3, 5 8, 13, 21, 34, 55, 89, 144, and so on…
Now that we know how to create the Fib sequence, let’s take a closer look at the number relationships. You will notice that every number within the Fibonacci sequence gets closer and closer to 61.8% of the following number. And every number from the sequence gets closer and closer to the 38.2% of the number two positions to the right of it. And every number get closer and closer to the 23.6% of the number three positions to the right of it.
So, this is the mathematical basis for the 23.6%, 38.2%, and the 61.8% Fibonacci ratios within the sequence. The 50.0% is simply the midpoint of 0% and 100%, which is another level that tends to have an impact on price action but is not actually a Fibonacci number.
Now let’s switch gears and have a look at the Fib number relationships above 100. These numbers are calculated using the same method but in reverse order.
So, the primary Fib numbers above 100 include: 123.6%; 138.2%, 150.0%, 161.8%, and 261.8%. One simple way to remember these Fibo extension levels is by simply adding 100 to each of the standard Fibonacci levels:
23.6 + 100 = 123.6
38.2 + 100 = 138.2
50.0 + 100 = 150.0
61.8 + 100 = 161.8
And for the 261.8 level, by adding 200 to the most important Fibonacci level – the 61.8% ratio:
61.8 + 200 = 261.8
Typically, you would use Fib Retracements for moves within the trend and switch to Fib Extensions when the price goes through the 100% Fibonacci level of the base trend; this means that the reversal is of a larger magnitude than the measured base trend.
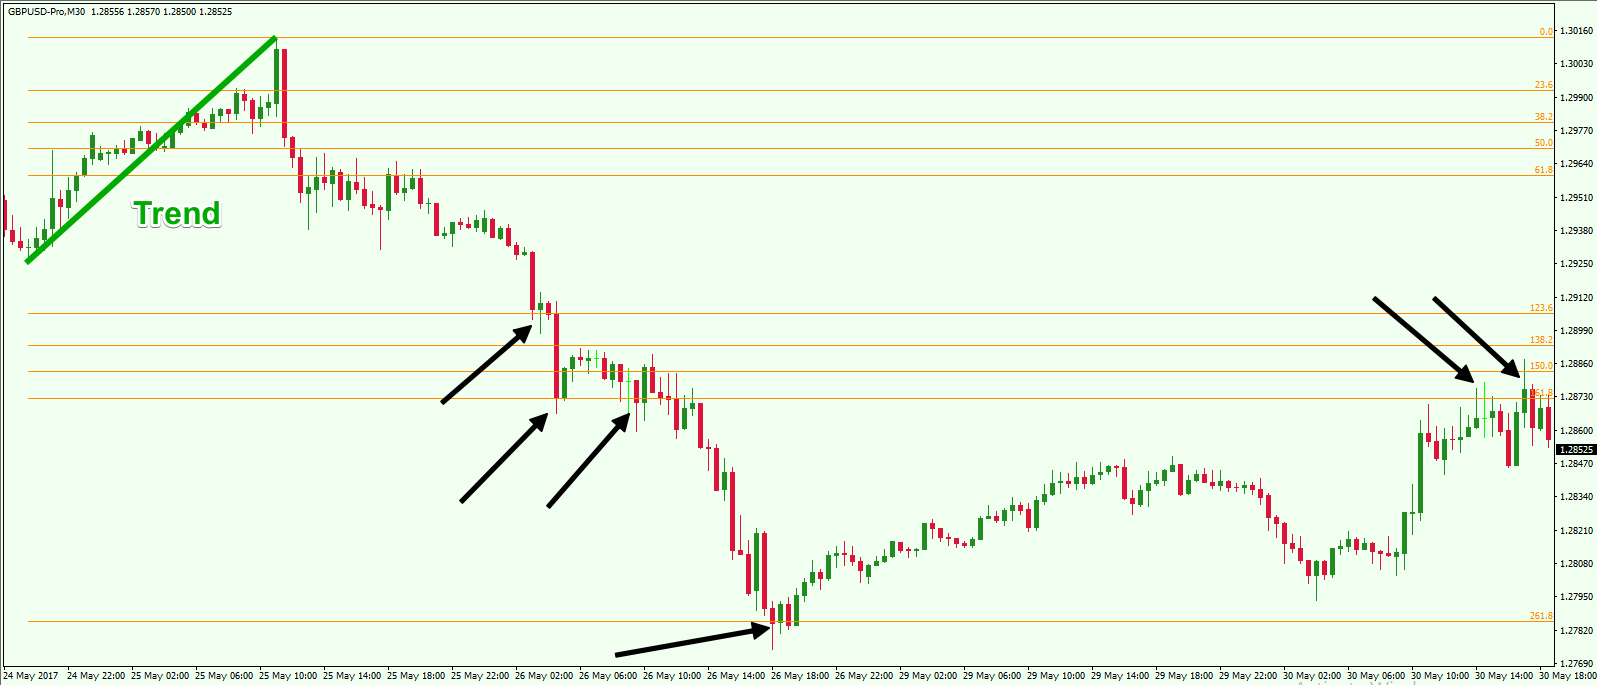
Take a look at this example. It shows the 30-minute chart of the GBP/USD Forex pair for May 24 – 30, 2017. The green line on the chart illustrates a bullish trend. This is what we use to position our Fibonacci indicator. We stretch it between the top and the bottom of this trend, and the levels appear on the chart.
The black arrows illustrate the moments when the price reacts to the Fibonacci extension levels. The first Fib extension is the 123.6% level projected from the base trend. Price pause at this area, and then the price breaks down to the 161.8% level where the price clearly finds support. Then, we see a break down through the 161.8% Fibonacci level and the price drops to the 261.8% level, where it finds further support.
Fibonacci Extension Tool in MT4
Let’s now take a moment to discuss how to place the Fibonacci Extensions tool on your chart. Most trading platforms including MetaTrader 4 have the Fibonacci Extension tool built into their indicator library. In the default version of the MT4 platform, the Fibonacci Extension tool is actually the same indicator that you use for Fibonacci Retracements as well.
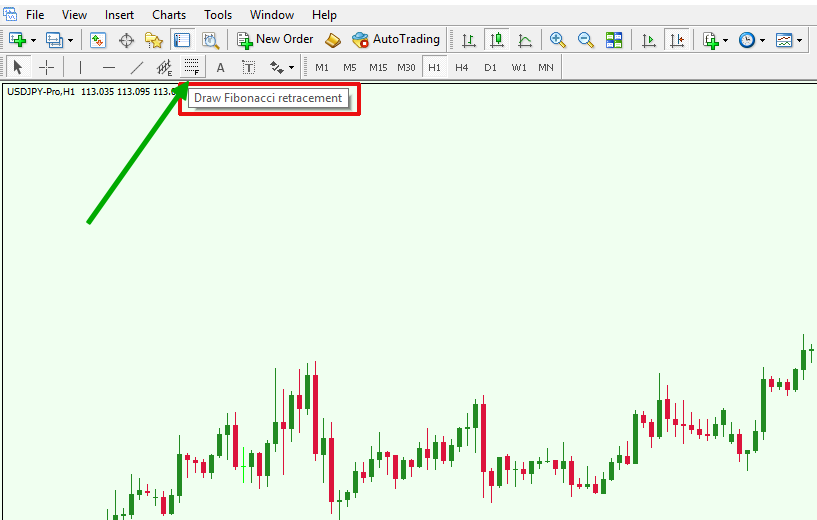
The image above shows you the location of the Fibonacci indicator within your MetaTrader 4 platform. When you click the button, the indicator will be activated, and you will be able to draw the Fibonacci levels.
However, when you apply the indicator to your chart, you will notice that it will only plot the 161.8% and 261.8% Fibonacci extension levels by default.
So, we need to add in the other extension levels manually. You would do this by right-clicking the indicator and choosing “Fibo Properties.” Then you need to go to “Fibo levels” and click on “Add.”
The first field is the value of the level you need. So, if you want to display the 138.2% level, you will need to add “1.382” under “Level.” In the “Description” field simply put “138.2” there, as this is what you will see above that level on the chart.
Do the same for the other Fib extension levels you want to visualize on the chart. The platform will save these preferences, and now the indicator will automatically plot these levels every time you use the Fibonacci Retracement drawing tool.
How to Draw Fibonacci Extensions
The first thing you need to do is to find a trend or swing you want to use as a base. The size of this leg will be used to position the Fibonacci levels including the extensions. Every level you see on the chart will be based on the selected leg.
So, you find and select two swing points, and simply stretch the Fibonacci Extensions tool between the two edges of that swing.
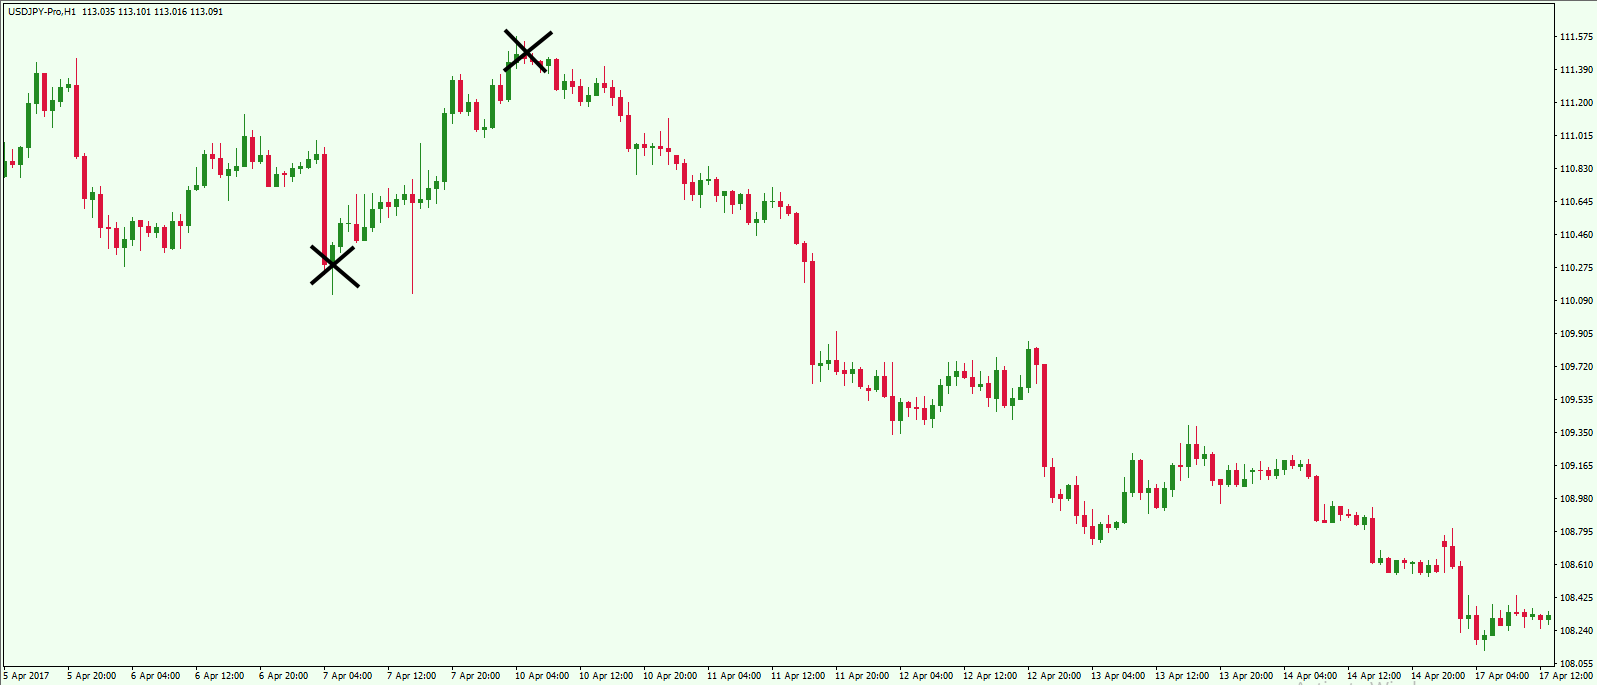
The image above shows an example of how to take the edges of a swing. If you take the two points suggested at the image, the Fibonacci extension levels will be drawn downward along the bearish trend you are seeing.
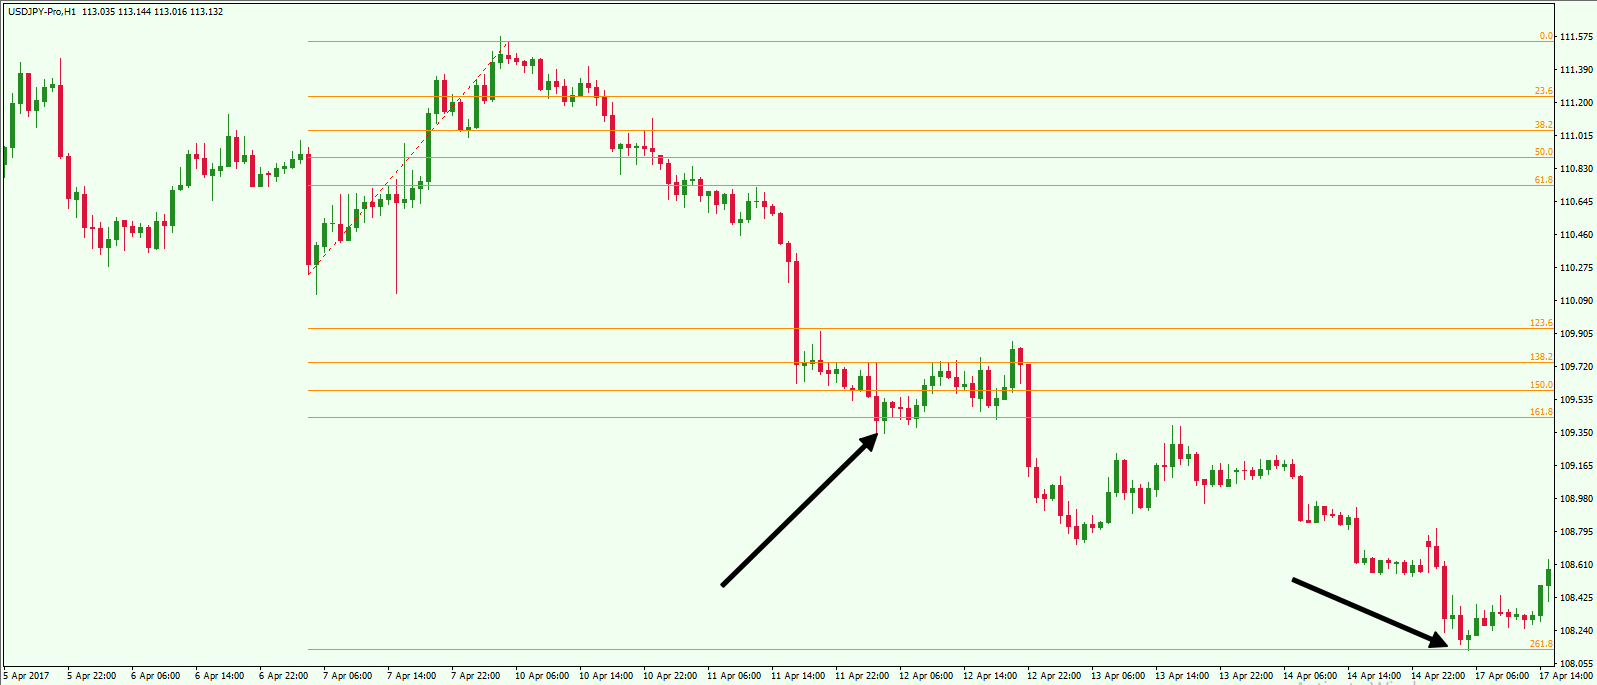
Notice how the price interacts with the Fibonacci extensions. The two black arrows are pointing to the locations where price finds support at the important 161.8% and the 261.8% Fibonacci extensions.
If the swing being measured is bullish, you need to stretch the tool starting from the lowest to the highest point of the swing. If the swing being measured is bearish, then you stretch the indicator from the top to the bottom of the down move. The idea is to have the 0.00% level at the end of the swing that you take as a base.
When you stretch the indicator, the levels will be plotted automatically on the price chart.
Trading Fib Extensions in Forex
Now let’s discuss how using Fib extensions can be a profitable way to approach the market. The first thing you need keep in mind is that Fibonacci Extensions work the same way as the standard Fibonacci retracement levels.
The primary difference is that Fibo extensions represent situations when the current trend is bigger than the base trend – the price extends beyond the 100% level.
Fibonacci Extensions Entry Point
You can consider entering the market on Fibo extensions when the price reacts at or conforms to a level. This could be a bounce or a breakout. If the price bounces from a Fibonacci Extension level, it is possible that price may be stalling or changing direction. In this manner, you might be able to pursue a price move to the previous Fibo level.
In some cases, you will see the price clearly breaking thru a Fibonacci extension level. In this case, you may consider a trade in the direction of the breakout and target the next extension level.
Essentially, you would trade Fibonacci levels in a similar manner to other support and resistance levels. The main difference is that Fib levels are considered hidden levels of Support and Resistance that are not clearly recognizable to non-Fibonacci based traders.
Stop Loss Order
As a general rule, you can place your Stop Loss order at the next level beyond the one that you are trading. In the case when this distance may be too far away from your entry point, then you can simply use a swing top/bottom that is closer to your entry point.
Sometimes, you will need to be creative when determining the best level of your Stop Loss order. You will get a better picture of this from the examples in the next section.
Take Profit Level
In trading, there are no certainties. We are only dealing in possibilites and probabilities. And so it is important to understand that there is no such thing as knowing exactly how far a price move will go. You can always set a minimum target at the next Fibonacci extension. However, you will see that price will very often move farther than this, so you have to evaluate the market condition at each level and act accordingly.
Taking into account other factors such as volatility and average daily range can help in setting logical take profit targets. The more volatile a Forex pair is, the more likely it is to generate bigger moves in a fixed time period. And on the flip side, the less volatile a Forex pair is, the less likely it is to generate bigger moves in a fixed time period.
Also, you should always take into consideration the bigger picture. Is the price approaching a major psychological level on the next higher timeframe? There may be significant clues for a turning point that might not be readily visible to you on your trading timeframe chart.
Trading Example with the Fibonacci Extensions Tool
Now let’s approach some trading examples that will put many of the ideas we have discussed thus far in a clearer light. These examples will help you to understand the process of trading with Fib extensions. Okay let’s look at the first example below:
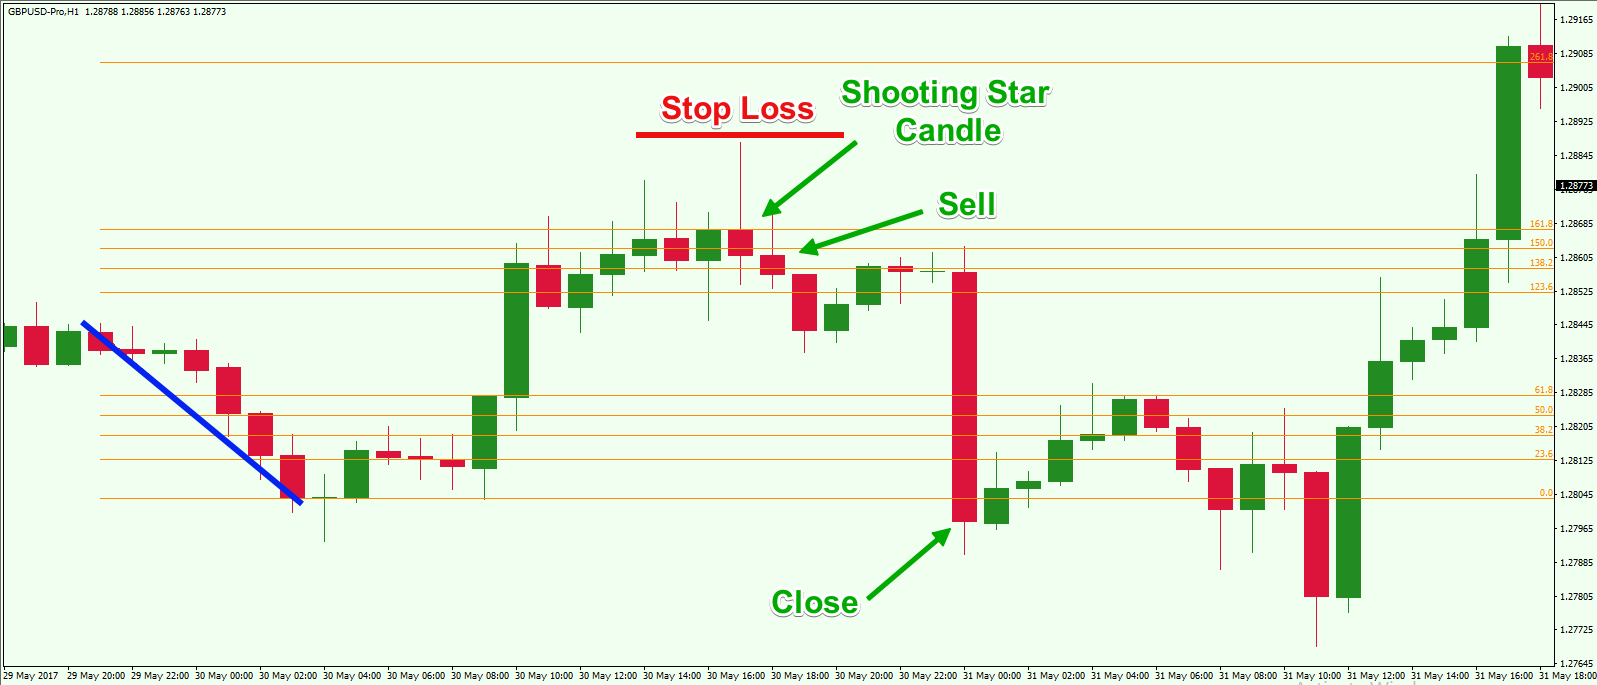
Above you see the hourly chart of the GBP/USD currency pair for May 29 – 31, 2017. The image suggests a trade that could have been taken as a result of analysis done using the Fibonacci Extensions tool.
So, the blue line represents the bearish swing that we take as a base. The orange levels are the Fibonacci levels – standard and extension levels.
Notice that at the end of the swing marked in blue, there is a Doji candle that foretold the possible price stall and reversal on the chart. The price reversed, and the GBP/USD started increasing until the 161.8% Fibonacci extension was reached. After the price had reached this level, it started to hesitate and lose steam to the upside.
Suddenly, the price action created a Shooting Star candle pattern and bounced off the 161.8% Fibonacci level. This is a nice short signal on the chart since the price obviously cannot seem to break the 161.8% Fibo extension and has signaled a price rejection in the form of a Shooting Star formation.
You should place a Stop Loss order above your entry point to protect your trade from an unpleasant outcome. Since the next level is located at 261.8%, which is relatively far, we will need to use another level for our Stop. In this instance, the top of the Shooting Star candle is a good place for your Stop.
Notice that after the creation of the Shooting Star candle at the 161.8% Fibo extension, the price bounced in the downward direction and started a bearish run. The 0.00% level is a good target for the trade.
Now let’s approach another trading example:
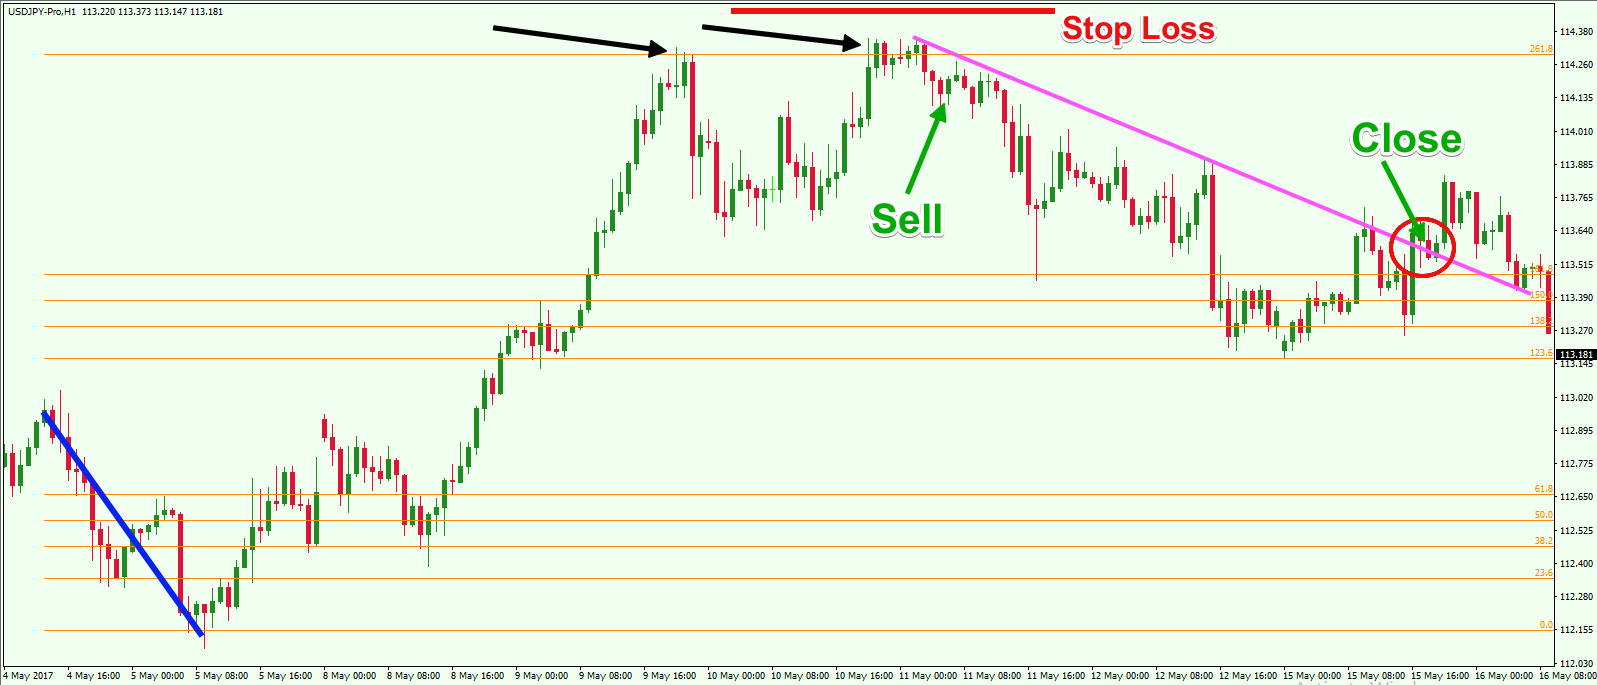
Above you see the H1 chart of the USD/JPY for May 4 – 16, 2017. The image shows another example of the Fibonacci Extension levels. The blue line indicates the swing points we take as a base. The orange levels are the standard and extension Fibonacci levels.
Take note that after the marked blue base line, the price starts a sharp increase which reaches the 261.8% extension area. Notice that the price creates a couple of tops there (black arrows), which shows that the price is clearly finding resistance at this level. After the second interaction with the 261.8% level, the price creates another bounce and a tradeable opportunity.
We have a nice short opportunity off the bounce, which is the suggested entry point. Then, the price starts a consistent bearish trend, which we have marked with the magenta trend line on the chart.
Your Stop Loss order could go above the bounce at a relative distance as shown on the image.
Since we have a nice bearish trend line on the chart, we can use it to determine our exit point. Notice that the price creates a relatively big correction after meeting the 123.6 extension level. Then, the price increases and breaks the magenta trend line. This would be a nice exit point for the trade.
Conclusion
- Fibonacci Extensions are sometimes referred to as Fib Expansions or Fib Projections though technically these are a bit different.
- Fibonacci Extensions are external projections greater than 100% and can help locate support and resistance levels.
- The most important Fibonacci Extension levels are 123.6%; 138.2%, 150.0%, 161.8%, and 261.8%.
- A quick way to remember the Fibonacci Extension levels is by taking the major Fibonacci levels (23.6%, 38.2%, 50.0%, and 61.8%) and adding 100 to them. In the case of 261.8%, you are adding 200 to 61.8%.
- The Fibonacci Extensions tool is present in the default version of MetaTrader 4 and many other trading platforms including Ninjatrader, Tradestation, and Multi Charts.
- You will need a trend or two swing points to draw the Fib Projections. You take the trend’s low and high by stretching the regular Fibonacci Retracement indicator. All the levels will get plotted on the chart automatically.
- You can open trades when the price bounces off an extension level or when it breaks it.
- You can place your Stops at the next Fibonacci Extension level, but you should always be flexible because a Fibo level could also be very far away. In this case, you should use price action techniques for stop placement.
- Flexibility is necessary also when determining your target. Since you never know how far the price run will continue, you should always combine price action techniques with the targeted Fib levels when choosing your exit point.