There are essentially three major categories in terms of anticipated time horizon for a trade. Day Trading, as the name suggests is based on intraday price action and usually positions are entered and closed during the same trading session or day. A swing trader will look to hold a position from as short as a few days to as long as a few weeks.
Position traders, are more long term oriented and typically look to hold their positions from as short as a few weeks to as long as a few months or even a year. In this article, we will focus on some best practices around a position trading approach in the market.
What is Position Trading?
Position trading is a speculative or investing style where a trader is most interested in longer term price moves in the market. Position traders typically take only a handful of major positions over the course of a year, however, they can and do trade around those positions in an active way from time to time. A position trader seeks opportunities that can last from a few months to a year or longer.
Since these types of trades last for a longer period of time, the position trading strategy requires an in-depth knowledge of fundamental factors that can influence prices over the long term, as well as knowledge of technical timing models to be able to get in and out of positions at the most opportune times within the longer market cycle.
So, most successful position traders are well versed in macro-economic data and typically look to initiate a trade based on their fundamental outlook, and then use technical studies to help time their trades.
The Position Trader
A position trader is evaluating multi-month or multi-year trends that are currently present or are emerging. Unlike more active day and swing traders, most position traders would like nothing more than to sit tight and ride a major market trend for as long as possible. Generally speaking, many Hedge funds and professional CTAs ( Commodity Trading Advisors) tend to be position traders, while most novice retail traders tend to gravitate towards the shorter-term day trading time horizon.
Key support and resistance levels on the daily and weekly charts hold a lot of value. This is because the well-capitalized bigger picture players mentioned earlier tend to concentrate their analysis on these higher time frame charts. As a result, there is increased order flow activity around important daily and weekly S/R zones.
Technical Tools for Forex Position Trading
Technical analysis can be an important component for successfully timing a longer-term position trade. Price action analysis tends to be more reliable on longer term charts which is an added plus for a Position trader. Let’s now discuss a few valuable indicators and tools that can help you spot long term position trading opportunities.
Trend Line Indicator
A simple but highly effective trading tool that can assist in trading around a core position is the trend line. As we have noted earlier, price action and trends tend to be clearer on longer time frame charts such as the daily the weekly. As such, applying a trend line study can provide us with valuable insight into the market and offer us a directional bias based on prevailing price action.
Support and Resistance
Horizontal Support and resistance levels are also highly relevant for position trading. When the price action breaks a major support or resistance on the chart, this is likely to cause an advance to the next higher resistance level in case of an upside break or a decline to the next lower support level in case of a downside break.
On the contrary, if the price action fails to break a key level and instead bounces in the opposite direction, we can then consider this as a possible price rejection and position ourselves for a corrective move or new trend in the opposite direction.
Moving Average Indicators
Another technical tool that can assist the position trader is the Moving Average indicator. The moving average type could be a simple, exponential, volume weighted, displaced, etc. That really doesn’t matter too much in the overall scheme of things. What can matter, however, is the number of periods of the longer term moving average that you utilize.
Longer term price action tends to react regularly to the 50 and 200 period moving averages. But you should also keep an eye on the 100 period and even the 500-period moving average for additional clues.
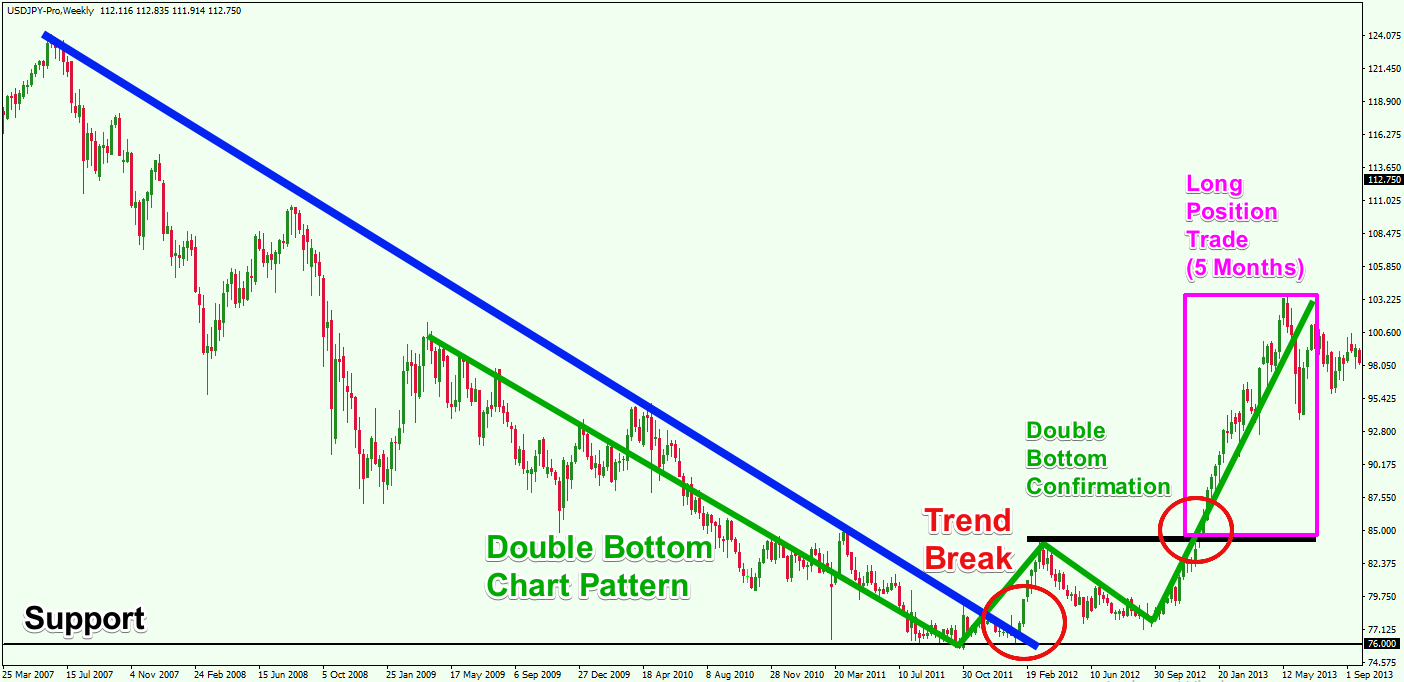
Above you see an example of a position trade on the weekly USD/JPY chart. After the pair breaks a major bearish trend, a Double Bottom chart pattern is created and confirmed, creating a solid long opportunity on the chart. After the breakout, the USD/JPY traded in the bullish direction for the next five months, making gains of approximately of 20%.
Some traders may feel that a 20% move over a five-month period is not a substantial move or highly profitable. Well if you feel that way, you may not be considering that we are looking at a 20% move on an unleveraged position. If you were to capture even two-thirds of such a move, that would equate to about 70% on 5:1 leverage utilization, or 140% on 10:1 leverage utilization.
And what’s more, your transactional costs in the form of bid ask spreads and commission would be negligible as a percentage of that profit. Compare that to day traders, who knowingly or unknowingly, give up almost half or more of their gross profits in the form of transactional costs.
Macroeconomic Factors for Long Term Position Trading
As we have alluded to earlier, the most powerful position trading strategies combine both a fundamental outlook with technical market timing. A position trader will routinely analyze macro-economic data of major countries that are represented by their respective currency pairs. Let’s now have a discussion and point out some important economic indicators that should be considered in context with long term position trading.
Inflation Rates
The inflation rate in a country or region can have an impact on its currency exchange rate. High inflation essentially means that the price for goods and services in a country are increasing. This creates less demand for goods and services from that country and can be indicative of an unhealthy economy. As a result, the currency exchange can drop in value versus other more relatively stable currencies.
Low to moderate inflation indicates that prices in a country are competitive. This can result in higher demand for the goods and services produced in this country. This creates demand for the currency, which could lead to an increase in value relative to other currencies.
Each central bank has a target inflation rate that they watch closely in order to achieve optimal economic growth and employment. For example, the Federal Open Market Committee (FOMC) within the United States has a target inflation rate of 2 percent per year. The ECB (European Central Bank) aims for an inflation rate just under 2 percent per year as its mandate over the medium term.
Interest Rates
Central banks manage interest rates in an effort to keep their domestic economy competitive and running smoothly . Since interest rates, inflation, and currency exchange rates are inter-related, monetary policy makers are tasked with trying to keep these three economic drivers in harmony with each other. This is always a balancing act.
For example, higher interest rates are likely to increase interest in foreign direct investments, which should boost the demand and value of a domestic currency. When rates are relatively high, global institutional investors seeking attractive interest rates can start pouring money into that country. However, high interest rates can result in higher inflation; as an economy begins to heat up, this can make the goods and services from that country more expensive, and thus less competitive in the global environment.
Lower interest rates tend to reduce foreign direct investments in the country, making deposits less attractive. In this relationship, investors reduce their capital exposure and investments within this country, which decreases the demand for the domestic currency. This can result in a drop in the exchange rate. Lower rates also stimulate deflation in the country, which may lead to economic stagnation or even a recession.
Trade Balance
In simple terms, the trade balance of a country expresses the difference between the monetary value of gross imports vs the monetary value of gross exports.
If a country has a negative trade balance, it means that it imports are more than it exports, which creates a trade deficit. This trade deficit is usually repaid with credit from external lenders, which can cause a depreciation in the value of the exchange rate.
If a country has a positive trade balance, this means that its exports are more than it imports. This is typically viewed as a healthy situation for the overall state of a particular economy.
Economic and Political Stability
The economic performance of a country is an important factor when deciding whether to invest in its currency over a prolonged period. If an economy is not stable, this could result in political and social instability in the country. This potential risk provides an unattractive environment from a foreign investment standpoint.
On the other hand, stable economies provide attractive investing opportunities for foreign investments, which leads to a demand for the domestic currency, and a likely appreciation in value.
An example of a country that was faced with major political challenges and social uncertainties in recent times is the UK when they voted out of the European Union. The Brexit referendum divided the UK society into two sides – those that supported Brexit and those against Brexit. The political and social atmosphere was intense as there were strong views on both sides.
After the Brexit Referendum, the Pound Sterling dropped to a 31-year low versus the US Dollar:
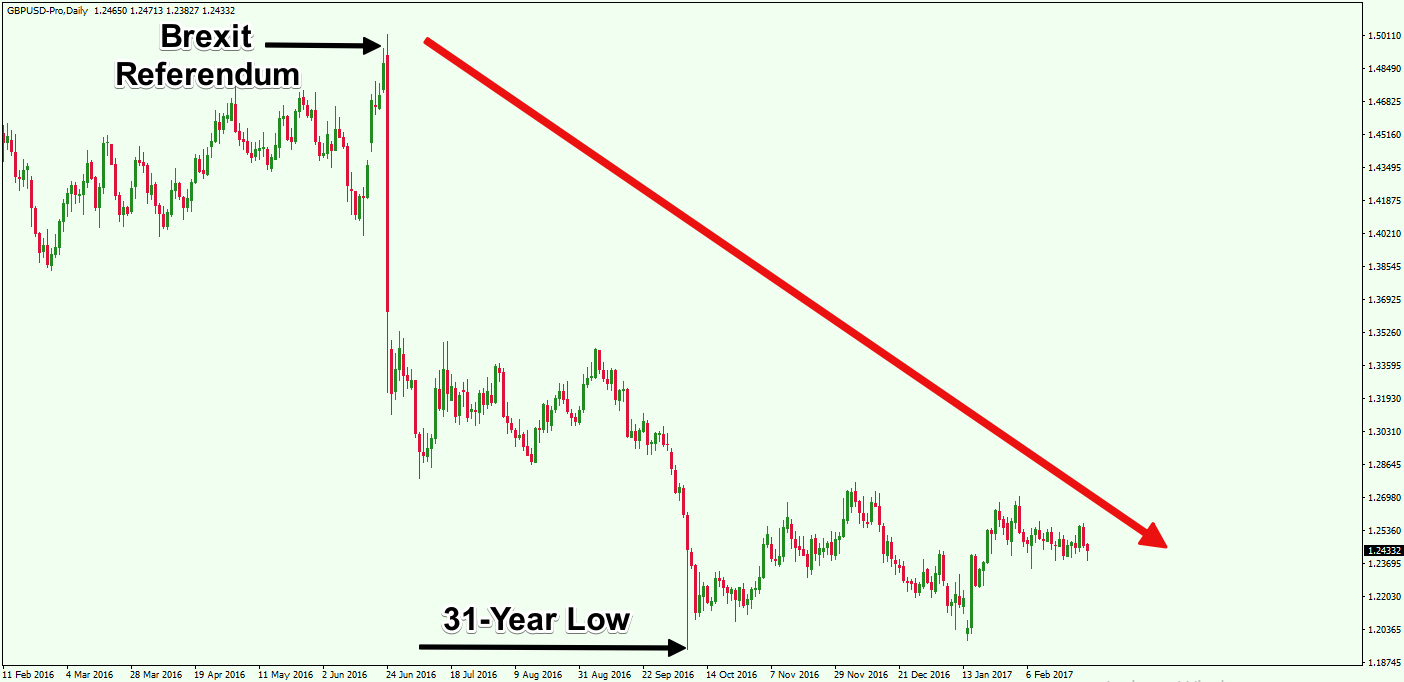
This is the Daily chart of the GBP/USD showing the Sterling price decline after the Brexit referendum. As a result of the Brexit vote out of the European Union, many investors initially lost faith in the Pound and began to look for other currencies and asset classes such as gold and commodities to invest their money.
The Pound eventually began a slow but steady rebound against the dollar to end strongly for 2017. It is important to realize that investor sentiment can change fairly quickly and it is the Position Trader’s job to gauge this and align themselves with the most probable scenario for the future.
5 Position Trading Tips
Now that you are familiar with some of the fundamental factors that can influence a long-term trading position, we will now try to provide some concrete position trading tips that will help you to make better, more informed decisions.
1) Reference Major Economic Data
Base your long-term forecast on major fundamental and macroeconomic data. Confirm your fundamental research with technical chart analysis. Monitor geo-political events to discover vulnerable political models and weakening economies that may provide for a long term tradeable opportunity.
Always try to support the economic events and your long-term fundamental outlook with a technical indication on the chart. Is there an emerging trend based on the ADX indicator or a trend line breakout?
Is there a breakout from a horizontal support/resistance level? Is there a consolidation chart pattern that may lead to a volatility expansion? These are the types of questions you need to ask yourself so that you are timing your entries efficiently. Remember, in the markets it is not enough to be right, but rather you need to be right at the right time.
2) Use Daily and Weekly Charts
As we have previously touched on, you should focus your attention on bigger time frame charts when position trading. The most appropriate charts for position trading are the Daily chart and the weekly chart. With the daily chart, you can typically visualize a period of a few months up to one year, while on the weekly chart you can typically visualize one to five years of price action.
Make sure you are using the same time horizon for your entries and exits. This may seem obvious but the trap that some traders get into is that they will take a long-term position trade based on a weekly chart setup, which should likely run for a few months, but then the trader drops down to a 240-minute chart and finds an opposing signal and exits the trade within a few days.
So essentially the trader is taking an entry at the position trading time horizon, but they are knowingly or unknowingly, exiting at the swing trading timeframe. You need to be careful to avoid falling into this all too common trap.
3) Don’t Stress Out About Normal Volatility
When you have a trend on the price chart, it is normal that some of the price interactions within the trend do not line up or touch a trend line exactly. There may be some false breaks along the way. This is quite normal.
One of the best ways to handle this is to change the current chart setting from a bar or candlestick chart to a line chart, and plot a trend line using the line chart. The reason that this works well is because a line chart is based on closing prices so many price spikes and market related noise on the chart can be greatly reduced.
4) Look for Strong Breakout Confirmations
Rather than entering into a trade immediately after a breakout, it is advisable to wait for additional price development when confirming breakouts – regardless of whether the breakout occurs from a trend line horizontal zone, or chart formation.
When the price breaks a level on the chart, you should try to be patient and let the initial price extension play out. Then you are likely to see a return and retest of that level. For example, if the price breaks a support downward, it will likely be tested as a new resistance. Then after the retest if the price breaks the swing bottom created after the initial breakout, you will have sufficient reason to short the market with a highly favorable risk to reward scenario.
5) Watch the 50, 100, and 200 Period Moving Averages
There are a few key moving averages that a position trader should keep a keen eye on. I suggest that you monitor the following 4 moving averages – the 50, 100, 200, and even the 500-period Moving Averages.
These are the most widely followed and psychologically impactful moving averages that big institutions tend to monitor. Also keep in mind that there are multiple variations of moving averages in terms of its calculation, but I have found that the Simple Moving Average version works as well as any other.
Forex Position Trading Strategy
Now let’s take a look at an example of a long term position to demonstrate the power of this trading approach.
An example of a major recent political event was the Russian intervention in Ukraine. Ever since Russia invaded and added the Crimean Peninsula to its territory, it has been suffering the sanctions of the European Union providing an unpleasant economic situation in the country.
The European Union enforced economic sanctions on Russia in July 2014, and then it reinforced the sanctions in September 2014. This had a huge impact on the Russian Ruble.
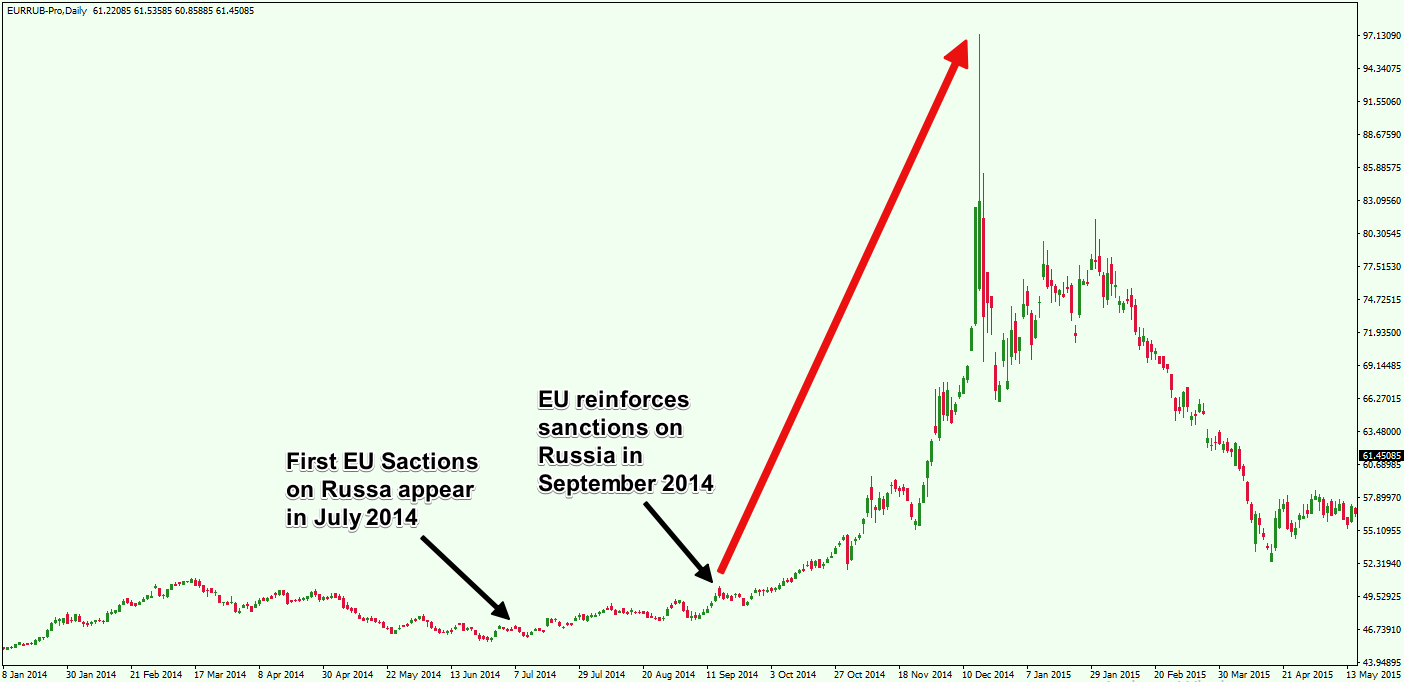
Above you see the daily chart of the EUR/RUB Forex pair showing the EU sanctions impact on the Russian Ruble. The Ruble depreciated approximately 50% versus the Euro currency.
This situation provided a very attractive opportunity for the long term forex position trader. Let’s see how you could have taken advantage of the EU sanctions on Russia:
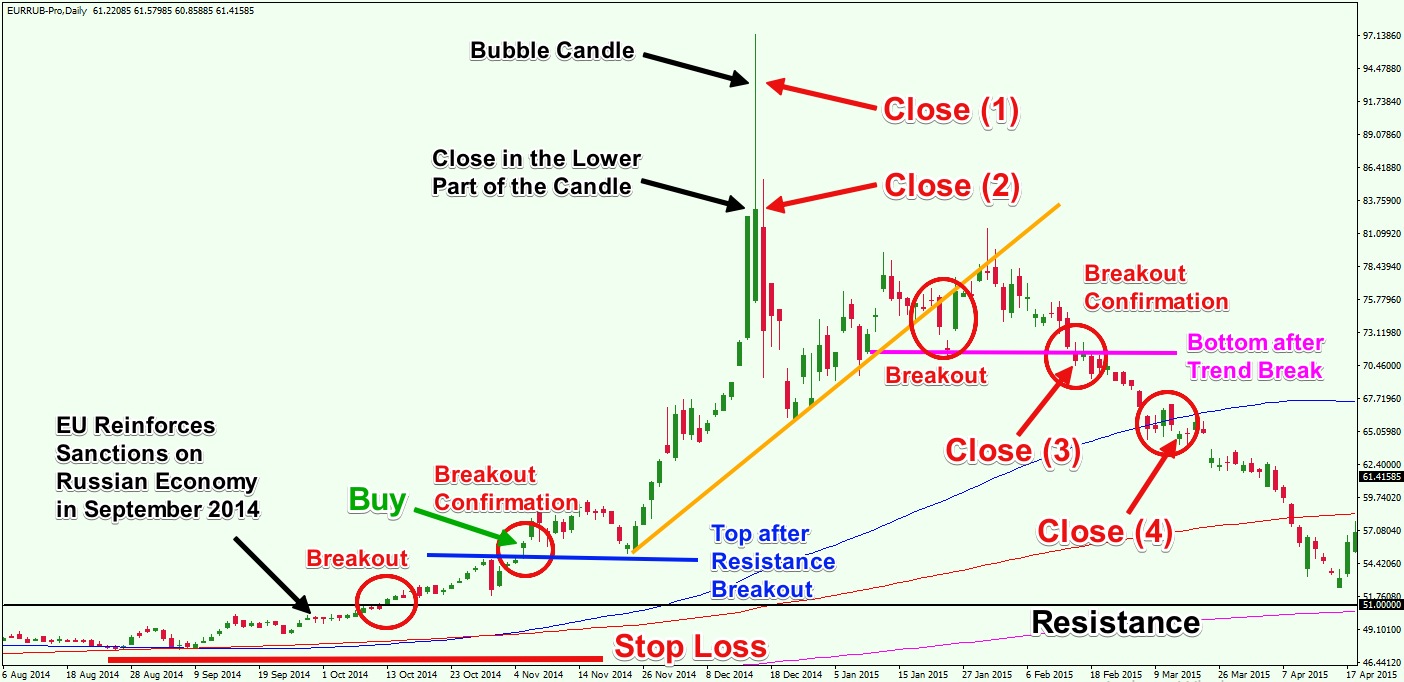
This is the zoomed in version of the previous chart. After the EU reinforces sanctions on Russia, the EUR/RUB Forex pair breaks the 51.00 resistance level that marks the last big top from the middle of March 2014 – when Russia took over the Crimea Peninsula. This happens right after the price action has already crossed above the 100, 200, and 500 Simple Moving Averages.
After the 51.00 resistance breakout, the EUR/RUB set a top in the 55.00 area (blue horizontal line). The price then returned to the already broken 51.00 area for a support test. After a bounce, the blue horizontal line gets broken upward, creating a confirmation for the previous bullish breakout through the 51.00 resistance.
Before moving further, let’s understand what the thought process is. After a bearish fundamental event for the Ruble (the EU sanctions reinforcement), you are now getting a bullish technical signal for the EUR/RUB, which confirms the bullish long term position trade. Our negative fundamental outlook for the Ruble, was reinforced with a technically timed trading signal.
Therefore, you can use this opportunity to buy the EUR/RUB Forex pair at 56.00 Rubles for one Euro, on the assumption that the Ruble will depreciate further. Your stop loss order should go below an important swing bottom on the chart as shown on the image.
Now let’s fast forward a couple of months. The price action touches the area around 97.00 Rubles for one Euro, which is 40.00 Rubles more than your entry price. Notice that at the top of the price increase, there is a candle that demonstrates a bubble price behavior due to extremely high volatility. Then we see that the respective candle closes relatively low, creating a huge upper candlewick. Now, this is an indication that the bullish move may be ending.
You should use this extremely high volatility blow off candle to exit a portion of your trade or close it out entirely at this point.
You may not consider this as a smart move from a fundamental stance, since the political and the economic situation in Russia had not shown any signs that the situation would improve in any significant way.
Based on your fundamental assessment, if you do not believe that this is the end of the price increase, you can wait for a valid breakout through the orange bullish trend. As you see, the price action creates a bearish break through the orange trend, setting a bottom near 71.00. You can use the price break at the bottom at 71.00 to exit your trade.
The later closing opportunity on the chart comes when the price action breaks the blue 100-period SMA in the bearish direction. There was plenty of evidence to lighten up your position or completely close your trade prior to this, but with this technical event, you would certainly want to flatten your remaining positions.