There is a wide array of chart patterns within the study of technical analysis. Some of these are continuation patterns, and others reversal patterns. Each individual chart pattern has a certain potential that is often achieved. But in some cases, a chart pattern can fail and we will end up with a losing trade. Fortunately, for the astute trader this can sometimes provide for an alternative trading scenario. Today we will learn how to trade and profit from chart pattern failures.
What are Chart Pattern Failures?
A chart pattern failure occurs when a specific chart pattern does not materialize as anticipated and is unable to achieve its potential. As a result, the price action moves in the opposite direction than expected. Many times, this causes an influx of stop loss orders to be triggered and can provide for a unique trading opportunity.
Let’s take a look at an example of a chart pattern failure:
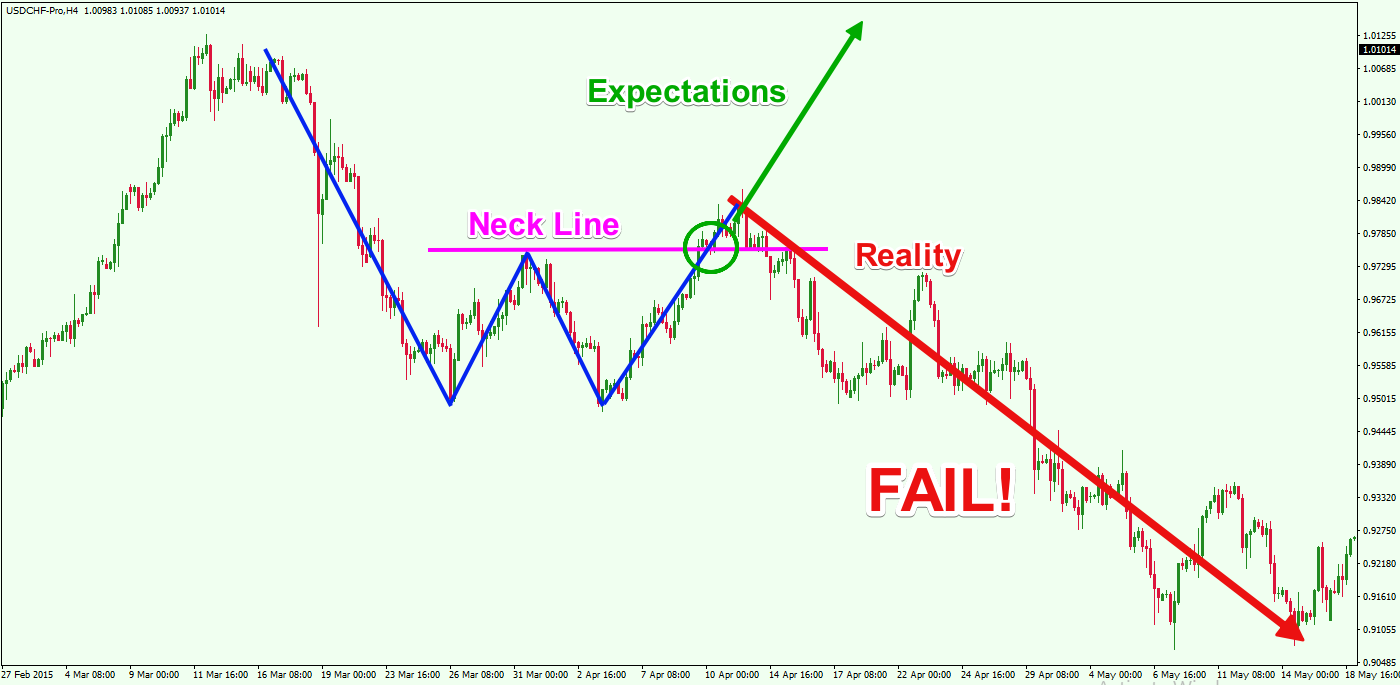
The image above shows a Double Bottom chart pattern, which is marked with the blue lines on the chart. The magenta line is the Neck Line of the pattern, which plays the role of a confirmation signal. In the green circle you see that the price action breaks the neck like, confirming the bullish potential of the pattern. However, the price action returns and initiates a strong bearish move. The Double Bottom setup failed, which has now caught many traders on the wrong side of the market.
Failure Patterns and Trapped Traders
Being able to understand why failure patterns occur on the chart is essential for your success when trading a technical analysis pattern failure. Therefore, in this section, we will discuss the reason for the occurrence of failure patterns in Forex.
The truth is that failed patterns are usually part of something bigger. In many cases, you will see that your failure pattern is evolving into another pattern, either on your trading timeframe or a higher degree timeframe. Let’s take for example of the Double Bottom pattern from the image above. If you take a closer look, you will notice that the failed Double Bottom eventually turned into an Expanding Triangle.
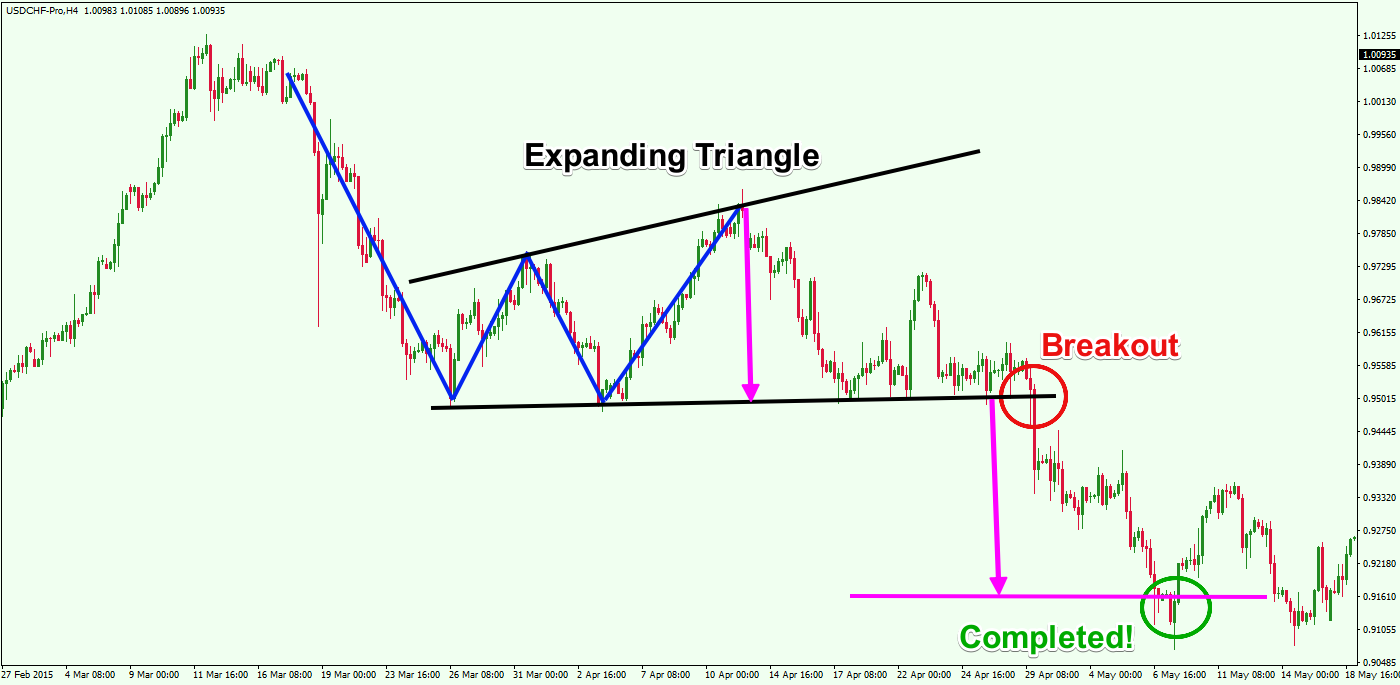
On the chart image above, we have outlined the upper and the lower level of the Expanding Triangle, which appears to be the real pattern on the chart. Although the Double Bottom pattern (blue) gets confirmed, the price action returns and creates another bottom on the lower level of the Expanding Triangle. This provides us valuable information that the black horizontal support is of great importance in accessing future price development. Therefore, when the price action breaks the lower level of the black Expanding Triangle you have sufficient reason to believe that the downward move from the newly established pattern is likely. As you can see, the triangle reaches its full potential after the breakout.
Types of Failure Patterns in Forex
There are two basic types of failed chart patterns in Forex. They can be classified based on how far the price action has gone into the creation of the pattern. There are chart patterns, which are already confirmed, but still fail, and there are patterns, which have formed, but have not yet been confirmed.
Non-Confirmed Patterns that Fail
These patterns are forming or formed on the chart, but actual breakout through the trigger line of the chart figure has not yet taken place. Further price action then proves that the anticipated pattern is false and the price proceeds in the opposite direction than expected.
Already Confirmed Patterns that Fail
These chart patterns, have already been confirmed by their trigger line, creating the confirmation. This means that the trader has a very strong reason to pursue the potential of the chart formation. However, the pattern fails and leaves many traders on the wrong side of the market.
How to Trade Failed Chart Setups
In many cases before you trade a failed chart setup, you will probably have experienced a loss caused by the initial false breakout. This is totally normal, and you should not worry about that as long as you follow a strict risk management strategy. When you realize that the pattern is a fakeout or false breakout, you can prepare to trade in the opposite direction to catch the real price move.
Next, will now discuss some basic rules you can use when trading failed chart setups.
Entering a Failed Pattern Trade
To enter a Failed Pattern trade, you should first identify the point of failure in the pattern. Typically, you will notice a weak breakout and follow thru, then a swift return to the breakout point. You should simply notice that the price action is beginning to return to the critical level of the pattern on stronger momentum compared to the momentum during the initial breakout. When this happens, then you have a good possibility of a failed chart pattern setup.
You can enter a failed pattern trade when the price action breaks and closes beyond the original breakout level, but this time in the opposite direction.
Stop Loss on a Failed Pattern
You should never leave your failed pattern trade setup unprotected. Therefore, you should always use a stop loss order when trading this type of pattern or any type of forex setup for that matter. After all, nothing is 100% certain in Forex. Even failed patterns can fail, so you must make sure to use prudent risk management measures at all times.
You should position your stop loss order at least beyond the critical level, which was used as the trigger line for the original chart pattern, before its failure.
Take Profit when Trading Failed Patterns
The use of proper price action rules is crucial when trading and managing failed patterns in Forex.
The first thing that you should do when you consider a failed pattern trade is to observe if the price action is likely to evolve into a new chart pattern. If this happens, then you should simply follow the take profit rules of the newly created pattern to exit your trade.
However, if the price action doesn’t create a new chart pattern, you should then rely on your price action knowledge to carefully manage the exit. This could be in the form of channel breakouts, ascending/descending price moves, other chart or candle patterns, breakouts from support/resistance levels, etc. When the currency pair starts to stall, you should keep a lookout for reversal signs and continually monitor swing highs and lows for potential exit opportunities.
Failed Chart Pattern Trading Example
Now let’s demonstrate the way a failed pattern technical strategy might work.
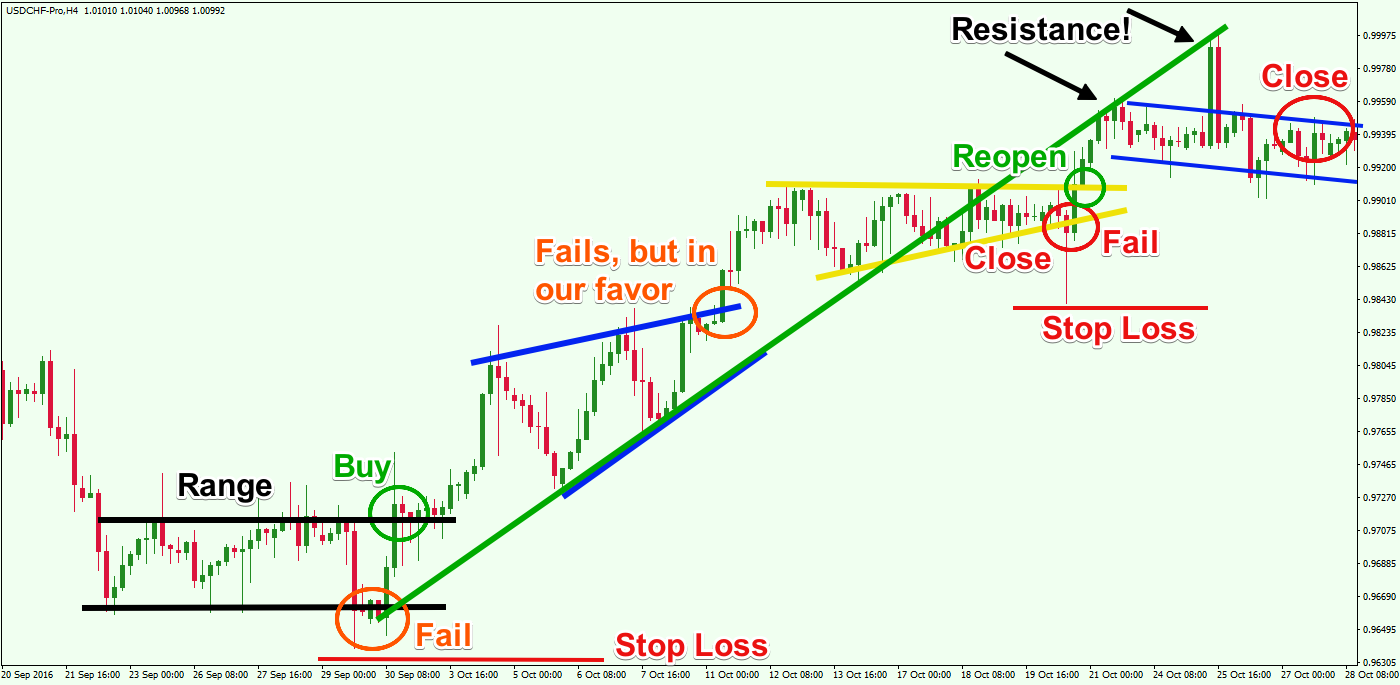
This is the H4 candlestick chart of the USD/CHF currency pair a.k.a. Swissy for Sep – Oct, 2016. The image shows how to take advantage of failed patterns in Forex and how you can achieve nice profits from this type of trading scenario.
The image begins with a range, which comes after a price decrease. The range is indicated with the black lines on the chart. Suddenly, the range breaks through the lower level, creating the impression that the price action will resume the bearish trend. However, three periods later we see that the Swissy is back into the black channel. Only a couple of periods later we see the Swissy breaking the black horizontal channel through the upper level on strong momentum. This provides a high probability entry signal that is generated after the USD/CHF fails to breakout through the lower level.
You could buy the USD/CHF as shown in the green circle, placing a stop loss order below the lowest part of the range. The proper place for your stop loss order is shown with the red horizontal line below the range. In this first example, this range trade falls into the group that attains initial confirmation but fails after all and reverses direction.
The price action then enters a bullish trend. See that on the way up the Swissy creates a Rising Wedge chart pattern. This is a chart formation, which is known to have a strong bearish potential. You will need to exit the trade if the price action breaks the wedge downwards. Furthermore, such a breakout will coincide with a trend line breakout as well, giving you an even stronger exit signal.
However, the Rising Wedge pattern fails to break the downside as anticipated. The good thing is that the pattern fails before any bearish confirmation, giving us no reason to close the trade.
This Rising Wedge falls into the group of non-confirmed patterns that fails to materialize. In this particular case, the pattern failure is in our favor because we are already in a long position.
The bullish trend resumes afterward. The price creates another big bullish impulse. Then a new corrective move appears on the chart. This correction has the shape of an Ascending Triangle (yellow) and breaks the trend line sideways.
Here, based on the current price action clues, it would be wise not to close the trade at the time of the trend line breakout, but instead hold it until the triangle breaks downwards. Unfortunately, the yellow triangle breaks downwards indeed, generating a strong exit signal.
Soon thereafter, the price action quickly reverses and moves above the triangle. So the initial downside move was a false triangle breakout. Therefore, you should reopen the trade after the upper level of the yellow triangle is broken and you should place a stop-loss order below the lowest point of the yellow triangle as shown on the image.
The price action creates another bullish impulse, which on first sight confirms the resumption of the bullish trend. However, the price action creates a couple of unsuccessful attempts to return above the green bullish trend line. And this is a strong signal that the bullish trend is probably done after all.
Also, the blue bearish channel at the end of the chart shows that the price action is descending, giving you further reason to exit the trade.
This is a very good example of how to effectively trade failed chart patterns in combination with price action. The image demonstrated three chart patterns that failed. Two of them were confirmed patterns that eventually failed. One of them was a non-confirmed pattern that failed which we used to recognize the real potential direction of the trend.
Useful Indicator for Trading Forex Failure Patterns
Although trading Forex failure patterns using pure price action analysis is very effective, I will also show you a valuable indicator to confirm a pattern failure. And this is the Volume Indicator.
There are two simple rules when trading with the Volume indicator.
- If a breakout occurs on high or increasing trading volume, then the breakout is most likely authentic.
- If a breakout occurs on low or decreasing volume, then the breakout is probably false.
These two rules are extremely helpful when distinguishing real patterns from fake patterns.
By using the Volume Indicator, you will reduce the number of cases where you become trapped inside a failed chart pattern. Furthermore, if a pattern fails, then you will be able to identify it easier and position yourself to take advantage of the actual move afterward.
Trading Failed Chart Formations with the Volume Indicator
And now we will demonstrate how exactly to combine the Volume Indicator with chart pattern failures to achieve better accuracy in our trades.

Above we have the daily chart of the EUR/USD for the period is Aug – Dec 2015. The image shows a chart pattern failure, which transitions into an opposite move. At the bottom of the chart, we have the Volume Indicator, which helps us to gauge market conditions better.
The chart begins with a price consolidation, which has the shape of a Symmetrical Triangle. As you can see, the pattern makes a clear breakout through the upper level. However, the volumes at this time are decreasing, which is shown with the red line on the Volume Indicator.
After the price breaks the triangle upwards, it creates a top and reverses. The price moves below the original breakout point of the Symmetrical Triangle. At the same time, the Volume Indicator prints a big bar, which breaks the downward sloping red line showing the progressively decreasing volume. This gives confirmation for the price drop, creating a nice opportunity to short the EUR/USD.
You could sell the EUR/USD in this case, placing a stop-loss order at the top created through the upper level of the triangle.
As you can see, the price of EUR/USD decreases afterwards. The trend is relatively sharp compared to the previous price action and it is easy to distinguish. However, the bottom formations begin to slow down and consolidate. This creates another pattern on the chart, which is marked with the yellow lines. It is a Falling Wedge formation. This pattern is known to have a strong bullish potential. Therefore, your first thought when the price action breaks the wedge upwards should be to exit your trade.
But is this wedge a real or a false chart pattern? Well let’s take a look at the Volume Indicator. Notice that volume is increasing at the time of the breakout through the upper level of the wedge. This implies that the breakout is likely real and should have a good follow thru. Therefore, based this assumption, you should use this breakout to close your trade. Notice the sharp price reversal out of the falling wedge.
The handy Volume Indicator helped guide us during three breakouts. The first breakout happened during decreasing volume, which indicated that it was probably false. The second breakout occurred on high volume, revealing that it was likely real, and the third one happened on increasing volume, confirming that it was most likely going to be a real breakout as well.
Conclusion
- A chart pattern failure occurs when a chart formation does not materialize and is unable to reach its potential.
- Chart patterns in Forex can fail, but in some cases the failure itself can provide for a viable trading setup.
- When patterns fail, you are likely to experience a loss if you were in the trade prior to the failure. However, you can then reverse and attempt to trade the pattern failure.
- In many of the cases when a chart pattern fails, it is in the process of creating another larger pattern.
- Failure patterns can be classified in two main classes:
- Patterns that are not confirmed and fail – the pattern is forming or formed, but the price action does not break the trigger line of the chart figure.
- Patterns that are confirmed and fail – the pattern is formed, and the price action breaks the trigger line of the formation creating a confirmation signal.
- To trade chart pattern failures:
- You confirm the point of the pattern failure – You can enter the market when you identify a breakout through a critical level in the opposite direction of the pattern.
- You can place a stop loss order beyond the level of the initial trigger line of the pattern. This is usually beyond the opposite part of the pattern.
- You stay in the trade as long as the price action evidence on the chart is confirming the continued price move. You should watch to see if the failed chart pattern evolves into some other pattern. This way you can attain a certain minimum target for your trade using the rules of the new emerging pattern.
- A useful tool for trading chart pattern failures is the Volume Indicator. There are two important rules when trading with the Volume:
- Breakouts on high or increasing volumes are usually real.
- Breakouts on low or decreasing volumes are usually false.