 In this article, we will be taking a look at the US Producer Price Index, also referred to as the PPI index. We will discuss how it is compiled, what it reflects and trading the PPI numbers.
The Producer Price index is an economic data release which reflects the change in the cost of products sold by various manufacturers and industries. It, therefore, is a precursor to underlying inflation and is closely watched. A fundamental trader uses PPI to gauge inflation growth of a currency, while day traders also have an interest in this index, as unexpected deviations from forecast can occur, creating the volatility needed to generate short term trading opportunities.
What does PPI measure?Producer Price Index industry data is compiled by the US Bureau of Labor Statistics. The PPI economic release is compiled and published on a monthly basis; usually during the second full week at 08:30 am, for the previous month. The Bureau releases percentage changes over time of a series of PPI indices. These price changes are related to goods and services sold at their origin; that is to say, sold by producers. Therefore, it measures price changes from the point of view of the seller rather than the buyer.
There are Producer Price Indices for just about any industry sector or commodity, in fact, the Bureau publishes nearly 10,000 indices, ranging from individual commodities to groups of products. Indices are available for mining, manufacturing, fishing, forestry, agriculture, natural gas, electricity, construction, and goods and services. However, the market focuses on three broad indices, which incorporate all the aforementioned sectors of the economy.
Calculation and weighting
The calculation involves creating an index which compares the current price with the price from the base period. The weighting is designed to improve the accuracy of the PPI, where products and commodities are weighted according to their size and importance.
The construction of the indices goes through various stages. To gauge the importance of products the Bureau primarily uses data from the economic census from the Bureau of Census, and these weights are changed every 5 years.
How the PPI index started
The PPI started out as the wholesale Price Index, from its inception in 1902 until 1978, when the name was changed to Producer Price Index. The Bureau moved from one index encompassing the whole economy to a system consisting of three main indices. The new indices accounted for various Stages of Production (SOP), and minimized the risk of double counting as the PPI dropped aggregate Commodity Price Indexes.
In February 2014, the Bureau changed the focus of the indices to Final Demand – Intermediate Demand (FD-ID). In the process, they also included prices and weights for services, construction, government purchases, and exports.
 The Bureau’s thousands of indices; which one’s count?
The Bureau publishes many indices and percentage changes that reflect percentage change month on month, year on year as well as seasonally adjusted data.
The indices published are grouped into three classification structures – Industry Classification, Commodity Classification, and Commodity-Based Final Demand – Intermediate Demand Classification.
The industry classification has around 535 indices; the commodity classification covers approximately 3,700 different single commodity indices. And the FD – ID classification publishes over 600 different indices, measuring price changes on monthly, yearly and seasonally adjusted basis.
That all sounds extremely overwhelming, however, the Forex markets primarily consider only the PPI – FD percentage change for monthly and yearly changes, and contrast those with the changes in PPI – FD indices excluding food and energy. Some traders may also contrast the changes in these two indices with changes in a third, PPI – FD excluding food, energy, and services.
The PPI that excludes food and energy and the one excluding food, energy and services, are necessary as food and energy tend to be much more volatile components of the index. This is due to the correlation of those components to commodity prices, which can have monthly swings of several percentage points. Services although a smaller component are also more volatile, and this is mainly due to services having salaries as a large component of cost.
Most traders will consider core PPI – FD as that number will more likely reflect an underlying trend since it eliminates the volatility that may be present in the food and energy components of the overall index. Revisions are also contemplated in these reports, but they are made 4 months after the month of publication.
Where to find PPI data?
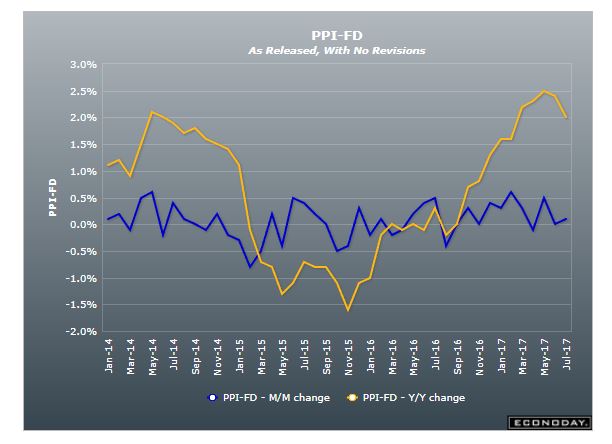
The chart above shows where the representation of for PPI – FD going back to Jan 2014 along with the monthly percentage change (blue line); it’s also a good idea to look at the yearly progression for the index. Yearly PPI data is what policy makers mention when they are talking about inflation and the economy.
The data releases can be seen on fxstreet.com, with its online economic calendar, which is updated in real-time, or on the Bloomberg economic calendar, on the Econoday website, which often have some delay. However, if you are an excel user and like to create your own charts, you can also retrieve data series directly from the Bureau of Labor Statistic’s website.
How is the PPI data collected?
Firms are selected and invited to participate in a survey. Once they accept a field economist contacts the firm to make arrangements for the delivery of information via a questionnaire. The data is collected monthly, usually by the Tuesday of the week containing the 13th day of the month. The Bureau receives roughly 25,000 reports with approximately 100,000 prices. If a firm fails to send or sends incomplete information an economist contacts the firm to obtain the necessary data. Firms continue to report until a new sample for their industry is selected, on average every 7 to 8 years.
Why should traders care about PPI?
The nature of the data gives the indices a dimension as a PPI inflation measure; these percentage changes measure the growth and decline of prices for goods and services by the manufacturers themselves. Higher prices will lead to higher inflation reports.
The PPI measures the prices of goods at the producer level just before they are passed on to the final consumer. Tracking these price levels helps traders to gauge future inflation pressures. The indices act as a precursor to inflation data, and are also used by government and the Federal Reserve to determine fiscal and monetary policy.
Consistent and prolonged increases in the PPI index will inevitably translate into higher Consumer Price Index and inflation readings. Inflationary pressure will push the Federal Reserve into reconsidering its stance on interest rates and may lead to a rate hike. In a similar manner, decreases in the PPI change should lead to lower inflation, and will create expectations of dovish actions by the Fed.
Higher producer prices also mean that these companies should be headed for an increase in earnings. This is positive for the economy, and good for stocks, as long as this trend is within a normal range.
Higher inflation will initially lead to higher interest rates, which is always good for a currency. Investors are going to show a stronger preference for holding securities in a currency with higher returns, all things being equal. Amongst the majors, increasing prospects for higher rates will lead to a stronger currency, at least initially.
Higher increases in PPI numbers usually indicate a stronger environment for sellers and a buoyant economy. Economic growth will also be a factor of currency appreciation, so even if the PPI change is inline or within the Federal Reserve’s target, it may be seen as a positive factor for the dollar as it is indicating the economy may still be in a very healthy state.
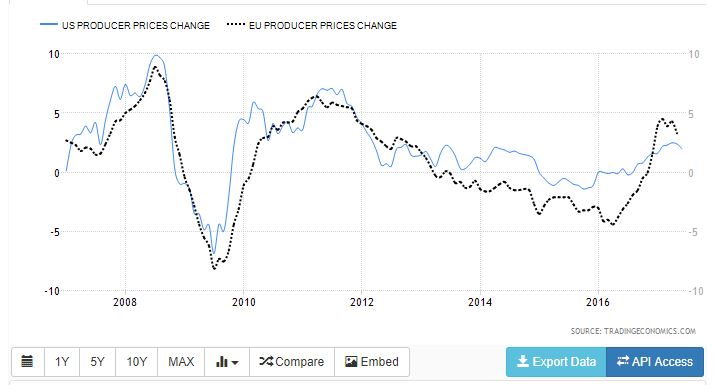
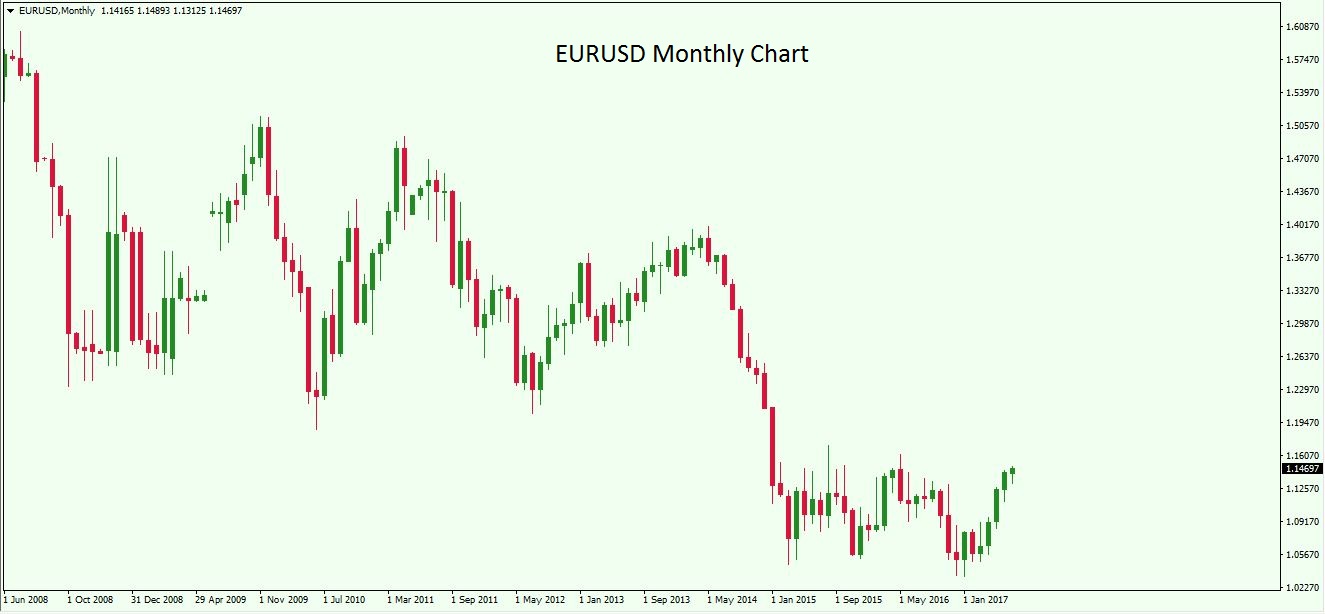
The above chart shows the progression of monthly annualized percentage change for US versus EU PPI over the past 10 years. We can see how for most periods throughout the time-period US PPI has outpaced EU PPI. The chart below shows the monthly price chart for the EURUSD major pair over the same time-period.
In the chart above, we can see that throughout the data series that US PPI was higher than EU PPI for most of the time-period, which corresponds with progressively higher prices for the US dollar (lower EURUSD exchange rate) over those same periods. Note that apart from the initial period on the chart going into late 2008, the US PPI was still higher than the EU, but the Euro appreciated against the US dollar. This was due to mechanisms in investor behavior around the housing crisis, and financial turmoil initiated in the US.
The last part of the chart above shows how EU PPI changes had been outpacing US PPI changes over several months from January 2017 to June 2017. When we look at the chart below for EURUSD price, over the same period, we see how the Euro seemed to have reverted its downward trend and trended higher.
Other factors also came into play during that period, as both the ECB and the Fed were setting up the market place to change their monetary policy stances. Talk on both sides of the aisle were creating larger expectations for the Euro, while the USD expectations were for tapering the balance sheet.
Another period that stands out in the chart is the time period from mid-2013 to the end of 2016. During this period, the US PPI outpaces the EU PPI consistently. When looking at the EURUSD price chart, for the same period, we can see how the Euro continues to fall against the US dollar throughout this whole phase.
How to trade the PPI report
As with trading any type of economic data release, it is necessary to have a good understanding of what the market place is expecting from the report in question. This can be done by reading relevant articles about the expectations for the next PPI report, as well as looking at the forecasts posted on the various websites mentioned above, such as Fxstreet, Bloomberg or Econoday.
The US PPI is a forerunner of inflation, and, therefore, its reports are important to gain a general view of the fundamental factors underlying a currency. However, it needs to be confirmed by the following CPI, and then the following Inflation report. This means that usually in the short term this data release will only create volatility in price when the number released deviates a great deal from the number expected.
Nevertheless, in general, a strong PPI increase is correlated to an increase in the price of the US dollar against those currencies, in particular, that are showing decreasing inflation. This is due to the scissor effect of interest rates heading in opposite directions. Investors never hold securities for an absolute return; they are always held relative to other investments.
An example of how much volatility the PPI Index can create is given by the unexpectedly high percentage change on September 14, 2012. The monthly PPI rose by 1.7%, overshooting economists’ forecasts by 0.5%. The rise was the highest since June 2009, and gave the US dollar, already in a Bull trend, a further boost. The EURUSD rose 1.1% or 143 pips, while the USDJPY rose 0.96% or 74 pips. September 14th also marked the day USDJPY turned the recent Bear trend into a major Bull trend. Price went from that day’s close of 77.29 to a momentary high of 103.74 in May 2013.
It is true this data is not always the most likely to create massive amounts of volatility, but it is still closely watched. And in the event of data beating expectations in a big way, it can create large increases in volatility. In some cases, as in the example above, it can also be the catalyst to major underlying trends given its capability to anticipate economic health and inflationary pressures.
Wrapping up
We have seen how the US PPI is constructed, what it measures and why it is important to traders. For fundamental traders, the Producer Price Index is a precursor to inflation and an indicator of economic health, as higher prices charged lead to a greater probability of increased incomes for companies, in the same way, lower prices are likely to lead to lower incomes. Inflation changes will lead to changes in monetary policy, so considerable changes in this index are a tell-tale sign of what to expect from the Federal Reserve, especially when the PPI data is confirmed by CPI inflation data.
The PPI release is also important for day traders looking to trade unexpected deviations in the data from prevailing forecasts. Forecasts are usually easily available through various articles published on financial news websites, such as Reuters, Bloomberg, or CNBC. Other websites, such as Fxstreet and Econoday, also usually have forecasts on their economic data release calendars.
The Bureau issues many types of PPIs, for thousands of commodities and industry sectors, from mining to agriculture, to manufacturing and services. The data that most market participants look at is the percentage change of the core PPI, which excludes food and energy, for monthly and yearly change. This index is also contrasted with the percentage change in the all-inclusive PPI, and the change in the PPI excluding food, energy, and services.
The PPI may not be an extremely volatile economic data release as published data tends to be in line with forecasts. However, the predictability of the index can breakdown at times, causing major increases in volatility. Because of the index valuing prices further up the supply chain and closer to the production stage this data can often indicate changes in inflation tendency or trend. For the fundamental indications of this index to be confirmed, PPI changes need to be backed-up with similar changes in CPI and other inflation measures, and economic activity will be confirmed when GDP numbers are released.