There is a wide array of studies within the technical analysis field, and many talented analysts and traders have contributed their work in this area. One of the brightest minds in the industry is a highly-respected market technician named Tom Demark. He has been an avid student of the market for decades and he is also the founder and the CEO of DeMark Analytics.
Over the years, DeMark has developed a number of trend analysis tools that he has shared with the larger trading community through several books that he written. This article will take a deep dive into some of the more popular works of Demark and present it to you in a practical way so that you can incorporate these ideas into your own trading routine.
Tom Demark Indicators
Demark indicators are useful in analyzing market trends. A Demark trading strategy helps a trader to evaluate the current state of the trend as well and the likely exhaustion point. Demark analysis has proved to be extremely valuable in terms of finding the terminal point of trends.
This type of end of trend accuracy can also provide an advantage for getting aboard the beginning of a new trend. As such Forex traders using Demark studies can incorporate them in both a contrarian approach and trend-following manner.
The truth of the matter is that Tom Demark indicators (TD indicators) are not that widely known among Forex traders. A large percentage of the forex community may not have ever heard of these studies. One reason for this is that there is not that much information about Demark’s work online compared to other indicators like the MACD, RSI, Stochastic, etc.
Technical Analysis Using Demark Indicators
TD indicators are used for in-depth trend analysis and can give you different signals based on the health of the current trend. Demark analysis can get quite complex depending on the indicator you are using, however we will focus on two that I believe offer the most value to the trader.
These two Demark tools are the TD Trendline ( also known as Demark Trendlines) and the TD Sequential ( also known as Demark Sequential). The application of these two studies will be the primary focus of the rest of this article.
Tom Demark Trendlines
The first Demark strategy we will go through is the Tom Demark Trendlines. I chose to start with this study because it is fairly straight-forward, but extremely powerful once you understand how to apply it. Let’s take a look at the chart below and pay close attention to the marked lines on the chart:
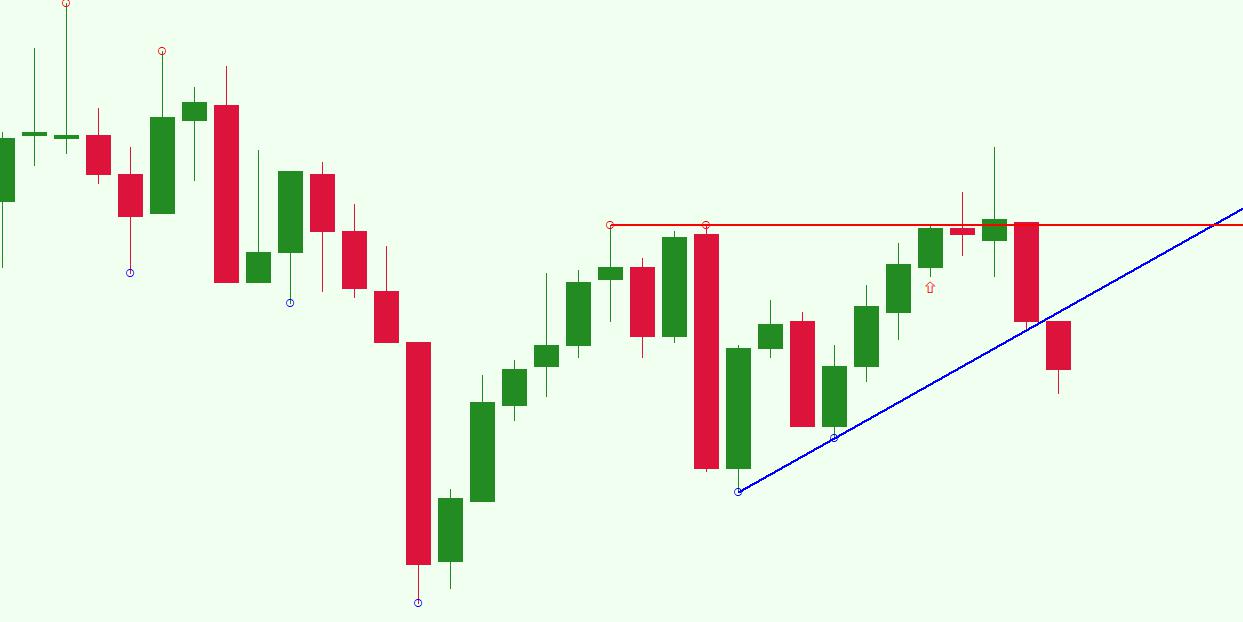
The TD trend line indicator basically consists of two lines. The upper one is bearish and goes through two of the most recent tops of the price action. The lower line is bullish, and it connects the two most recent bottoms on the chart. In this example, the price action is being squeezed within these two converging lines.
Depending on the type of TD trend line indicator that you are using, it can build and automatically draw the two lines for you dynamically. However, I am using an indicator that only marks the respective tops and bottoms with small circles. I can then use those data points to build the TD lines myself. The type that you incorporate will depend on your trading platform and personal perference.
Also, some variations of the TD trend line indicators will also plot additional lines above and below the current price action. These could be used as targets for potential trades. We will get into the details of this a bit later, but let’s first understand the actual TD line signal.
Demark Trendline Trade Signals
The signals that we get from the Demark Trend line indicator is very straight-forward. Essentially, we are looking for a price breakout through one of the two plotted lines.
A buy signal comes if the price breaks the upper line in the bullish direction. A sell signal comes if the price breaks the lower line in the bearish direction.
Demark Trendline Trading Strategy
Now let’s walk through a basic Demark trendline trading strategy that incorporates an entry point, stop loss, and target.
Entry Point
If the price breaks the upper Demark trendline, then you would open a long trade. On the contrary, if the breakout comes through the lower line, then you would open a short trade in the currency pair.
Stop Loss Order
If you are long, you can place your Stop Loss order below the lower trend line. If you are short, then the Stop can go above the upper line. If, using this method, the stop loss is at a distance that is relatively too far for your comfort level, then use an intervening swing for your stop loss placement.
Price Target
If you are using a more sophisticated Demark trendline indicator, you will likely have levels on the chart that are marked and suggested as a potential target. If you do not have this feature or prefer to manage the exit on your own, then you should watch next level support or resistance levels after the breakout for potential exit points.
Demark Trendline Trading Example
Now let’s proceed to a TD trend line trading example. Refer to the image below.
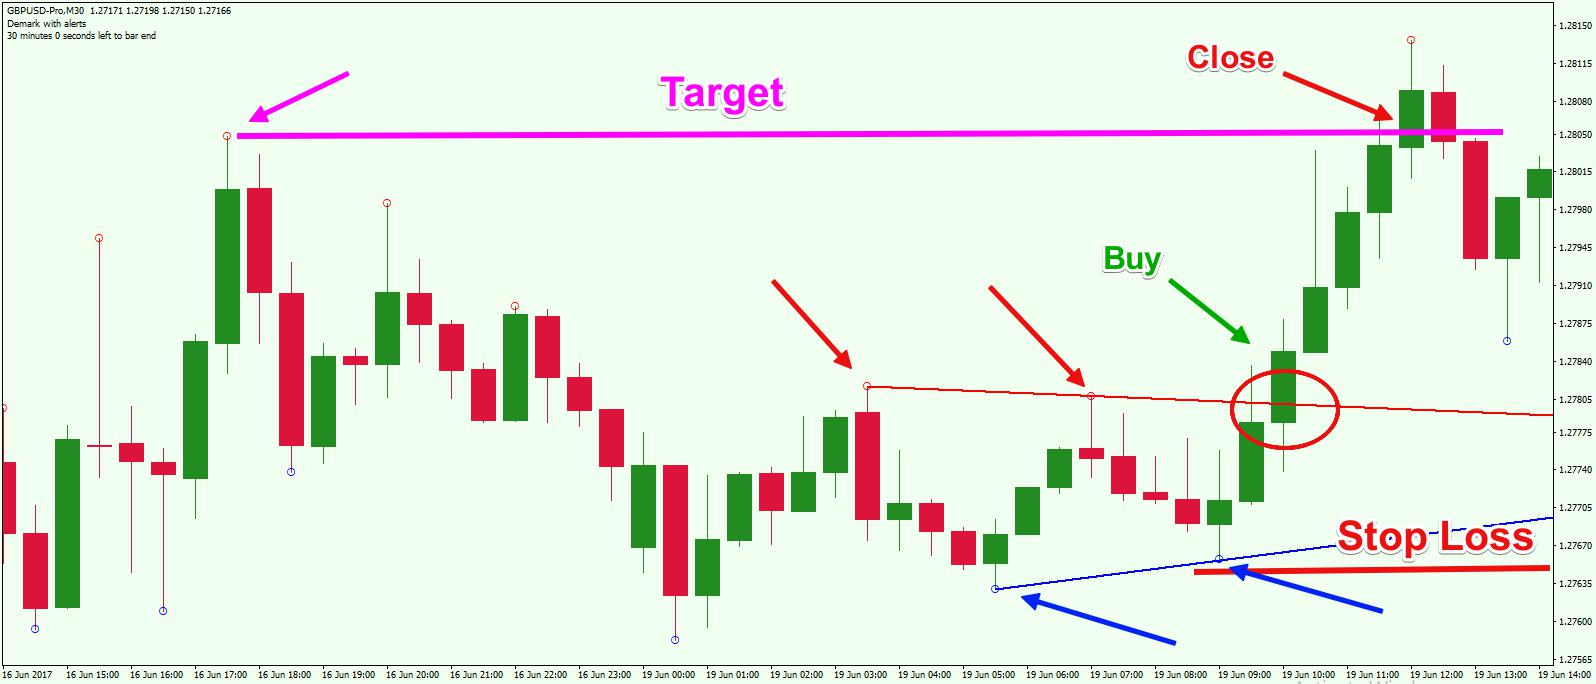
This is the 30-minute chart of the GBP/USD for June 16-19, 2017. The blue line and red line represent the Demark trendlines.
The buy signal comes when the price breaks the upper (red) line. Once that happens, we would look to execute a long trade and protect the position with a Stop Loss order. The stop loss can be placed below the lower Demark line.
The magenta line marks the most significant recent top on the chart. Notice the two Demark TL lines are compressing price action, and we expect to see a volatility expansion out of this consolidation. With the breakout to the upside, we are likely to see the most recent significant resistance level get tested, which is exactly what happens.
Tom Demark Sequential
The second Demark indicator that we will discuss is the TD Sequential indicator. This study is a bit more complicated and will require more practice to apply successfully in live market conditions. The TD Sequential indicator adds various numbers on your chart. These numbers are located above and below the Japanese candlesticks on the chart. If you take a closer look below, you will notice that most of these numbers are not random, but instead are in an ascending order starting from 1.
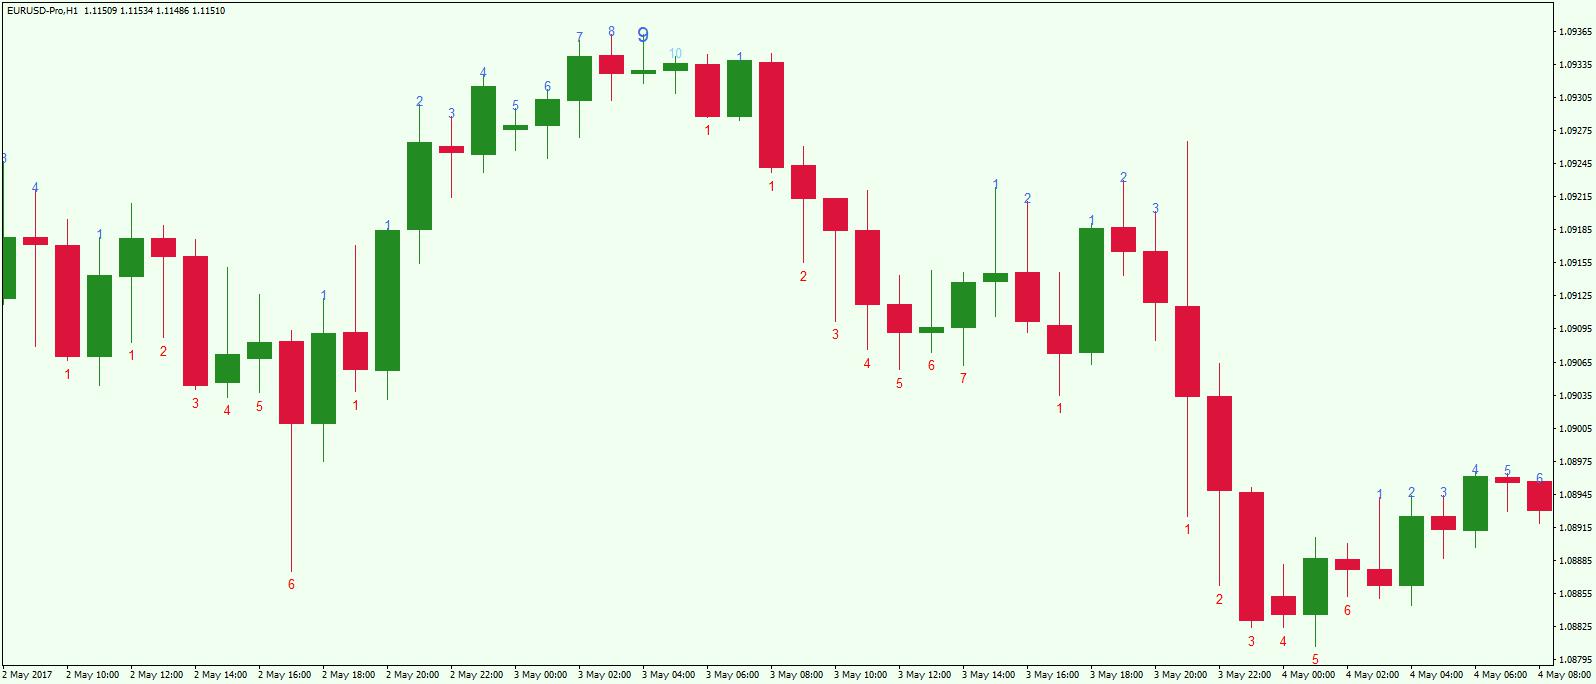
What you see above is the TD sequential indicator plotted on the price chart. Again this indicator contains only numbers marked at the upper or lower range of each candle. This may look confusing at first sight, but there is a method to this as you will soon learn.
Calculation of the TD Sequential Explained
So, as you may have guessed, the TD Sequential indicator represents a sequence related to the health of the current price trend. But how is the TD sequence built? Well, let’s have look.
An initial starting point is marked with a 1.
More specifically, for a bullish move, “1” is plotted when the price action closes a candle higher than the close of the candle four periods ago. Then on the following bar, a “2” is plotted when the price action closes a candle higher than the close of the candle four periods ago. And this rule is in force for every succeeding bar.
The “1” of a bearish price move is marked when the price action closes a candle lower than the close of the candle four periods ago. Then on the following bar, a “2” is plotted when the price action closes a candle lower than the close of the candle four periods ago. And this rule is in force for every succeeding bar.
Signals of the TD Sequential Indicator
There are two basic signals that come from trading the TD Sequential strategy. The signals forecast an exhaustion in price and a high probabity for an impending correction.
TD Sequential Bearish Signal
Let’s say we have a bullish trend. The price increases and on the way up we get the respective TD Sequential numbers: 1, 2, 3, 4, 5, 6, 7, and so on.
The bearish signal comes at the moment when the Demark Sequential indicator gives you the number “9”. This means that the price action has closed 9 consecutive candles where each has closed higher than the candle 4 periods earlier.
The signal is even stronger if the highs of candles 8 and 9 exceed the highs of candles 6 and 7.
When you confirm this pattern, this is very likely to result in a pullback in a bearish direction. The strength of the pullback is most likely to be seen during the first four candles after the confirmation of the candle that is marked with “9”.
TD Sequential Bullish Signal
The trend you are analyzing is bearish in this case. And the numbered candles will be bearish as well. In this scenario, for a bullish signal, we will need to have nine bearish candles – each of which closes lower than the candle that is located four periods earlier.
The bullish signal comes when the Demark Sequential indicator gives you the number “9”.
The signal is even stronger when the lows of the candles labeled with 8 and 9 are lower than the lows of candles 6 and 7.
Demark Sequential Trading Strategy
It is important to note that there are various detailed rules surrounding TD Sequential that Demark lays out in his book “The New Science of Technical Analysis”, but for our purposes here, we will go over the core principles and develop a trading strategy around that.
So now, I will combine what we have learned about Demark sequential and present a basic trading system based on these concepts. We will discuss the precise entry point for this system, the level of your Stop Loss order, and the price target that we should aim for.
In this specific example, we will discuss the bearish TD Sequential signal.
Entry Point
Firstly, you need to have a bullish trend in place. Then we will need to get nine consecutive periods that each close higher than the period four candles earlier. When you get the number “9”, you should short the market at the end of that period.
Stop Loss Order
You should place your Stop above the last high of the current bullish trend. However, make sure you keep it at a relative distance, so that your position will be able to handle any added volatility that occurs at the reversal point. Having said that, we are expecting a sharp pullback in a bearish direction.

The above chart a good illustration of where your Stop Loss should be in relation to the “9” signal within the bullish trend. You identify the 9th candle of the pattern, and then you short the market placing a Stop at a relative distance from your entry point. Again, it’s important to note, that If the Stop Loss order is too tight, this may result in a pre-mature stop out due to increased volatility at the turning point.
Take Profit Target
There is no strict target related to this strategy. However, one suggestion for holding a trade on a bearish signal from the TD Sequential setup is to wait for the completion of the fourth candle after the potential reversal to exit. The logic is based on the fact that the four candles following the anticipated reversal are likely to be sharp and one-sided affairs.
So, you open a trade after the close of the candle labeled “9” and you close the position on the fourth candle following the reversal.
Trading Example with the Demark Sequential
Now let me show you how this TD Sequential system works on a price chart of the EUR/USD.
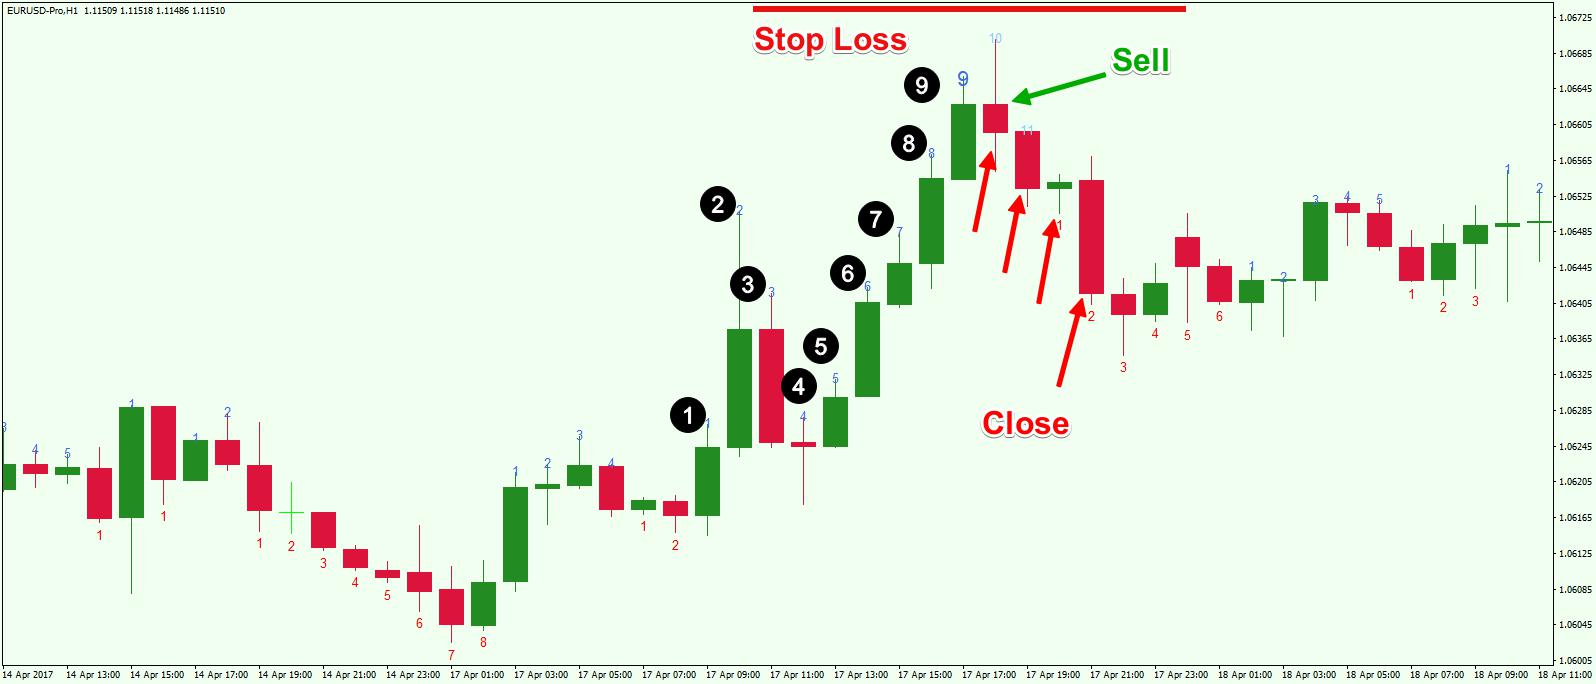
Above you see the H1 chart of the EUR/USD for April 14 – 18, 2017. The small red and blue numbers on the chart image are the same values taken from the Demark Sequential indicator. The chart has a bullish trend that will we will monitor closely for a bearish TD Sequential signal.
Notice the numerated black points on the chart. They show the 1-9 sequence of the bullish trend on the chart. The sell signal comes when the number “9” is printed on the chart. The stop should be placed at a relative distance above this high.
As you can see, the next candle is bearish. It has a relatively high upper candlewick, forming a bearish Pin bar formation, which itself, is a harbinger of an impending decline. Notice that since we placed our stop at a reasonable distance beyond the “9” high, we were able to handle the final up thrust which was met with significant selling pressure.
The four red arrows point to the four candles that follow the candle labeled “9”. You would look to close the position at the end of the fourth candle.
Demark Indicators for MT4
Demark indicators are not included within the default indicator library of the MetaTrader 4 platform. As mentioned in the beginning of this lesson, Demark indicators are not readily available, so you may need to do some research and either find a free version online or purchase the indicator set from a MT4 programmer or other reliable source.
Conclusion
- Tom Demark indicators are useful in analyzing the state and the heath of the current trend on the chart.
- Two of the best Demark studies for trading are TD trendline and the TD sequential.
- Tom Demark Trendlines:
- The upper line is bearish, and it connects two recent and higher tops.
- The lower line is bullish, and it connects two recent and lower bottoms.
- The two lines act to squeeze the price action.
- A signal comes when the price breaks one of these lines.
- The signal is taken in the direction of the breakout.
- You can target a level that marks a significant recent top or bottom.
- Tom Demark Sequential:
- Marks a series of sequential numbers above and below the candles based on 4 closes ago.
- The reversal signal comes after the 9th consecutive candle closes have each closed beyond the close of their respective candle four bars ago.
- A sharp correction is likely to occur during the first four candles.