One of the most common subsets of price action trading involves the use of candlestick patterns. Candlestick patterns offer valuable insights into the market action and can help traders position for the next price move. There are literally dozens of different candlestick patterns that traders can follow. One of the more common formations within this class of patterns is the Doji candlestick, which will be the focus of this article.
What Is The Doji Candlestick Pattern?
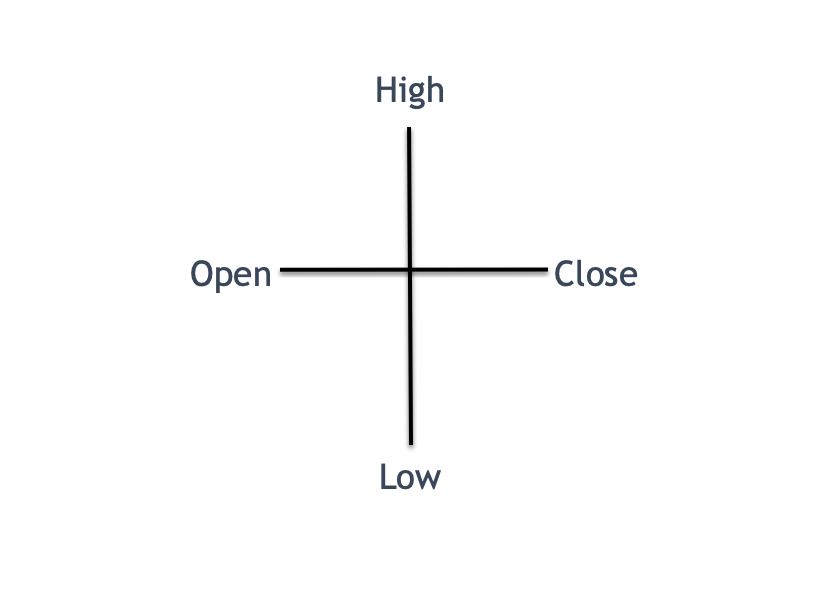
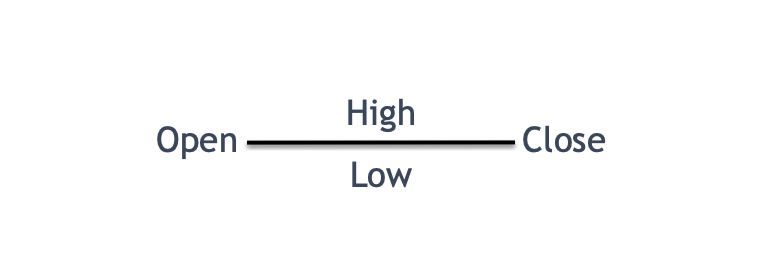
Within technical analysis, a Doji is classified as a single candlestick pattern wherein the open and close of a specified instrument for give period is essentially the same or very close to it. As a result of this the appearance of a Doji often takes the shape of a cross or some variation of it.
Because the Doji candle opens and closes in virtually the same location, that is indicative of indecision in the market. The bulls and bears are battling it out to take control of the market, however, neither was successful in their attempt to overwhelm the other and move the market in their direction. Below you can see an example of a Doji pattern.
Unlike most candlestick patterns that either have a bullish implication or bearish implication the Doji pattern is somewhat different in that the formation does not provide any clear insights into the future price movement of a security. Essentially, the Doji candlestick pattern is a neutral pattern. Sometimes they can appear as a continuation pattern suggesting further price movement in the direction of the trend, or they can appear as a reversal pattern suggesting that a trend reversal is most likely.
When the Doji formation is coupled with the underlying trend in the market or some other technical based tools, we can in fact gather quite a bit of information from that and arrive at some bias for future price movement. And so, Doji candlesticks by themselves are not of much practical use, however, when coupled with other tools it can be quite useful.
There are several variations of the Doji candlestick. The major types of Doji patterns include the Doji Star, Gravestone Doji, Long Legged Doji, Dragonfly Doji, and the Four Price Doji. We will be describing each of these Doji variations in the upcoming sections and illustrate the structure of each. Since each of these can have a different potential depending on the market context, it’s important to study them so that you can recognize and label them correctly on your price chart.
Some traders find the Doji formation to be a bit frustrating to trade, because there is no clear bullish or bearish signal provided from it as a standalone pattern. But as you will learn shortly, there is a great deal of value that this pattern can offer traders if it is evaluated and implemented correctly. This is particularly true when the market displays a Double Doji or Triple Doji formation, wherein there are subsequent Dojis appearing in the price series.
Types Of Doji Candlestick Patterns
Doji patterns can appear in all major markets including the foreign exchange market, the futures market, the equities market, and more. And they appear across all different time frames from the very smallest to the very largest. As we noted earlier the Doji pattern will have approximately the same opening and closing price. This is a very important component of a Doji pattern.
Traders need to use some common sense and judgment when defining how much differential between the opening and closing price they will accept for identifying a valid Doji pattern. This is because the exact opening and closing price for any given session is quite rare, therefore, we have to make room for some leeway in this area.
Because of the close proximity between the opening and closing price, the Doji will appear to have a very small body and resemble some variation of a cross. Let’s now introduce each of the different Doji patterns and its characteristics.
Doji Star – The Doji star pattern appears as a cross shape formation. The opening and closing prices will be virtually the same, with the upper and lower wicks within the candle appearing relatively small and equal in length. The Doji star pattern indicates indecision in the market, wherein the bulls and bears are fighting for control however the market at the current juncture is at a level of equilibrium. You can see an illustration of the Doji star pattern below.

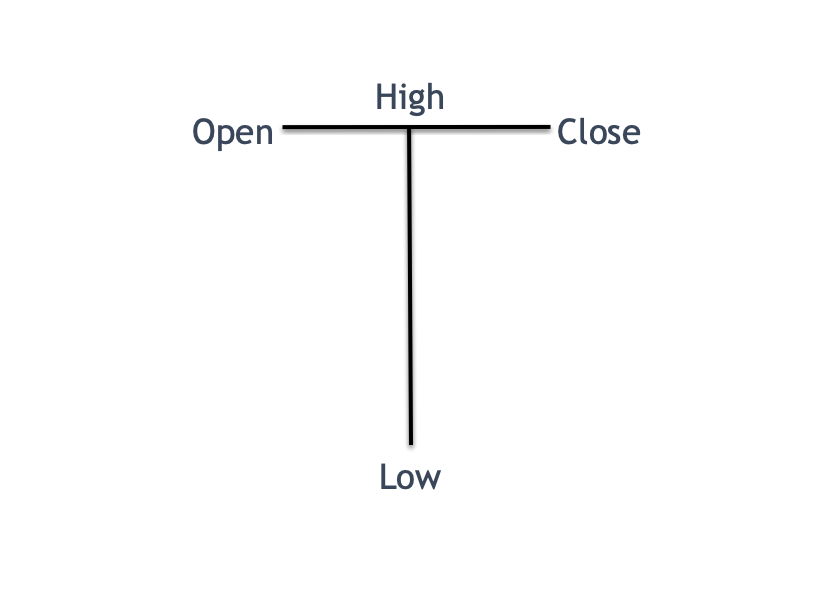
Gravestone Doji – The Gravestone Doji pattern appears as an upside down T pattern. Candlestick traders will recognize this pattern to be somewhat similar to the shooting star pattern. However, the Gravestone Doji pattern is a more powerful bearish reversal signal, as the open and close are at or near the low after prices were rejected to the upside.
This is particularly true when the Gravestone Doji pattern appears in the context of an up trending market condition. In this case, it signals a potential change of trend from bullish to bearish. Below you can see an example of the Gravestone Doji chart pattern.
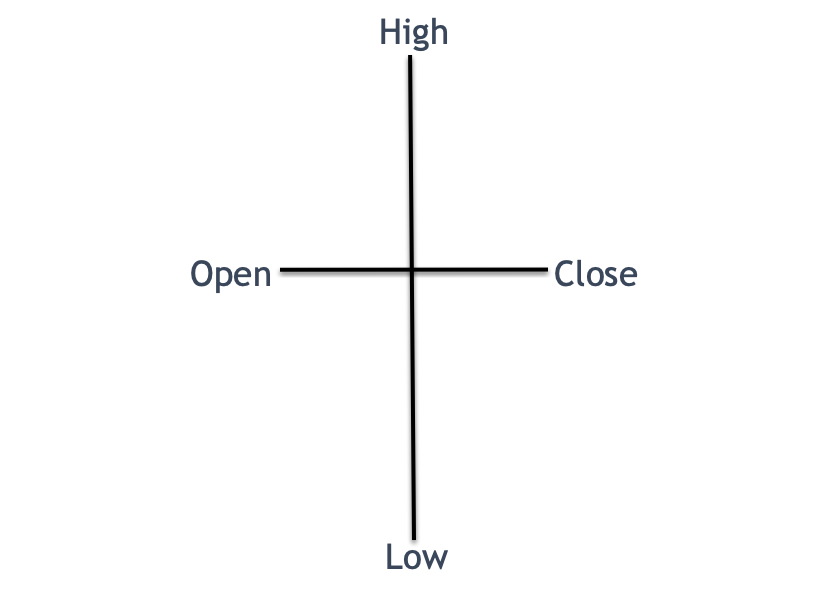
Long Legged Doji – The Long Legged Doji pattern has a similar appearance to the traditional Doji star pattern. They open and close occur at or near the same level, however, within the Long Leg Doji pattern, the wicks on either side are larger and extend out further. This suggests that the market is more volatile as prices were able to extend relatively far both to the upside and downside.
The implication is still one of indecision in the market, but wherein there is heightened volatility. This can often lead to large moves as prices break out from one side or the other.
You can refer to the image below to see an illustration of the Long Legged Doji pattern.
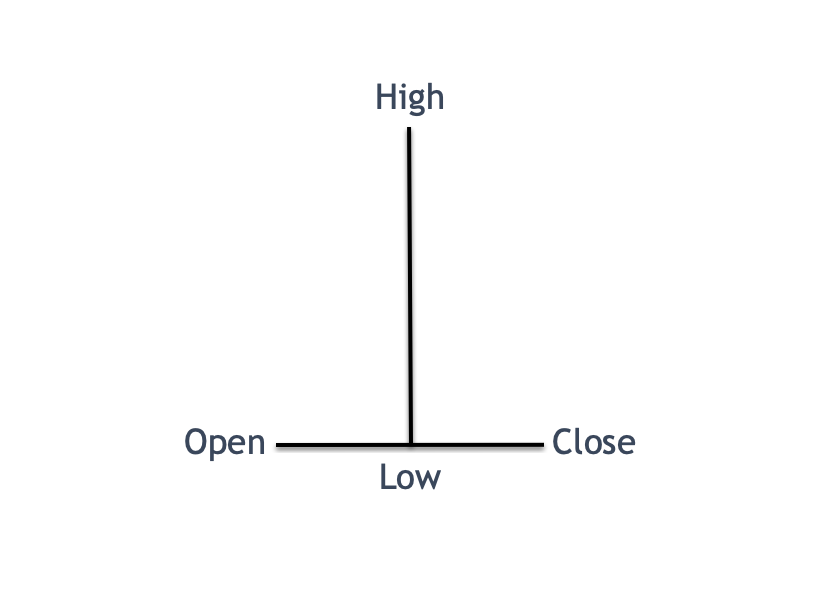
Dragonfly Doji – The Dragonfly Doji pattern is the inverse of the Gravestone Doji pattern. That is to say that it appears as a T formation. The open and close occur near the high of the candle, with a relatively long wick to the bottom, suggesting rejection of lower prices, and a strong close for the bulls. Dragonfly Dojis appear similar to a hammer candlestick; however, the Dragonfly Doji can prove to be more powerful of a signal, particularly when they Dragonfly Doji appears near the bottom of a down trending market. The expectation is for higher prices following the completion of the Dragonfly Doji pattern. An example of the Dragonfly Doji pattern is shown below.
Four Price Doji – The Four Price Doji is a unique structure in and of itself. It appears as a horizontal line with very minor or nonexistent upper and lower wicks. As such, this pattern suggests that there is indecision in the market, and the market is displaying characteristics of a low volatility environment. This is because prices open and close at or near the same area with very little movement to the upside or downside during that session.
The Four Price Doji is seen much less frequently than the other types of Doji patterns presented earlier. Regardless, traders should take heed when such a formation appears on the price chart. Here is what the Four Price Doji looks like.
Double Doji Trading Strategy
As we’ve noted earlier, the Doji pattern is one that is characteristic of indecision in the market. As such, most Doji patterns by themselves are not very telling. However, when the market you are trading forms multiple Dojis in consecutive fashion, this can be an extremely opportune time to take advantage of a breakout trade.
More specifically, remember that most Doji patterns are generally indecision patterns, and thus when we have two or three Dojis appearing one after another, then that is indicative of a prolonged period of indecision, which is likely to propel prices in the direction of the eventual breakout. This is because the markets ebb and flow through periods of low volatility to high volatility, and from periods of high volatility to low volatility.
With this backdrop, we will create a strategy for trading the Doji pattern that will take advantage of these periods in the market. Our strategy is based on a double Doji pattern, which is essentially any two consecutive Dojis appearing on the price chart. They should preferably be of a similar Doji variation; however, this is not a requirement. This double Doji system is a very simple price action based strategy that requires nothing more than the presence of two consecutive Doji patterns.
So here are the rules for trading the Double Doji set up:
- A Double Doji pattern must appear near the top of an uptrend or the bottom of a downtrend.
- Plot a support line at the low of the double Doji pattern, and a resistance line at the high of the Double Doji pattern.
- Place an OCO order, one cancels the other order, one pip above the resistance high and one pip below the support low.
- Wait for a breakout either above the resistance level which will execute the buy side of the order, or below the support level which will execute the sell side of the order. If the buy order is triggered first, then place a stop just below the low of the double Doji pattern. If they sell order is triggered first, then place a stop just above the high of the double Doji pattern.
- We will utilize a two-tiered exit strategy. That is to say that target one will be placed at a level that is equivalent to the height of the Double Doji pattern. We will close out 1/2 the position at Target 1. Target two will be placed at a level that is equivalent to twice the length of the Double Doji pattern. We will close out the second 1/2 of our position at Target 2.
Bullish Doji Candlestick Trade Setup- GBPUSD
Let’s now shift our attention to highlighting some actual examples of the Doji pattern set up on a few price charts. We’ll look at a few Double Doji patterns in the Forex market.
As we can see from the price chart below, the price of GBPUSD was trading lower, and then we see a period of consolidation before another price level lower that ultimately leads to the formation of a double doji pattern on the price chart. You can see the double doji pattern circled in green. As such, the first condition of this Doji trading strategy has been fulfilled. Specifically, a double doji pattern has formed at the bottom of the downtrend.
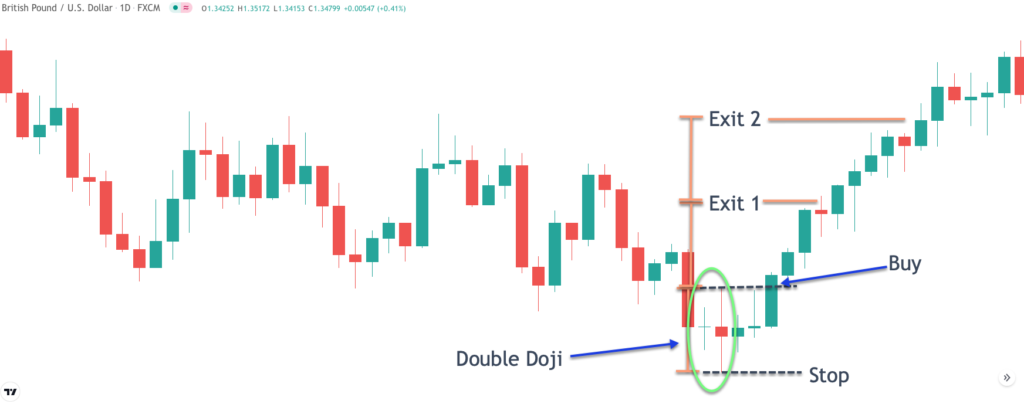
We will now draw the support and resistance lines for the double Doji pattern. Notice the second candle within this double Doji pattern put in high of the entire pattern, and also the low of the entire pattern. As such, we will plot our support line at the low of this candle, and the resistance line at the high of the candle creating our breakout levels.
Now that our breakout levels have been plotted, we will place an OCO order, one cancels the other order, with a buy stop one pip above the high and a sell stop one pip below the low of the support line. Once we’ve done this, we’ll wait to see which way the price action breaks out.
As we can see, the third bar following the formation of the double Doji pattern signaled the breakout to the upside executing the buy side of our OCO order putting us into a long position in the currency pair. And so, we will place a stop loss just below the low of the double Doji pattern as noted on the chart.
We will be using a two-tiered target as an exit strategy which calls for the first exit to be taken upon price reaching an equivalent distance of the double Doji pattern. Notice the second orange bracket which represents Exit 1. Price easily reach this level and continued to move higher. Exit 2 can be seen just above Exit 1 and represents a length of twice the double Doji pattern. Here again, price reach that level quite quickly after Exit 1 was achieved taking us out of the position entirely with a great result.
Bearish Doji Candlestick Trade Setup – USDCAD
Let’s now look at another example of this strategy in action. This time will be referring to the price chart for the US Dollar to Canadian Dollar Forex pair as seen on the daily timeframe.
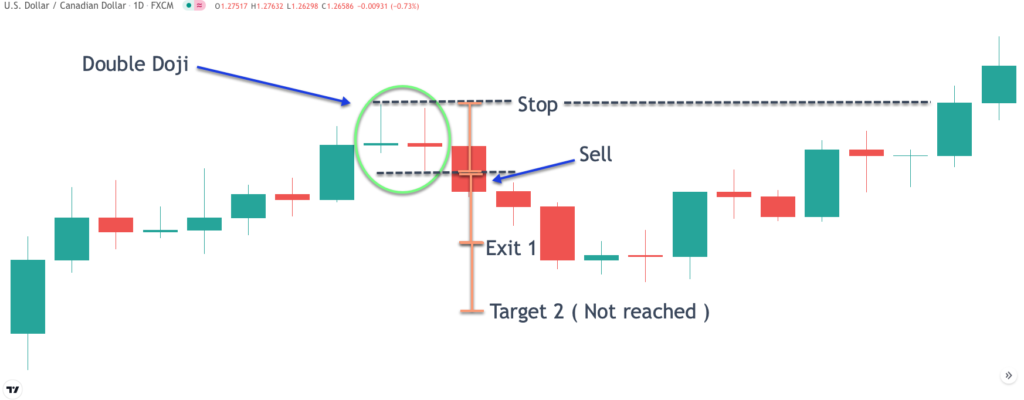
Looking at the lower left of the price chart, we can see that prices were moving higher, forming an up trending market scenario. Towards the middle of the price chart, we can see a Double Doji pattern form, which is circled in green. This Double Doji pattern was quite clear and would have clued us into a potential trade set up using the strategy. Unlike the previous example, this Double Doji pattern appears at the top of an uptrend.
With these conditions being met, we can now go ahead and plot our support and resistance lines for the Double Doji pattern. Note that within this double Doji structure, the initial Doji pattern creates the high for the entire pattern, while the second Doji pattern creates the low for the entire pattern. As such, we will use the first Doji high to plot the resistance level, and the second Doji low to plot the support level.
Now we will go ahead and place our OCO order, one cancels the other, one PIP above the high as represented by the upper black dashed line, and tone PIP below the low as represented by the lower black dashed line. Once we’ve done that we would go ahead and wait until price either breaks above the resistance level or below the support level to enter into the position.
In this case, price immediately breaks lower on the very next candle following the double Doji formation. You can see that sell entry noted on the price chart. Now that we are in this position, we will make sure to protect ourselves in case of an adverse price move by placing a stop loss order in the market. Based on our strategy rules, the stop will be placed just above the high of the double Doji formation.
Our two-tiered exit strategy calls for placing a target at a length that is equivalent to the double Doji pattern projected lower from the breakout point. This will serve as our target for Exit 1. Notice how two candles following the breakout Exit 1 was reached providing us some profits on this trade. However, soon after Exit 1 was reached prices traded slightly lower, and then began to reverse to the upside.
As a result, our target 2 was never reached on this trade. Remember target 2 is set at a level that is equivalent to twice the length of the double Doji pattern. Instead, as the price reversed and move higher, our stop loss was eventually triggered, taking us out of the position. In this trade, we wound up with a breakeven situation, because we were able to reach the reach Exit 1, however, we gave back those profits when our stop loss was hit.
Final Thoughts
Candlestick analysis is at the heart of many price action based trading strategies. There are a myriad of candlestick patterns that chart traders should be aware of. In this lesson, we’ve covered one of those important candlestick patterns – the Doji pattern. And as we learned, there are different variations of the Doji pattern as well.
Beginning traders and students of the market should take some time to practice recognizing this important pattern as it is commonly seen within the price chart. Knowing when and where the Doji pattern occurs can give traders some insights on what is occurring behind the scenes in the market.

Vic Patel is a Professional Trader with over 20+ years experience in the markets. He is the founder and head trader at Forex Training Group. In addition to offering a premium FX Signal service, he provides advanced education through his in-depth trading course “High Probability Trading Using Elliott Wave and Fibonacci Analysis”.