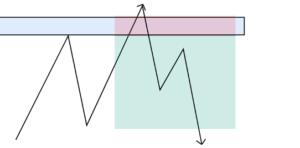
Market manipulation is an intentional distortion of price action to deceive market participants through illegal or unethical means for selfish interest. This could either be to falsely inflate or … [Read more...]
Market manipulation is an intentional distortion of price action to deceive market participants through illegal or unethical means for selfish interest. This could either be to falsely inflate or … [Read more...]
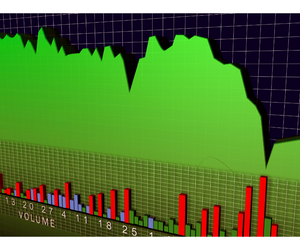
Volume figures in Forex represent how much of a currency has been traded over a particular time period. Some traders might simply look at this number and think ‘Oh, it’s a busy day!’, whilst other … [Read more...]

Blockchain technology started over a decade ago with Bitcoin’s public blockchain. This blockchain technology may also be termed the blockchain technology of the first generation. As the years rolled … [Read more...]
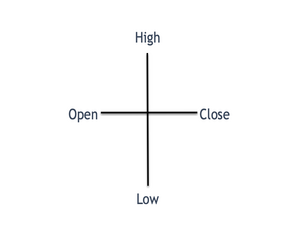
One of the most common subsets of price action trading involves the use of candlestick patterns. Candlestick patterns offer valuable insights into the market action and can help traders position for … [Read more...]
Cryptocurrencies have become increasingly popular trading instruments. Crypto investors and traders can choose among a myriad of trading styles and techniques. In this lesson, we will dive into the … [Read more...]
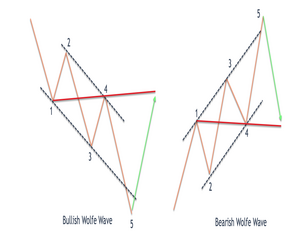
The Wolfe wave chart pattern is a powerful formation that is often seen near terminal points of a price trend. As such, it is considered a countertrend trade set up. The Wolfe wave pattern has been … [Read more...]
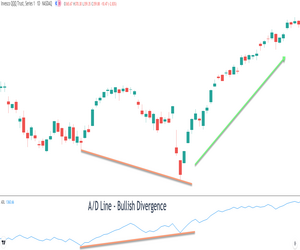
The advance decline line is a lesser known technical indicator compared to other more popular trading indicators such as the RSI, Stochastics, and MACD. While these other indicators are momentum based … [Read more...]
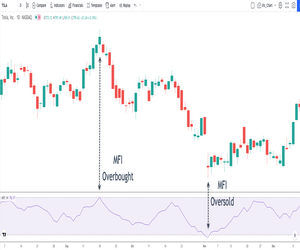
The money flow index indicator is a popular trading indicator that is quite useful in predicting market turning points. It has many similar characteristics to other momentum based oscillators but is … [Read more...]
Cryptocurrency has been one of the hottest topics in the finance world for a while now. Although the market is volatile, studies suggest that crypto investors can still make impressive profits. Many … [Read more...]
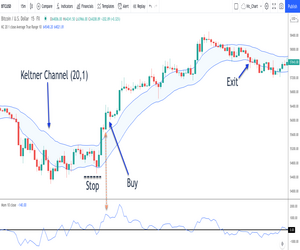
Technical based trading is extremely popular among both novice and professional traders. There are countless technical methodologies that can be implemented in the market. One such method includes the … [Read more...]