Technical based trading is extremely popular among both novice and professional traders. There are countless technical methodologies that can be implemented in the market. One such method includes the use of technical oscillators, which will be the focus of this article.
Technical Trading Oscillators
An oscillator is a technical study which traders can use to help them in determining whether a market is trading within an expected range or is trading outside of an expected range such that the market can be considered as overbought or oversold. While some oscillators help in gauging the extremes within a market, others can be used as trend identification oscillators. Trend identification oscillators provide clues as to whether a market is displaying trending characteristics or otherwise.
There are quite a few different names that traders use for oscillators including technical oscillators, trading oscillators, momentum oscillators, forex oscillators, and oscillator indicators. You should not become confused by these different terms as most of them tend to refer to the same thing. Oscillators are often combined with other technical studies such as moving averages, support resistance, and candlestick analysis. Technical oscillators can and do work quite well by themselves in certain market conditions, however, they tend to work even better when combined with some of these other technical elements.
Technical oscillators can provide a myriad of trading signals. Depending on the type of oscillator, this could include signaling an overbought or oversold market condition, a crossover signal indicating that the market is transitioning from bullish to bearish, or bearish to bullish.
Additionally, technical oscillators can be quite useful in determining the terminal points of a price trend. Specifically, they can be used to spot momentum divergences within a financial instrument. Some more advanced traders also utilize technical oscillators in conjunction with Market profile, Elliott wave, or Fibonacci analysis to determine potential inflection points.
As such there is a multitude of ways that a trader can incorporate technical oscillators into their trading methodology. Many of the more conventional methods are presented within traditional technical analysis textbooks and are known to most traders.
Although the traditional methods do work, a trader can gain a better edge by implementing their own twist or method which the majority may not be aware of or have picked up on. This can provide an additional edge that can help boost your overall trading performance. As such, it’s always wise to experiment with different oscillator trading techniques and refine as needed to stay ahead of the game.
Types Of Oscillators
There are scores of different technical oscillators available to traders. Most charting platforms these days provide free access to a multitude of different technical oscillators. However, it’s important to understand that most oscillators tend to fall into one of two buckets.
For example, there are oscillators that are centered around a focal point or line. Within these centered oscillators, the oscillator indicator line will move above and below the centered line. Centered oscillators are helpful in determining trend direction and the momentum within a trend.
For example, when the indicator line within a centered oscillator is registering a reading above the centerline, that is generally indicative of a bullish market condition. Conversely, when the indicator line within a centered oscillators registering a reading below the centerline, that is generally indicative of a bearish market condition.
Obviously, we are generalizing greatly to make a point here, however, this should provide you a 30 foot view of what centered oscillators can be used for. Two of the more popular oscillators that fall within this category include the MACD and the Momentum indicator.
On the other hand, there are oscillators known as banded oscillators. Banded oscillators move between a certain upper threshold commonly referred to as an overbought area, and a lower threshold commonly referred to as an oversold area.
Most momentum oscillators that traders use are actually banded oscillators. These include the popular Relative Strength Index, Stochastics, and Williams %R. Keep in mind that the upper and lower thresholds as defined by each banded oscillator may differ.
For example, the upper threshold indicating an overbought market within the RSI indicator would be at or above 70, while the Williams %R indicator should register a reading of 90 or above for it to indicate an overbought market environment. Within the Stochastics oscillator, it would signal and overbought market when its indicator line reaches a threshold at or above 80. So, as you can see, banded oscillators though similar in their general theme, can and do provide unique signals.
Stochastics Oscillator
The Stochastic oscillator is a banded type momentum based indicator that helps identify overbought and oversold conditions within the financial security.
The stochastic oscillator can be seen as two lines that oscillate between 0 and 100. The slower line is referred to as the Percent D line, and the faster line is referred to as the Percent K line. The default settings of the Stochastic oscillator includes a 14 period lookback, and the %D line is smoothed by three periods. Below you can see an example of the Stochastic oscillator shown below the price action.
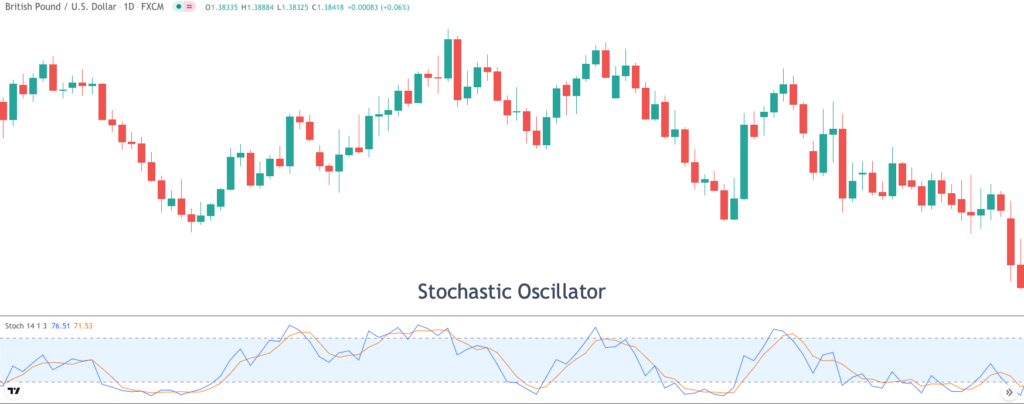
Notice on the price chart above the blue line represents the percent K line, the faster line, while the red line represents the D line, the slower line. The upper dotted horizontal line represents the 80% threshold, and the lower dotted horizontal line represents the 20% threshold. Whenever that percent D line moves into or above the 80% threshold, we can say that the market is in overbought territory. Similarly, when the percent D line moves into or below the 20% threshold, we can say that the market is in oversold territory.
Referring back to the price chart, notice how prices revert back to the mean as the percent D line moves above the 80% threshold, pushing prices lower afterwards, and when the percent D line moves below the 20% threshold, pushing prices higher afterwards. Some traders often use the crossover above the 80% threshold as a signal to go short, and a crossover below the 20% threshold as a signal to go long.
The Stochastic oscillator tends to work best in a range bound market condition where there is a clear upper and lower boundary of resistance and support respectively. Traders need to be careful of using the stochastic oscillator as a mean reversion signal, when the markets are trending strongly in one direction or another. This can often create what is known as a stochastics pop, wherein the stochastic indicator remains above the 80% threshold for extended periods of time during a bull run, or below the 20% threshold for extended periods of time during a bear run.
Momentum Oscillator
Let’s now turn our attention to the Momentum oscillator, and see what we can learn from this trading indicator. The momentum oscillator is a fairly simple technical tool that oscillates between zero and 100, and generally, has a centerline marked as zero. The zero level is considered the midpoint level, and when the indicator value is above that level, the market can be said to be bullish, while a bearish sentiment exists when the indicator value is below that level. It’s important to keep in mind that the momentum oscillator does not necessarily provide overbought and oversold levels in the conventional sense.
The formula for calculating the momentum oscillator is relatively straightforward. More specifically, the momentum indicator takes into account the current closing price of an instrument and compares it to another closing price. The other closing price can be any time period, however the default value used within this indicator is 10. And so, when looking at the momentum oscillator on the daily chart, it is comparing the current closing price to that 10 periods ago.
As noted, the most important line within the momentum oscillator is the centerline. Let’s take a look at an example of the momentum oscillator plotted on the price chart.
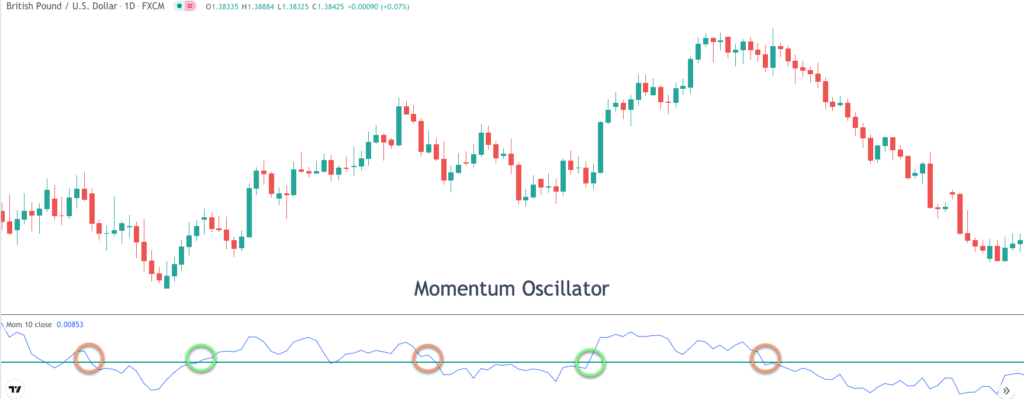
On the price chart above you can see the momentum oscillator plotted below the price action. The blue line represents the actual momentum oscillator readings at any given point in time. The green horizontal line is the midpoint line and represents the value of zero. Notice how prices began to move lower after the momentum line crosses below the center zero line.
This is because the market is transitioning from a bullish to bearish market condition and thus the trend favors the bears. Similarly, you will note how prices begin to move higher after the momentum line crosses above the centerline. When this occurs, it indicates that the momentum in the market is moving from bearish to bullish, and thus favoring a bullish stance.
MACD Oscillator
The moving average convergence divergence oscillator, also known as MACD is a widely used technical study that can be helpful in analyzing market trend and momentum. The MACD indicator is generated using two separate moving averages, and the differential between these two moving averages is what creates the actual histogram.
Essentially, the shorter-term moving average is calculated using the 12 day exponential moving average, and the longer term moving average is calculated using the 26 day exponential moving average. The resultant MACD is the difference between the 12 day EMA and the 26 day EMA. Finally, a 9 day moving average is applied to the MACD line for a further smoothing effect.
The MACD oscillator is best seen as a histogram. Moreover, when the MACD line crosses above the nine-day signal line, the histogram will appear to be green and in positive territory. Conversely, when the MACD line crosses below the nine-day signal line, the histogram will appear to be red and in negative territory. This fluctuation higher and lower will occur along the zero centerline. When the MACD histogram is above zero or in positive territory, we can consider that as a bullish sign, whereas when the MACD histogram is below zero or in negative territory, we can consider that as a bearish sign.
Aside from the simple cross up or down of the centerline, there is another, arguably better use of the MACD oscillator. More specifically, the MACD oscillator is an excellent tool for spotting divergences that occur on the price chart. A bullish divergence occurs when the price is making lower lows, while the MACD is making higher lows.
Along the same lines a bearish divergence occurs when the price is making higher highs, while the MACD is making lower highs. Essentially, a divergence signal indicates that the market is weakening in the direction of the current trend, and thus a reversal is likely to occur. Let’s look at the chart image below for an example of a bearish divergence signal on the MACD oscillator.
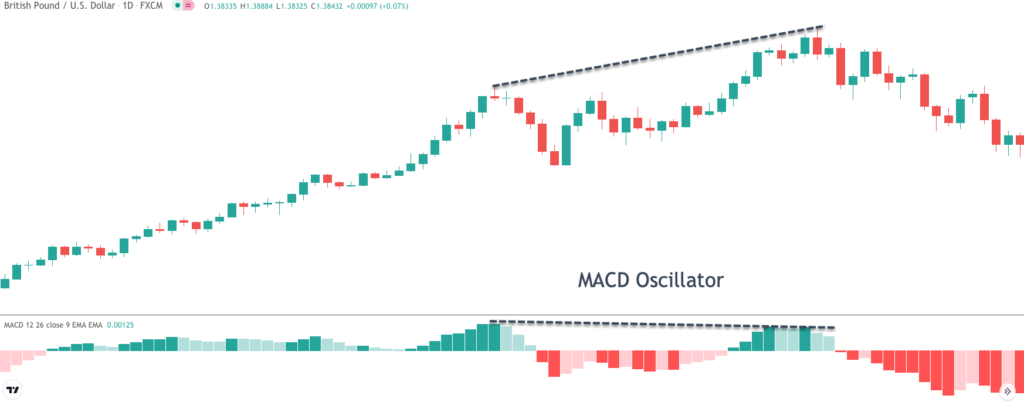
Notice on the chart above, the price is in a clear uptrend. We can see that an initial peak formed toward the center of the chart which was followed by a minor retracement, and a second top formation which was higher than the initial top. Notice now the behavior of the MACD oscillator during the same time period. We can see that the first peak in the MACD oscillator is higher than the second peak in the MACD oscillator. As such, this is a clear bearish divergence signal between the price and the MACD oscillator, indicating that we should expect lower prices to ensue.
ADX Oscillator
Identifying the trend in the market is one of the most important things that a trader must do before executing a trade. A trader needs to ask himself whether a market is trading sideways, and likely to continue consolidating, or whether a market is trading directionally, and likely to continue moving in that direction.
Trading with the trend will generally be the best course of action, as you are following the path of least resistance. Think about the concept that something set in motion will stay in motion until acted upon by another force. The same concept applies in the markets, and so, it’s imperative that you gauge the current environment.
One of the best tools for identifying a market trend is the Average Directional Index, or the ADX indicator. The ADX indicator moves along a range from 0 to 100. When prices move above the 25 level from below, that is indicative of a market moving from a non-directional state to one that favors a trending market condition.
Now it’s important to note that the ADX oscillator does not provide the direction of the trend, but rather, provides information on the trendiness of a market. In other words, we would need to use some other tool, or simply just eyeball the price chart to know whether the ADX line is signaling trend strength to the upside or to the downside.
ADX is best used when the markets have been consolidating in a low volatility environment for some period of time. Often during these lull periods, the ADX line will be below the 25 level threshold for a relatively long duration. The breakout above the 25 threshold would then provide an excellent signal for a new emerging trend. Let’s look at an example of this on a price chart.
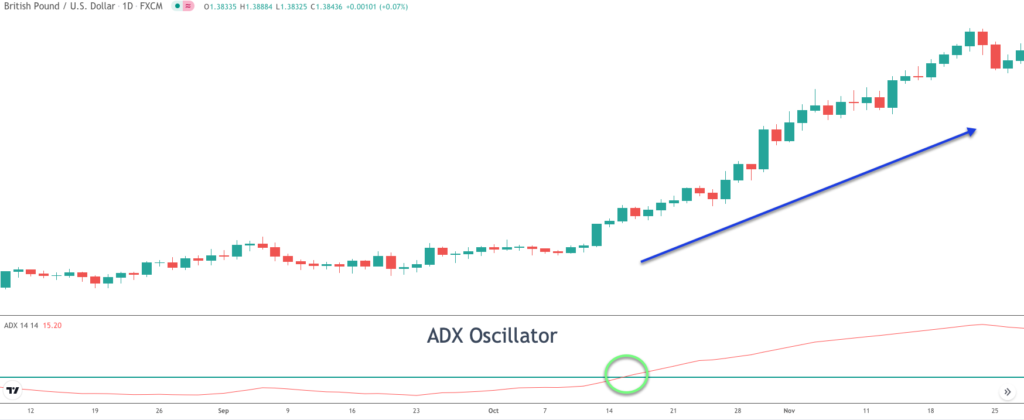
On the chart above, we can see that the ADX oscillator is plotted below the price action. The red line within the ADX oscillator is the ADX line. The green horizontal line within the oscillator study is the 25 level threshold. We can see starting at the far left of the price chart that the ADX oscillator has been registering a reading below the 25 level for quite some time, and the price action clearly shows a low volatility market environment with minimal directional price movement. But notice what happens as the ADX line creeps higher and crosses the 25 level threshold. A solid trend to the upside emerges.
Aroon Oscillator
The Aroon oscillator was developed by Tushar Chande. The Aroon oscillator is a trend based indicator that can provide clues on the strength of the current trend, and the likelihood of a continuation or reversal. The Aroon oscillator is comprised of two lines. The first is the Aroon up line, which is often shown as a green line, and the second is the Aroon down line, which is often shown as a red line.
The Aroon up line is calculated using the following formula below:
((number of periods) – (number of periods since highest high)) / (number of periods) x 100
The Aroon downline is calculated using the following formula below:
((number of periods) – (number of periods since lowest low)) / (number of periods) x 100
The number of periods input is generally defaulted to 25. Essentially what the Aroon up and down is measuring is the number of periods since the last 25 period high or low.
The best Aroon oscillator signals include those wherein the Aroon up line crosses above the Aroon downline. This is indicative of a bullish market condition and favors an upward price move. Conversely, when the Aroon downline crosses above the Aroon up line this is indicative of a bearish market condition and favors a downward price move. Let’s look at an example of the Aroon oscillator in action.
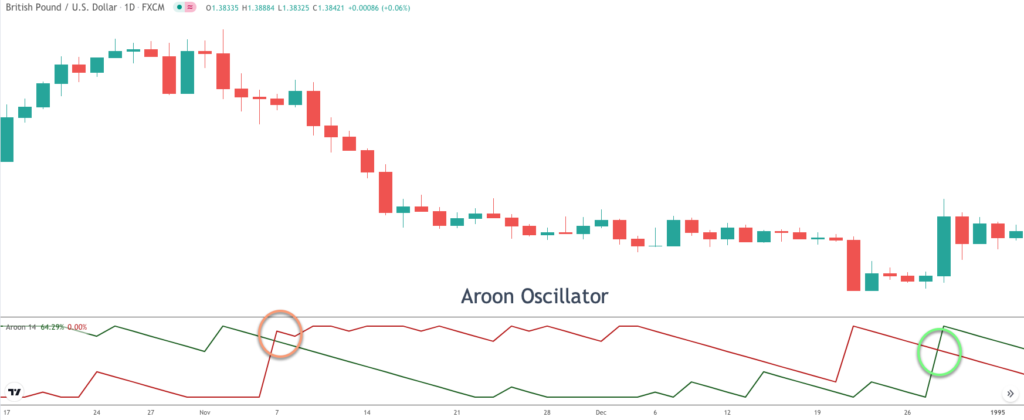
Notice on the chart above the Aroon oscillator is shown on the lower pane below the price. The Aroon up line is shown in green, while the Aroon downline is shown in red. Notice what happens when the red Aroon downline crosses above the green Aroon up line. The prices begin to move lower creating a bearish price trend afterwards.
Now let’s scroll over to the far right of the price chart. Here we can see that the green Aroon up line has now crossed above the red Aroon downline. In this case if we were short this market this opposing signal could act as our exit signal. Otherwise, we might consider a new long position using this particular buy signal.
Summary
By now you should be quite familiar with what a technical oscillator is and some of the best practices in applying it in the markets. We’ve highlighted some of the best oscillators for trading here, specifically the Stochastics, Momentum, MACD, ADX, and Aroon oscillators. It’s a good idea to experiment with each of these to get a sense for which one suits your trading style. But keep in mind, these are just the tip of the iceberg, and you should do your own research into this area and find your unique combination of tools.