Candlestick charts are becoming increasingly popular among technical based traders and investors. These charts make it very easy to evaluate the four primary levels within each candle formation. This includes the open, high, low and close. Additionally, a single candle or a combination of candles can form patterns that can help traders to better understand the underlying price dynamics. In this discussion, we will focus on four important patterns that form as a single candle structure.
Single Candlestick Patterns
Candlestick charting is a form of price charting technique that was originally developed several hundred years ago in the East, specifically in Japan. Within the Western world, traders and investors used a similar type of charting technique known as bar charts. But unlike bar charts, candlestick charts tend to be more visually appealing and easier to read.
Within the candlestick charts, each individual formation is known as a candle. And these candles can form certain patterns that provide insights into future price action. Generally, candlestick patterns can form as a single candle, a two candle structure, or a three candle structure. Our focus here will be on a few of the most important single candlestick patterns that show up in the price series.
There are three primary types of candlestick patterns depending on their implication. That is to say that candlestick patterns can be classified as continuation patterns, when the overall structure represents a continuation of the existing price movement. On the other hand, candlestick patterns that are likely to move opposite to the existing price movement can be classified as reversal patterns.
And finally, there is a class of candlestick patterns that are considered neutral patterns, meaning that the formation itself may be important but the implication of the pattern is not reasonably known until some later point.
The two varieties of the reversal type single candlestick formations that we will discuss in detail include the hammer candlestick, and the shooting star candlestick pattern. The one variety of continuation type single candlestick formation that we will look at is the Marubozu candlestick formation. And finally, there is the Doji pattern, which is essentially a neutral candlestick formation.
Although these are not all the single candlestick patterns that show up the markets, they are the most important one candle formations that every price action trader should study and be aware of.
One important thing to note when incorporating single candle patterns into a trading strategy, is that you should always use them in conjunction with some other technical based study to ensure the highest probability outcome on the trade.
For example, you can combine the various single candlestick patterns with support and resistance levels, moving average lines, and Bollinger bands, to name a few. The point being that you should be seeking confluence of one or more other technical signals in conjunction with these candlestick formations.
Hammer Candlestick Pattern
The hammer candlestick pattern is one of the most powerful formations within the entire candlestick family of patterns. It is a single candle reversal formation that typically occurs at the end of a down trending market condition. Additionally, it can also be seen quite frequently at the end of the corrective phase within a larger uptrend.
Below you can see an illustration of the Hammer candlestick pattern:
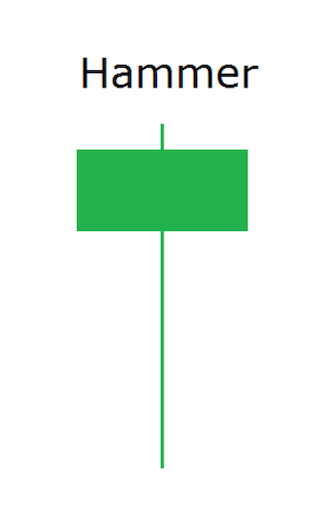
There are a few key attributes of the hammer pattern. Firstly, the hammer candle has a relatively long lower shadow and a small or nonexistent upper shadow. In addition the body of the hammer candle is also relatively small in relation to the entire candle structure. And finally, the hammer candle should close within the upper one third of the entire structure. As can be seen within this illustration above, all of these attributes are clearly present.
The hammer candlestick pattern conveys quite a bit of information as to the dynamics behind the current price action. The long lower shadow or wick within this candle suggests that sellers were attempting to move prices lower, but failed to do so, as the bulls ultimately took control of the market during the candle formation. This is evident from the close within the upper one third of the hammer structure.
Some traders refer to the hammer candlestick as a bullish rejection bar, or a bullish pin bar. Either way, the implication is the same. That is to say that upon completion of the hammer candlestick formation, prices should begin to move higher.
There are several techniques for trading the hammer candlestick. One of the most common entry techniques is to wait for a break above the high of the candle and immediately enter a long position upon that event. Alternatively, some traders prefer to wait for a pullback lower following the completion of the hammer candle to enter a long position, thus realizing a better entry point.
This is also a good entry technique, because, after the completion of the hammer formation, prices will often retrace a portion of its structure before resuming to the upside. A typical retracement entry would call for a 38% or 50% retracement of the hammer candle before entering the long position.
Let’s take a look at an example of the two entry techniques that we’ve discussed for the hammer pattern.
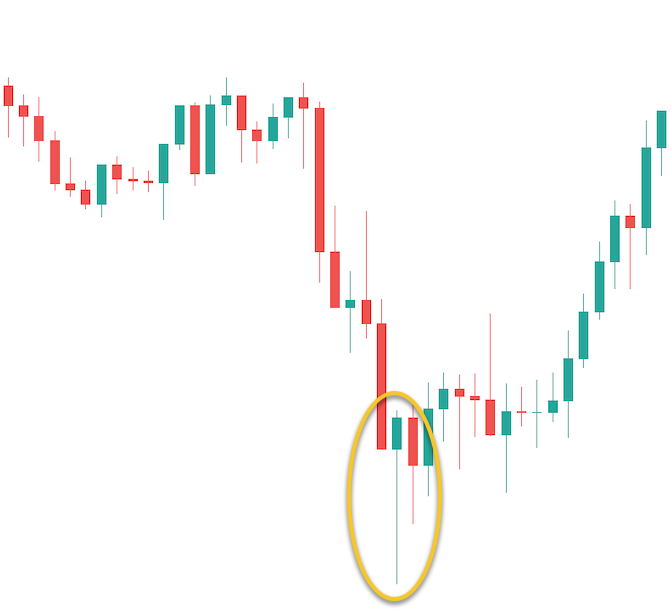
The chart above displays a down trending market condition, which ultimately leads to a hammer candle formation near the bottom of the price range. The hammer candle is circled in yellow. Notice the long lower wick within that candle structure. Additionally, you will note that the body of the hammer candle is relatively small, and the upper wick is also relatively small.
And most importantly, we can see that the candle closes within the upper one third of the price range. With all of these conditions being met, and knowing that the structure occurs within the context of a declining price move, we can be fairly confident that the structure is indeed a valid hammer candlestick formation.
Now let’s go back to the two entry techniques. The first entry technique calls for a break above the high of the hammer candle as a signal to go long. This signal occurred on the candle immediately following the completion of the hammer candle. Although it’s a bit difficult to see on the price chart, this following candle did move above the high of the hammer candle, thus it would have triggered a long trade using this entry technique.
Now, if we used a 50% retracement entry technique, this too would have triggered on the same bar following the completion of the hammer candle. Notice how this candle also moves just below the midpoint of the hammer candle before resuming higher. As such, if we had placed a limit order at the 50% retracement level, we would have been able to enter a long position using this second entry technique.
Both entry techniques would have gotten us into a long trade, however, notice how the second entry technique provides us with a much better entry point. As such, we would have been able to create a better risk reward profile using the retracement entry method.
Shooting Star Candlestick Pattern
The shooting star candlestick is the inverse of the hammer candlestick. It is also a significant formation. The shooting star is a reversal single candlestick formation that is often seen at the end of an up trending market environment. In addition, the shooting star also occurs at the termination of the corrective phase within a larger down trending market move. Below you can find an illustration on the Shooting star candlestick pattern:
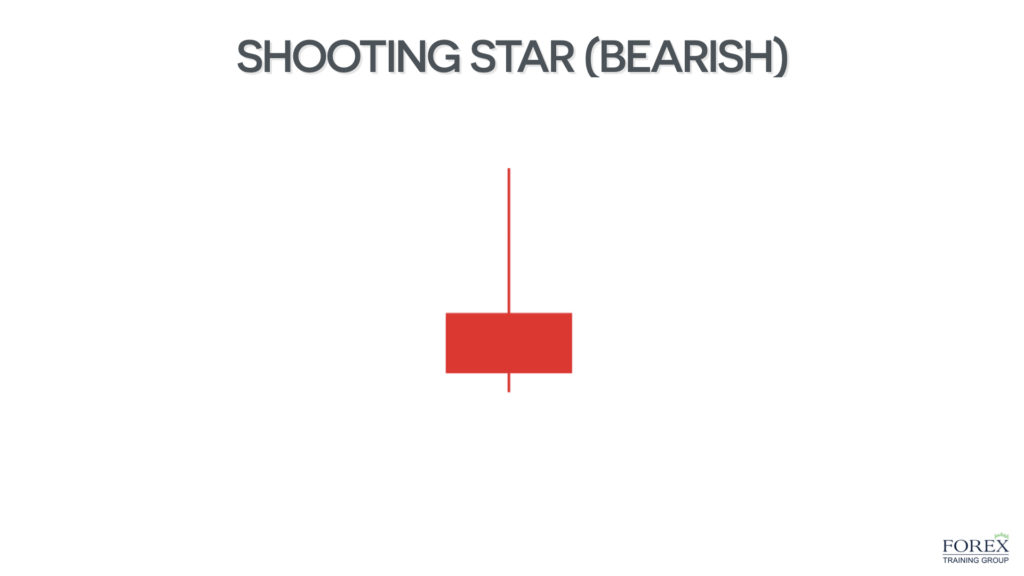
As we can see from the illustration above, the shooting star candlestick formation appears as the inverted version of the hammer candlestick formation. But while the hammer candlestick pattern occurs within the context of a bearish price move, the shooting star candlestick pattern occurs within the context of a bullish price move.
Notice how the shooting star candle has a relatively long upper wick and a small or nonexistent lower wick. The body of the shooting star candle will be fairly small in relation to the overall structure. And one of the most important criteria is that the shooting star closes within the lower one third of its entire structure. If all of these features are confirmed, and the price is moving higher, then we can classify the structure as a shooting star formation.
The long wick within the candle presents a scenario wherein the buyers were trying to take prices higher, but they ultimately failed in doing so, as the bears came into the market overwhelming the bulls. We know this because the close within the shooting star formation occurs at or below the bottom one third of its structure.
Some traditional technical analysts refer to the shooting star formation as a bearish rejection bar, or a bearish pin bar. Nevertheless, the expectation is for the prices to move lower following the completion of the shooting star formation.
The general technique for trading the shooting star pattern is similar to that of the hammer candlestick, but in the opposite direction. That is to say that the most common entry technique requires a break below the low of the candle to enter a short position. And the retracement entry would call for a pullback higher into the 38 to 50% level of the completed shooting star formation.
The shooting star pattern can provide for a solid shorting opportunity, as many markets tend to fall much faster than the rise. As such, it can be a very profitable pattern to trade when the right conditions exist.
Marubozu Candle Pattern
The Marubozu candlestick pattern is a single candle formation which is considered a continuation pattern. The Marubozu candle can occur within any type of market environment. This includes an up trending market, a down trending market, or a range bound, directionless market condition.
Below you can find an illustration of the Marubozu candlestick pattern:
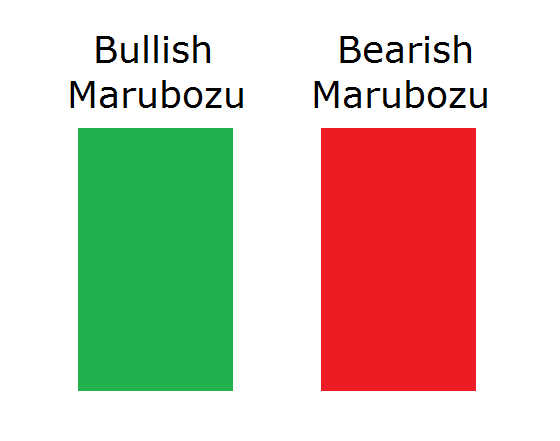
Here we’ve shown both the bullish variation of the Marubozu candle in green, and the bearish variation of the Marubozu candle in red. Essentially, the bullish Marubozu candle opens at or near the lower end of the structure and closes at or near the upper end of the structure. The bearish Marubozu candle opens at or near the upper end of the structure and closes at or near the lower end of the structure.
There is little to no shadow seen on either extreme of the bullish or bearish variety of the Marubozu pattern. In addition to this, the higher probability Marubozu formations tend to be relatively large in size compared to the most recent price action.
So what does the Marubozu single candlestick continuation formation tell us about the underlining psychology in the market? Well the bullish Marubozu formation suggests that the market is displaying bullish momentum, and that the demand in the market is much greater than the supply. As such, the implication is that prices should continue higher.
And the bearish Marubozu formation suggests that the market is displaying bearish momentum, and that the supply is much higher than the demand. As a result, the expectation is that prices should continue lower.
And so, the price action following the Marubozu candlestick will generally continue in the bullish direction in case of a bullish Marubozu, and in the bearish direction in case of a bearish Marubozu. The best Marubozu candle structures, however, tend to occur in alignment with the overall trend.
That is to say that a bullish Marubozu formation that occurs within the context of a rising price leg is more significant than one that occurs within the context of a declining price leg. And similarly, when a bearish Marubozu formation occurs within the context of a declining price leg, it is more significant than one that occurs within the context of a rising price leg.
The Marubozu formation is particularly significant when it occurs as a breakout signal. An example would be when a bullish Marubozu occurs as the breakout candle from an important resistance level or the bearish Marubozu occurs as the breakout candle from an important support level. Most traders that rely on the Marubozu formation, will often place a market order to buy upon completion of a bullish Marubozu, or a market order to sell upon completion of the bearish Marubozu.
Doji Candlestick Pattern
The Doji candlestick pattern occurs quite frequently on the price charts. As such, traders should be selective in distinguishing between Doji formations that are worth trading versus those that are not necessarily that significant. Experience will play a part in recognizing those higher probability Doji formations that occur on the price chart. One particular scenario wherein a Doji formation is of importance is when it forms consecutively following an extended price move, either up or down.
Below you can see an illustration of the Doji candlestick pattern:
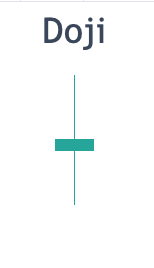
The Doji candlestick to can be seen as a relatively small structure that appears to have a small body and shadows of relatively equivalent length on either side. These shadows would generally be larger in length than the body of the candle. The Doji candle can either close up, close down, or close at the exact same price.
And so the actual type of close is of little consequence within this formation. But the more important consideration is that the price close at or near the center point of the entire candle. Note how all of these criteria have been met within our illustration.
The price dynamics within the Doji candlestick suggest that the market is experiencing an indecision phase. This indecision phase can be seen by the prices meandering higher and lower, but closing near the opening price of the candle. As such, neither the bulls nor the Bears are in control during this candle formation. Instead, the market appears ambivalent as to where the next price leg is likely to go.
Often, a Doji candle, or a set of Doji candles will form prior to a significant scheduled news event or economic report. And so, just prior to this event the market appears quiet anticipating what the news will bring. Upon the news release, traders will begin to position either long or short, at which point the price movement will ultimately breach the high of the Doji candle, suggesting higher prices to come, or breach the low of the Doji candle, suggesting lower prices to come.
Summary
We discussed the major single candlestick patterns that appear frequently on the price charts. These formations can occur across every timeframe, however, they tend to be more predictive when they occur on relatively higher time frames such as the eight hour chart, daily chart, and weekly chart. And as we have noted earlier, these candlestick patterns, should never be used in isolation. But rather they should be combined with some other technical analysis methods such as support and resistance levels, Fibonacci levels, or moving average lines.