When it comes to achieving and maintaining success in trading, it is critically important to have a rules-based trading method. Many new traders mistakenly believe that market professionals simply follow the market and act on impulse. However, any seasoned market professional will tell you that having a system or strategy is the bedrock of trading success.
Having a system simply means identifying a setup that you use and developing a set of trading rules around that setup. Approaching the market with a clear strategy in mind affords you a much better likelihood of being successful in the long run.
However, given the wide range of technical tools and analytical approaches to the market, it can be tricky for new traders to identify a good strategy or system to use. With this in mind, we’re going to explore one of the more popular and effective trading approaches which is the volatility breakout system. Now, before we get into looking at the volatility breakout strategy in detail, let’s just quickly make sure we are all on the same page with some of these terms.
What is Volatility?
So, first of all, volatility simply refers to the amount of movement in the market. A very volatile market sees a lot of movement. You can quite easily spot a volatile market straight away by looking at a chart. If you see lots of big swings and price moves, this is a volatile market. If there is little volatility in the market, this means there is not a great deal of movement. Again, you can spot a non-volatile market quite easily on a chart because the price action will be very muted and restrained.
Now, one very important thing to note here before we get into discussing different volatility breakout strategies, is that all markets go through varying degrees of volatility. If we take EURUSD for example, sometimes the market will be volatile, seeing lots of big movements, other times the market will see reduced volatility and exhibit very little movement.
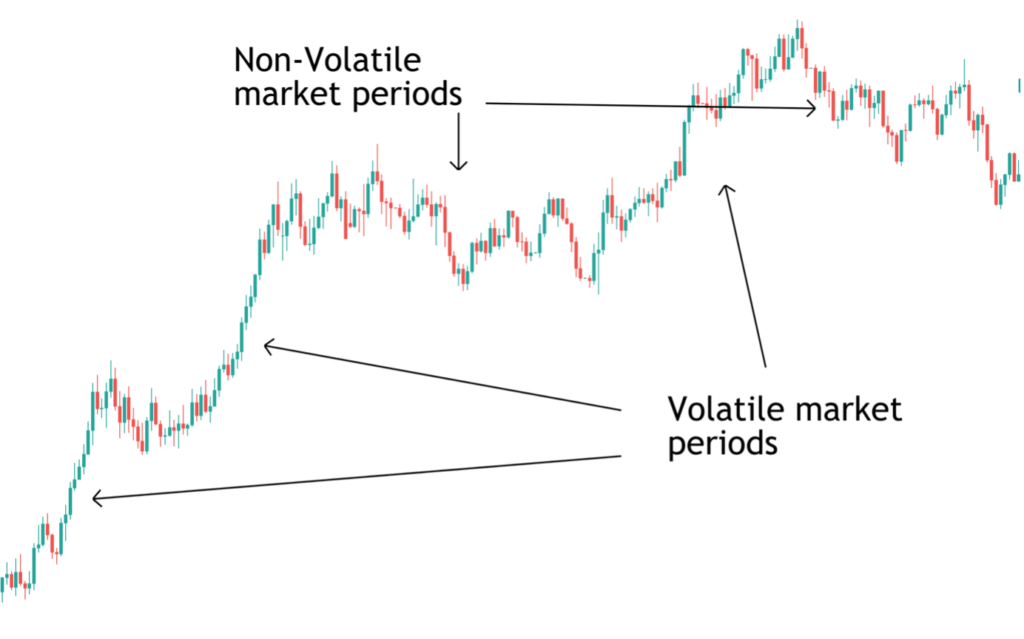
In the chart above you can see periods where price is making big moves, labelled as volatile market periods. At other points, however, you can see that volatility decreases and price stops making big moves. We typically call these two periods trend (increased volatility) and range (decreased volatility).
If you look through any price chart of any instrument or market, you will see that price goes through periods of high volatility and periods of low volatility. This is precisely what creates the opportunity when implementing a volatility breakout method.
Volatility Breakout Trading Using Support & Resistance
The objective of the volatility breakout trade is to capture price as volatility increases. So essentially, capturing the market as it switches from ranging mode to trending mode. This type of volatility breakout system can be operated on any timeframe and in all markets. There are various approaches we can use and even some tools and indicators that can help us. So, let’s take a look at some different volatility breakout strategies.
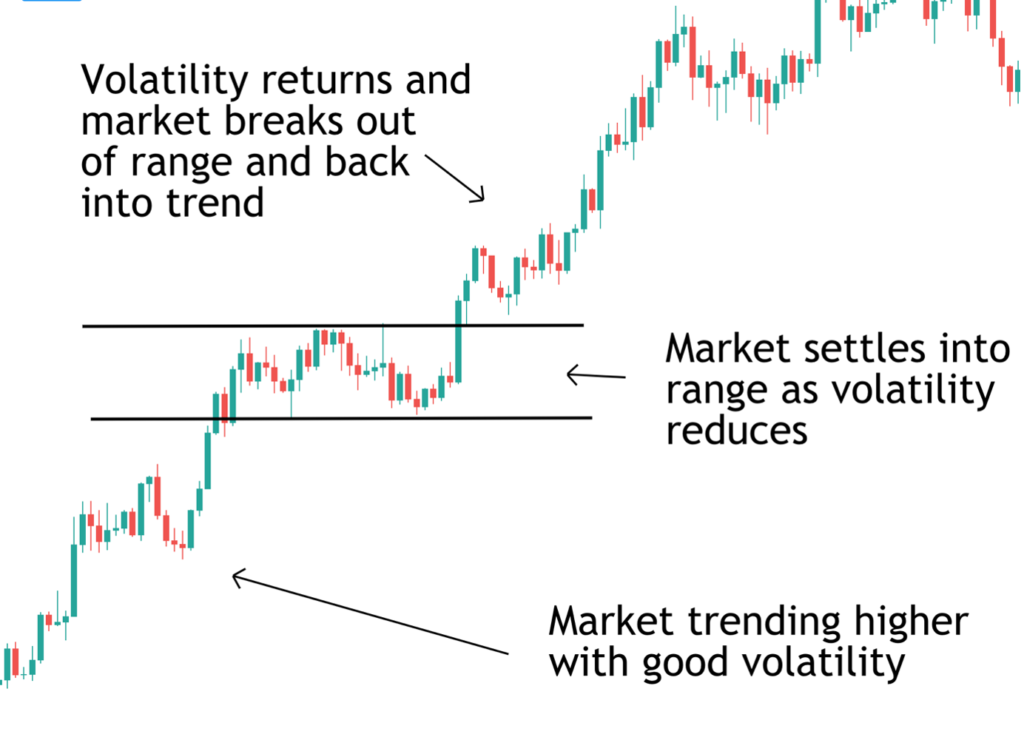
In the chart above you can see an example of the most basic type of volatility breakout trade. To begin with, in the bottom left-hand corner, we can see that price is trending higher with plenty of volatility in the market. However, in the middle of the chart, you can see that price settles into a range as volatility dries up.
Once we see price pause like this, we can go ahead and draw in our support and resistance lines, marking the swing high and the corrective low of this market pause. This gives us our range. We then simply monitor price action and look for price to breakout of the range and continue higher.
Volatility Breakout Trading With the Trend
Now, it is important to note that for best results, we only want to take the volatility breakout trade if price breaks above the range. Because price was trending higher before the range started, we know that there is a better chance of us capturing volatility if price breaks out higher, continuing the trend. If price breaks below the range, this would be a counter-trend trade and is not something we would look to trade with this system.
Now, the beauty of this system is that it is very simple and only relies on you drawing in the support and resistance lines to highlight the range. Once the range has been established, you can even set a price order above the range to capture the volatility breakout if you aren’t in front of the charts.
So, in this scenario, we would enter a buy trade as price breaks out above the top of the range and we would place our protective stop just below the low of the range. We would then look to target a minimum of twice our risk, this ensures we achieve a positive risk-reward on the trade.
Volatility Breakout Trading with Indicators
Now, while this system is very simple and straightforward to use, some traders prefer to use a volatility breakout indicator. Technical indicators can be incredibly useful for trading a volatility expansion. One of the most popular indicators to use is the Bollinger Bands indicator.
What Are Bollinger Bands?
The Bollinger Band is a technical indicator used to measure volatility and trend direction. The indicator is comprised of a 20-period moving average (the line in the middle of the bands) and an upper and lower band which mark two standard deviations above and below the average. So, this gives us our bands. The purpose of the indicator is to measure volatility in the market and to identify trend.
So, if the bands are wide, this means that volatility is elevated because price is making big moves away from its average price. If the bands are contracted, this means that volatility has reduced as price is not moving too far away from its average.
Also, if the bands are turned higher, this means the market is in an upward trend. If the bands are turned lower this means the market is in a downward trend. Finally, if the bands are basically moving sideways, this means the market has not trending and has settled into a range.
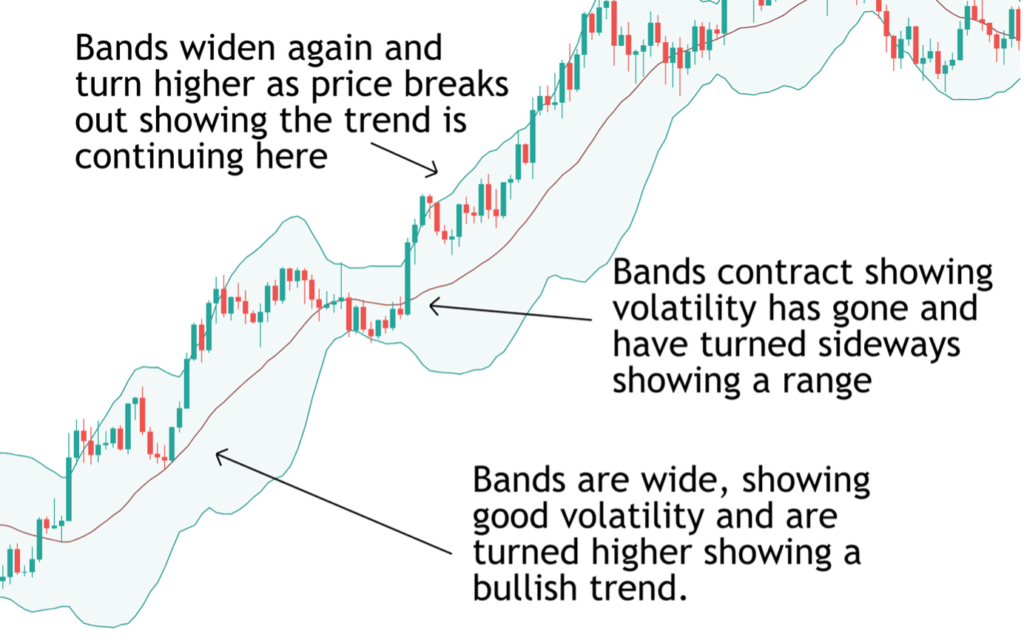
So, if we look at our chart example again but this time with the Bollinger Bands indicator turned on you can see just how useful the indicator can be in helping us capture a volatility expansion. So, to begin with, price is trending higher and we can see the bands are turned higher and are nice and wide, showing there is plenty of volatility in the market.
You can then see that as price paused midway up the move, the bands contract as the market loses volatility and price settles into a range, shown by the sideways bands. However, as price breaks out above the top of the sideways bands the bands then widen once again (showing that volatility has returned) and turn higher once again, showing the bullish trend is continuing.
So, as with our basic volatility breakout strategy, how we would trade this is to place a buy trade as price breaks out above the top of the bands, without sop placed below the low of bands.
How to Manage the Trade
Now, in terms of how we manage this trade. We have two options. The first is that we can trade this in the same manner as our classic volatility breakout trade where we simply look to target twice our risk. Alternatively, we can look to use the Bollinger Bands indicator to manage the trade.
So, because the center line of the Bollinger Bands is a moving average, we can look to manage this trade in the same way we would as trading with a moving average. We are in a bullish trade and we know that the market is in a bullish trend while above the moving average. So, with that in mind, we can look to keep our trade open until price crosses back below the moving average, suggesting our bullish trend is over.
Alternatively, we can take another approach using the Bollinger Bands whereby we keep our trade open until price touches the lower Bollinger Band. Because of what we know about how the Bollinger Bands work, we know that there is a good chance price will continue to trade higher while the bands are turned higher. Now, if price comes back down and touches the bottom of the Bollinger Bands, this means that price is either settling into another range, and we can take profit and wait for another opportunity to set a buy trade, or price is potentially reversing and so we want to exit and reassess.
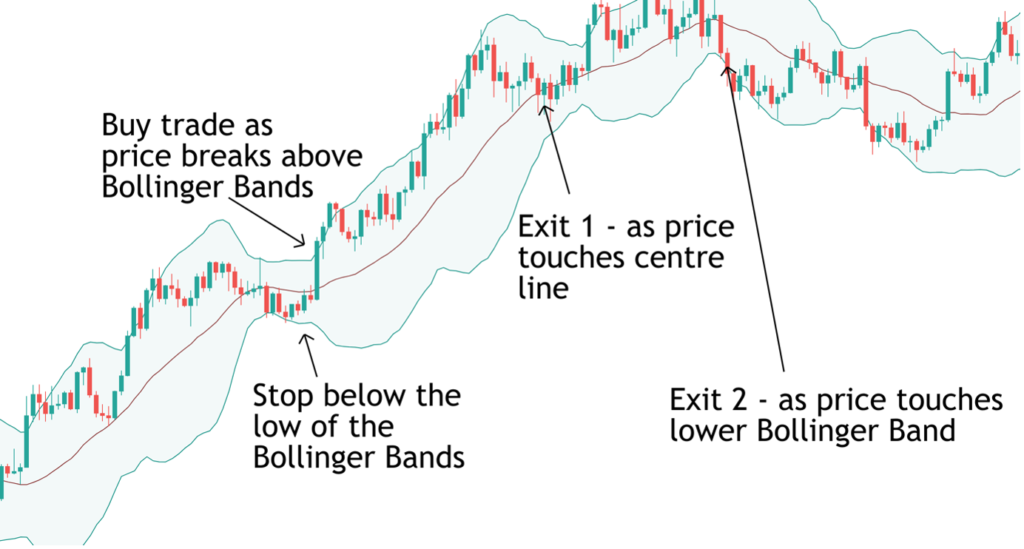
So, if we look at our chart again. You can see our entry point as price breaks out above the top of the Bollinger Bands and you can see our stop loss placed below the low of the Bollinger Bands at entry.
Then, you can see our two exit points. The first is the location at which price crosses below the center line. The second is the location at which price touches the lower Bollinger Band.
So, in this example, we can see that if we had kept our trade open until price touched the lower Bollinger Band, this would have given us slightly more profit on the trade.
Volatility Breakout Trading Using Indicators with Support & Resistance
Now, so far, we have looked at how to use traditional support and resistance to identify trends and ranges in order to capture a volatility breakout. We have also looked at how we can use the Bollinger Bands indicator to capture breakouts in a trend. However, if the market has settled into a range for a long period of time, how do we trade a volatility breakout strategy? Well, using the Bollinger Bands as well as support and resistance together to help us, the answer is quite simple.
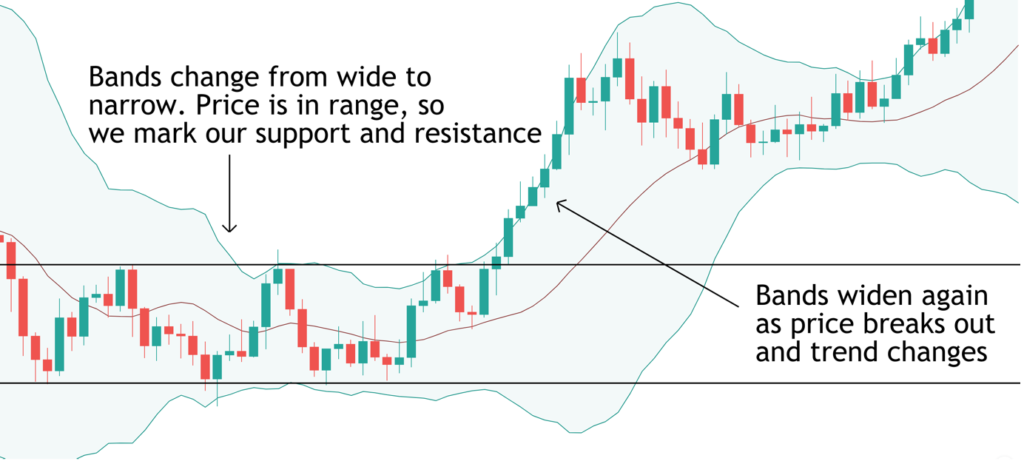
In the image above you can see that price has settled into a range following a sell-off. The wider bands turned lower into the start of the range indicate that price was in a bearish trend. However, once price settles into the range and we mark our support and resistance lines, we can see that price fails to break lower. The bands contract further showing that volatility has gone and have turned sideways, showing that the range is getting stronger.
So, in this scenario, as the range has held for so long, we can anticipate that a trend reversal is potentially underway and as price breaks out above the upper Bollinger Band and above our resistance level, we can enter a buy trade, with our stop below the support line. Again, in this scenario, we can either look to target twice our risk or we can manage the trade with the Bollinger Bands as we discussed earlier.
Day Trading Volatility Breakout Strategies
Now, up to this point, we have been looking at operating volatility breakout strategies on the higher timeframes, the daily charts. However, volatility breakout trading is just as effective on the lower time frames, such as the 15 min chart and smaller still.
Once again, when day trading volatility breakouts we can look to combine indicators with basic understanding of trend and range, support and resistance to help identify a great volatility breakout trade. As we have already explored how to use the Bollinger Bands indicator, let’s move on and take a look at another fantastic indicator we can use.
Using the ADX Indicator
Another really useful indicator that we can employ when trading a volatility breakout strategy is the ADX indicator. The Average Directional Index is an indicator that measures the strength of moves in the market. The indicator line oscillates within a range of 0 to 100. Typically, if the indicator line is below 30, this means the market is in a range and volatility has weakened. As the ADX line rises above 30, this means volatility is picking up and once above 50 this means volatility is high and the market is in a trend phase.
So, with this in mind, we can use the indicator to establish when there is a volatility expansion underway, and we can then employ our knowledge of trend, ranges, and support and resistance to trade a volatility breakout.
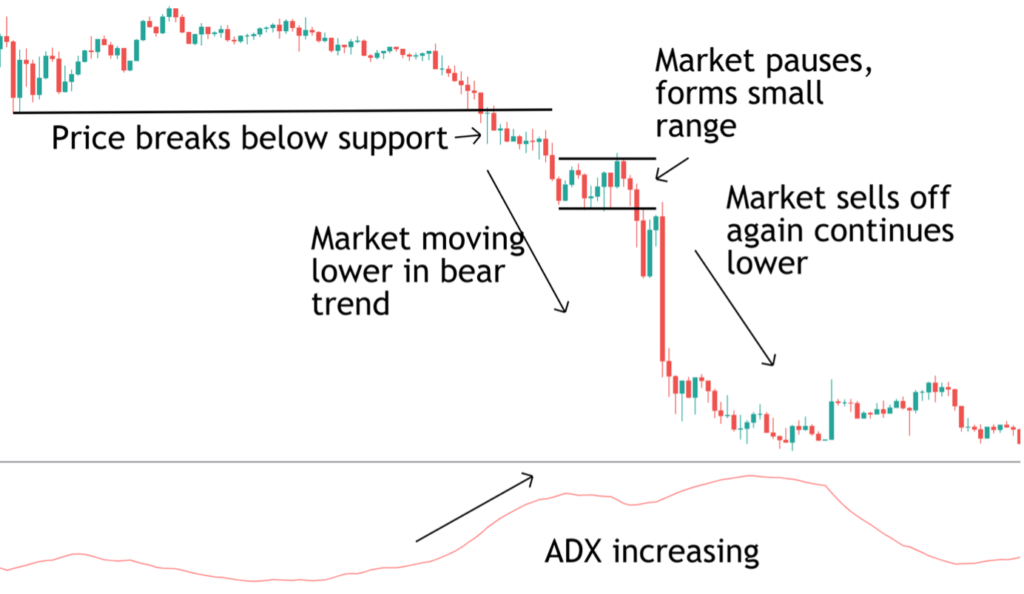
So, in the image above you can see a great example of how to day trade volatility breakouts. To begin with, you can see that price was trading in ranging conditions with very shallow price action. You can also see that the ADX indicator line was in the lower end of its range, reflecting decreased volatility. Now, as price starts to turn lower the market breaks below the support level, it suggests the start of a trending move.
We can see that as price is moving lower, the ADX indicator starts to move higher reflecting that volatility is picking up. So, once we identify these conditions we have two choices, the more aggressive choice is to simply enter a sell trade looking to capture the volatility and the continuation lower.
However, entering the market like that is risky and hard to make work in the long run. The other option is to wait for a pause in the breakout and then look to trade a continuation. So, once price has started to breakout lower and the ADX is rising, showing us that volatility is increasing, we wait for consolidation.
You can see that shortly after the breakout starts, price settles into a small range and we actually see the ADX indicator flattening out, showing us that volatility is decreasing. So, once we have drawn in our support and resistance levels to frame the range, we can then go ahead and trade the volatility breakout as the price breaks below the range and continues the bearish trend. You can see that as price breaks out below the range, the ADX indicator turns higher again confirming the volatility expansion.
Conclusion
Hopefully, you can now see just how simple and effective volatility breakout systems can be. The great thing about trading this type of volatility breakout method is that it works in all markets and on all timeframes. So, whether you are looking to trade a volatility breakout in forex or a volatility breakout in futures, the methods discussed in this article can help you.
It is important to remember that as with all systems and strategies, the best results will come with practice, so it is important to spend the necessary time studying the charts. This includes identifying different market conditions, trend (high volatility) and range (low volatility), and drawing in your support and resistance lines. Spend time with the different indicators we have looked at here and see if there are any other indicators you can incorporate into your volatility breakout trading. And finally, as always, make sure to always trade with a stop loss and always target positive risk-reward.