One of the best ways to increase your chances of success on any specific trade set up is to look for technical confluence. The logic being that the more unrelated pieces of evidence that we can gather the support a particular position, the better the odds for a favorable trading outcome. Fibonacci clusters represent a type of confluence wherein multiple Fibonacci ratios align to provide a high probability area of hidden support or resistance.
Fibonacci Ratio Basics
The proper application of Fibonacci clusters must start with a basic understanding of Fibonacci ratios. Fibonacci ratios are derived from the Fibonacci sequence of numbers which have many special properties within the natural universe. This Fibonacci sequence of numbers is a series of numbers wherein the resulting number is calculated as the sum of the two previous numbers. And this process can go on into infinity.
This sequence of numbers was discovered by Leonardo Fibonacci, who was a 13th-century mathematician. He was working on a mathematical problem pertaining to the reproduction of the rabbit population when he discovered this important sequence of numbers, which is aptly named after him.
Below you will find the beginning set of the Fibonacci sequence of numbers.
0, 1, 1, 2, 3, 5, 8, 13, 21, 34, 55, 89, 144, 233, 377…
Notice how each number in the sequence is the resulting sum of its preceding two numbers. For example 8 equals 3+5, 55 equals 21+34, 144 equals 55+89, and 377 equals 144+233, and so on and so on into infinity.
Now if you divide each number by its next higher number, you will find that the resulting ratio approaches .618. For example, 5÷8 equals .625, 8÷13 equals .615, 34÷55 equals .618, 89÷144 equals .618, and so on and so on. This .618 ratio is one of the most important Fibonacci derived ratios as it relates to the financial markets.
Now if you divide each number by its second higher number, you will find that the resulting ratio approaches .382. For example, 5÷13 equals .384, 13÷34 equals .382, 34÷89 equals .382, and so on and so on. This .382 ratio is also a very important Fibonacci derived ratio that is often seen within the financial markets.
There are other Fibonacci ratios as well that are quite important and are derived from the Fibonacci sequence of numbers. The most important Fibonacci ratios include the following – .236, .382, .618, .786, 1.27, 1.61, and 2.61.
What Is Fibonacci Confluence?
Fibonacci confluence refers to a condition wherein two or more Fibonacci ratios confirm a particular level. Essentially, Fibonacci confluence provides additional confirmation for the potential reversal at a specific level. This level is typically a price level, however, it can also be a time level. The four primary Fibonacci tools used to locate areas of confluence include Fibonacci retracements, Fibonacci projections, Fibonacci extensions, and Fibonacci time ratios.
Fibonacci confluence levels can be useful in a variety of trading applications. This includes finding optimal points of entry, or locating potential target levels at which to close out an existing trade. In addition, Fibonacci confluence levels can be used as an initial stop or a trailing stop mechanism as well. They can also be used in combination with key horizontal price levels to help determine a high likelihood reversal area.
Some traders will combine Fib confluence levels with candlestick patterns or other technical based tools. One of the best ways to utilize Fibonacci confluence is in combination with Elliott wave. Elliott wave helps a traders understand the overall structure of the market, and where a particular market is trading within that structure, while Fibonacci levels can provide a market timing mechanism for executing trades within that framework.
Additionally, it’s important to understand that the heavier the cluster that forms around the level, the more likely it is for that specific level to hold prices. For example, a Fibonacci cluster that consists of three distinct measurements that forms below the price action would provide for a stronger level of support then one that consists of only two Fibonacci measurements, or a single fib measurement.
Also, in terms of the actual Fibonacci tools themselves, a cluster can form using a single Fibonacci tool, or a combination of two or more Fibonacci tools. For example, a Fibonacci cluster that forms using multiple Fibonacci retracements, would be just as valid as a Fib cluster that forms using a Fibonacci retracement combined with a Fibonacci extension for example. The most important condition is that a cluster should form within a close vicinity of one another at an important Fib ratio level.
Fibonacci Retracements Cluster
A Fibonacci retracement measures the internal price correction within a larger price swing. The most important Fibonacci retracement levels include the 38%, 50%, 61%, and 78%. Upon price reaching these levels, there is a likelihood that a reversal could occur. Now, when we combine two or more different swing points, we can locate certain areas where a Fibonacci retracement cluster might occur.
Let’s see what such a Fib retracement cluster appears as. On the chart below, you will find the price action for the USDJPY currency pair based on the eight hour timeframe.
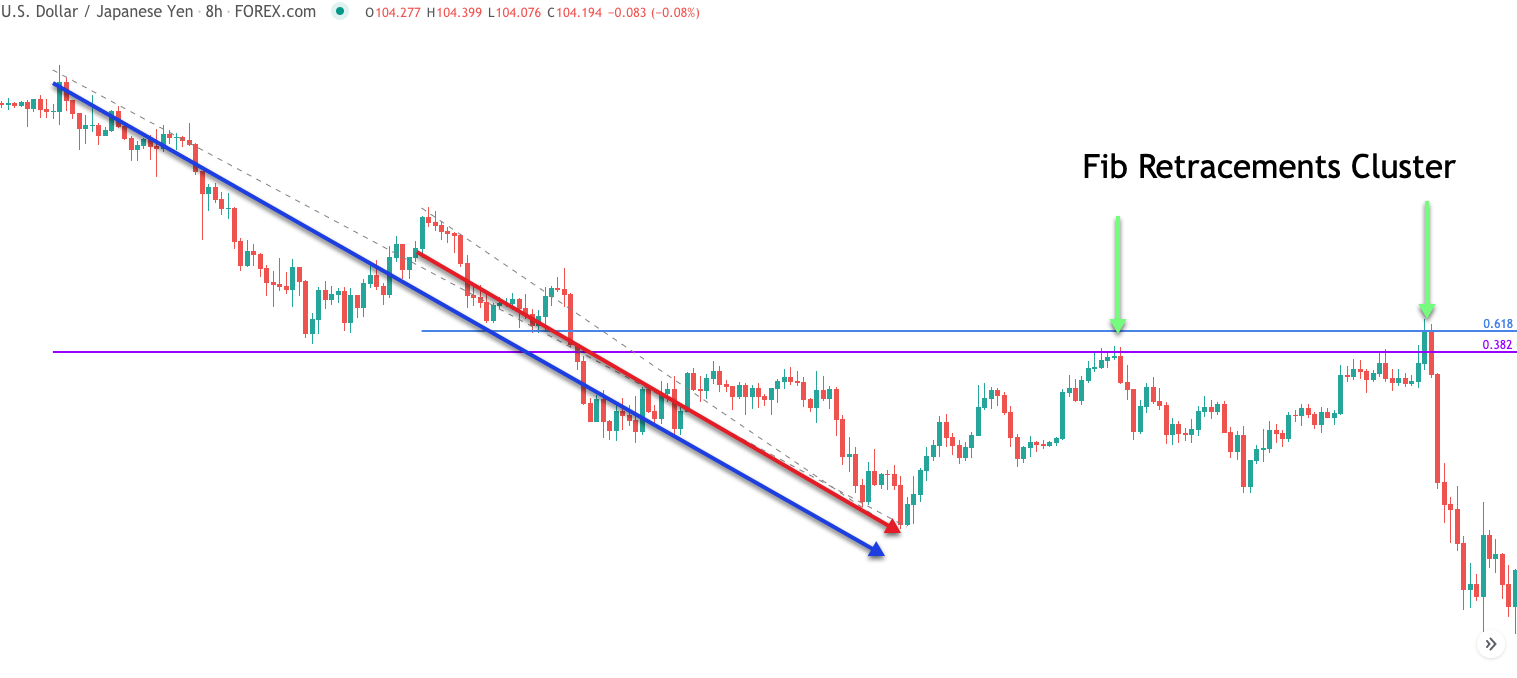
The blue arrow represents the larger price swing, and the lower horizontal purple line represents the 38% retracement of that price swing. Additionally the red arrow represents a smaller price swing, and the upper horizontal blue line represents the 61% retracement of that price swing.
In this example, along with others that will be illustrating later, we have removed all Fibonacci levels that would typically be seen on the chart, except the important Fib cluster area. The reason for doing this is so that you can clearly see the Fibonacci cluster area more clearly.
Notice how both of these levels are aligned near one another in fairly close proximity. As such we would consider these levels as providing Fibonacci confluence. Notice how the price moves into these areas before rejecting back to the downside. The two green arrows show quite clearly how these levels represented a strong level of resistance as prices were moving towards it from below. Ultimately, the price reverses significantly following the second test, which led to a strong impulsive move lower.
Fibonacci Retracement And Projection Cluster
Let’s now take a look at another example of a Fibonacci cluster area. This example will illustrate a Fibonacci cluster that results from a Fibonacci retracement level, and a Fibonacci projection level. We have briefly discussed what Fibonacci retracements are, and the most important ratios within it. Now, we will briefly explain the workings of the Fibonacci projection study.
The Fibonacci projection tool is used to measure price moves occurring in the same direction. And so, it requires three points in its measurement. The initial point of the swing, the endpoint of the swing, and the projection point. The projection point is the level from which the Fibonacci projection level is measured from. Essentially, the Fibonacci projection tool allows us to measure the length of price swings moving in the same direction.
The most important Fibonacci projection ratios include 61%, 100%, 127%, and 161%.
Below you will find the candlestick chart for the EURJPY Forex pair shown on the weekly timeframe.
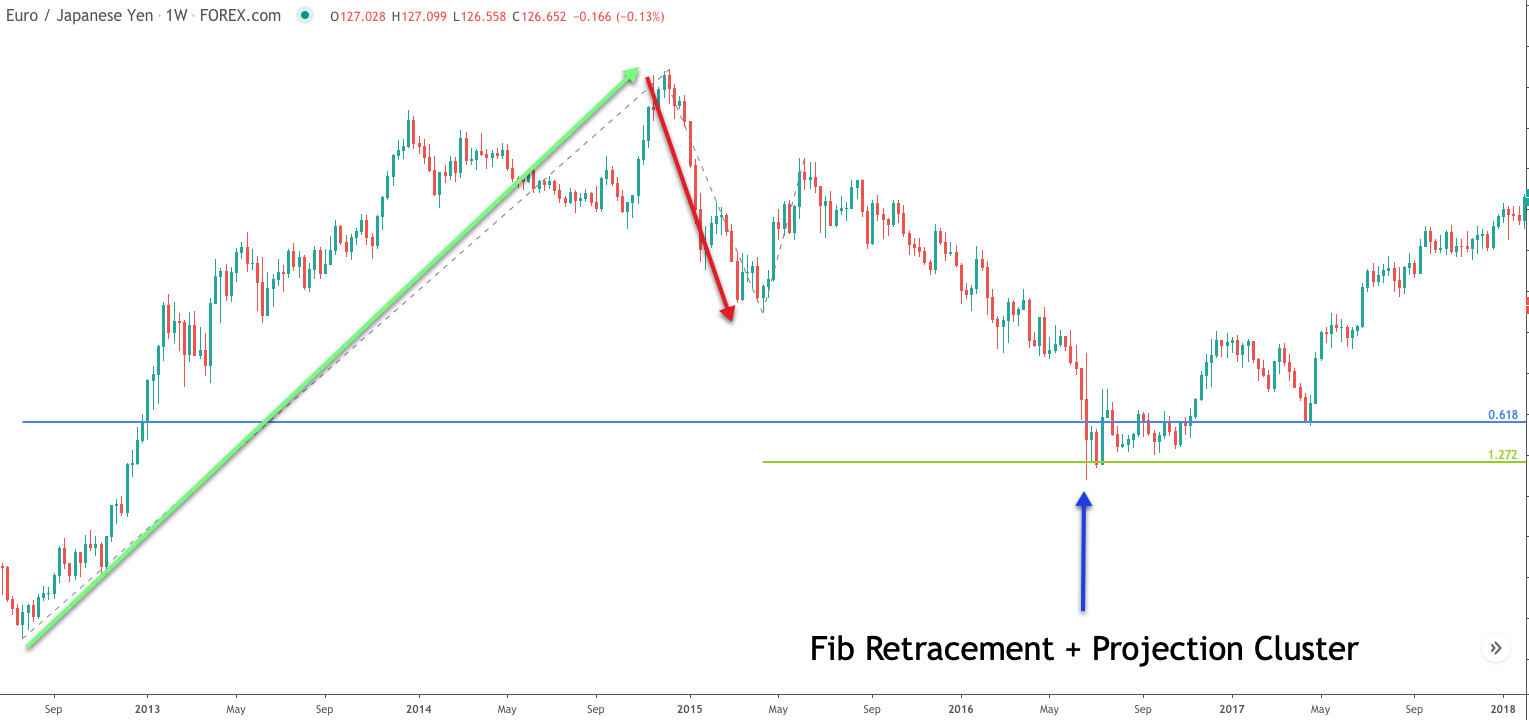
The green arrow pointing upward represents the bullish price swing. The beginning and end of that price swing will be used to measure its internal retracement via the Fib retracement tool. The blue horizontal line marked on the price chart represents the 61% retracement of this price swing. The red arrow pointing downward represents the price swing that will be used for projecting the subsequent swing moving in the same direction. To do this we would select the swing high, and swing low as shown by the red arrow, and then select the subsequent swing high following this bearish price leg.
Once these three points are selected, the Fibonacci projection tool will plot the most important fib projection levels on the price chart. Again, for the purposes of clarity we have only shown the 127% Fib projection, since that is the most relevant one for this example. This 127% projection level is shown by the green horizontal line on the price chart.
Notice how the Fibonacci retracement of 61% is in relatively close proximity to the 127% Fibonacci projection as referenced above. As such, we can say that there is a Fibonacci cluster or confluence within this area that should act to support the level as price draws near it from above.
As is clearly evident from the price chart, just as soon as price entered into the Fibonacci zone, and breached the 127% projection level, prices quickly reversed and began to trade higher. And so this Fib cluster zone was successful in providing support for prices after the corrective downtrend.
Fibonacci Projection And Extension Cluster
Continuing on our discussion of Fibonacci cluster zones, let’s now turn to an example that illustrates a Fibonacci cluster area made up of a Fibonacci projection level, and a Fibonacci extension level. You should now know what Fibonacci projection levels are, and how to correctly measure them. Let’s briefly outline what a Fibonacci extension is. A Fibonacci extension is a tool that measures an external price swing. And as such, it projects a price move that extends beyond 100% of the measured price leg. Fibonacci extensions are very useful in measuring impulsive price moves.
The Fibonacci extension tool is used to calculate these types of external price swings. As for the mechanics, all you would need to do is select a swing low and swing high when seeking to measure a bearish price move. Alternatively, you would select a swing high to swing low when seeking to measure a bullish price move. The most important Fibonacci extension ratios include the 61%, 78%, 100%, 127%, and 161%.
On the price chart below you will find the price action for the British pound to US dollar currency pair shown on the daily timeframe.
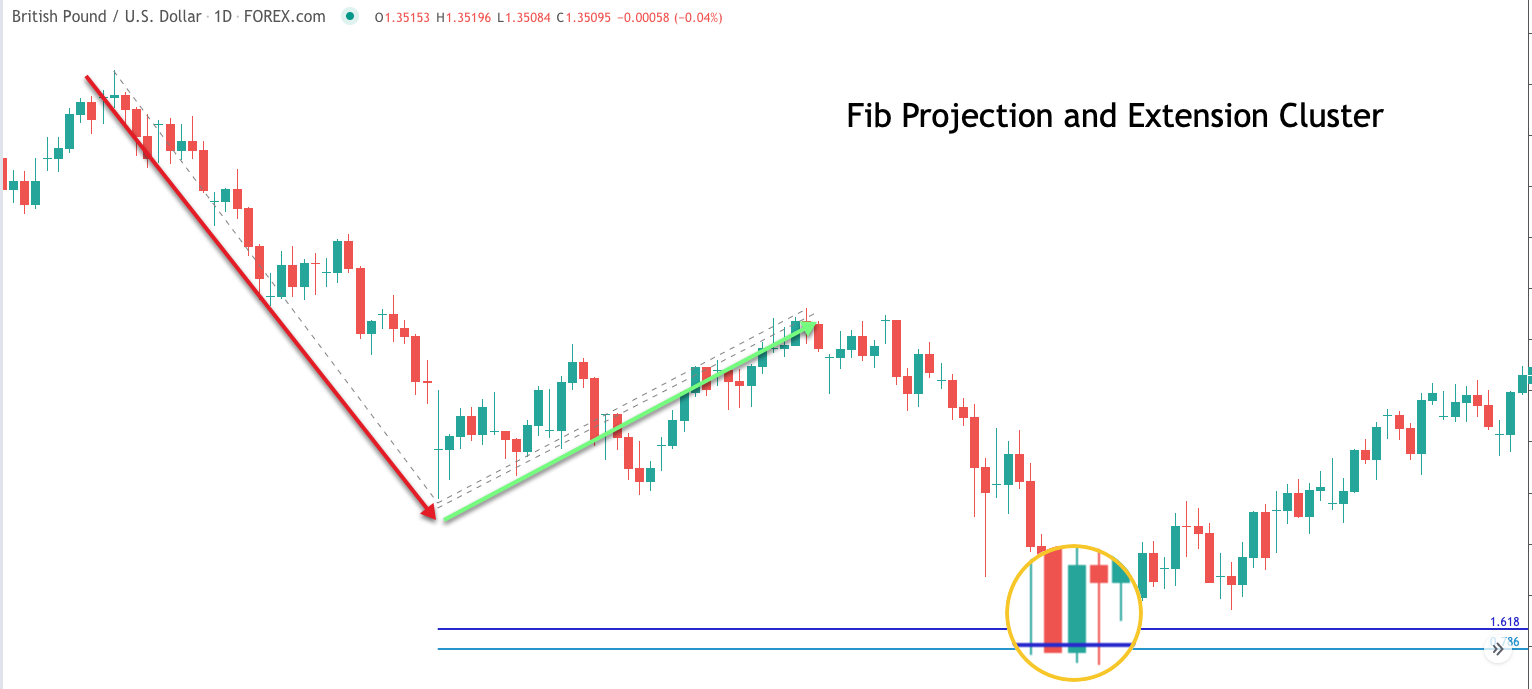
Notice the downward pointing red arrow which represents the price swing that will be used in measuring the Fib projection level. Remember the Fib projection level measures the price swing that is moving in the same direction. As such we would select the swing high and swing low within this red arrow and then select the subsequent swing high following this price move. That third point would be where the green arrow is pointing. Once these three levels are selected, the Fibonacci projection tool will plot its levels. Notice the lower light blue line on the price chart. This level represents the 78.6% projection of the prior swing as shown by the red arrow.
The upper pointing green arrow represents the price swing that will be used in measuring the Fib extension level. Again the extension level is useful in finding the terminal point of an impulsive price leg that follows a corrective price move.
Selecting the swing low at the lower end of the green arrow, and the swing high at the upper end of the green arrow would allow us to project the possible terminal point of following bearish price leg. The upper horizontal dark blue line represents a 161% extension of the prior referenced price swing.
Within the magnified area, You can see how price reversed to the upside upon interacting with this Fibonacci cluster zone.
Fibonacci Time Clusters
Fibonacci time ratios are a lesser-known Fibonacci tool, however, it can be useful in spotting potential reversals based on time. It works similarly to the other Fibonacci-based tools mentioned earlier with the exception that the future levels are based on time relationships rather than price relationships.
And so, when there is a confluence or cluster of Fibonacci time ratios, then that time window represents a zone wherein the probability of a reversal becomes more likely. The most important Fibonacci time ratios include the 38%, 61%, 78%, 100%, and 161%.
On the chart below you can see the price action for the New Zealand dollar to US dollar Forex pair on the daily timeframe.

The upward pointing green arrow represents the larger outer swing within the context of the uptrend. The upward pointing blue arrow represents a smaller inner swing within the context of that uptrend. And so, now that we’ve identified the price swings that we will use in plotting the Fibonacci time ratios, we can study those future time levels which are plotted vertically on the price chart to find any that are aligning or clustering within a close proximity.
The first vertical line, the blue line, shown on the price chart represents the 78% time ratio based on the inner swing, which is shown by the blue arrow overlaid on the price chart. The second vertical line, the orange line, represents the 50% time ratio based on the outer swing, which is shown by the green arrow overlaid on the price chart.
We can see that these two levels appear relatively close to one another. And as such they form a zone wherein a potential reversal may be likely. Notice how the price moves into this fib cluster zone before bouncing out sharply to the upside. As such, this fib time ratio cluster zone provided us an advance warning as to where we might expect prices to reverse in terms of a time window.
Combining Elliott Wave With Fib Clusters
One of the best ways to incorporate Fibonacci ratio analysis into your trading is by combining it with the Elliott wave market theory. Elliott wave provides a detailed framework for the structure of the markets and the price movements within them.
Although Elliott wave is an advanced technical analysis method that does take some time and dedication to master, at the simplest level, the Elliott wave principle says that the markets move between impulsive and corrective phases. An impulse phase is made up of five waves, and the corrective phase is made up of three waves. Impulse waves are labeled as waves 1 through 5, while corrective waves are generally labeled as A, B, and C.
The Fibonacci sequence of numbers and it’s derived ratios are the mathematical fabric for the Elliott wave principle. That is to say that the progressing waves within the market cycle can be measured using specific Fibonacci ratios based on the current position of the market. As such, when we are able to identify where we are within the Elliott wave cycle, and add to that, the knowledge of Fibonacci analysis we can greatly improve our chances of a successful market forecast.
The image below represents the eight hour chart for the US Dollar to Japanese Yen currency pair. We have presented this chart earlier when we were discussing Fibonacci retracements. This time, we have added the wave labels, so that we can illustrate how to best combine the concepts of Elliott wave and Fibonacci clusters.
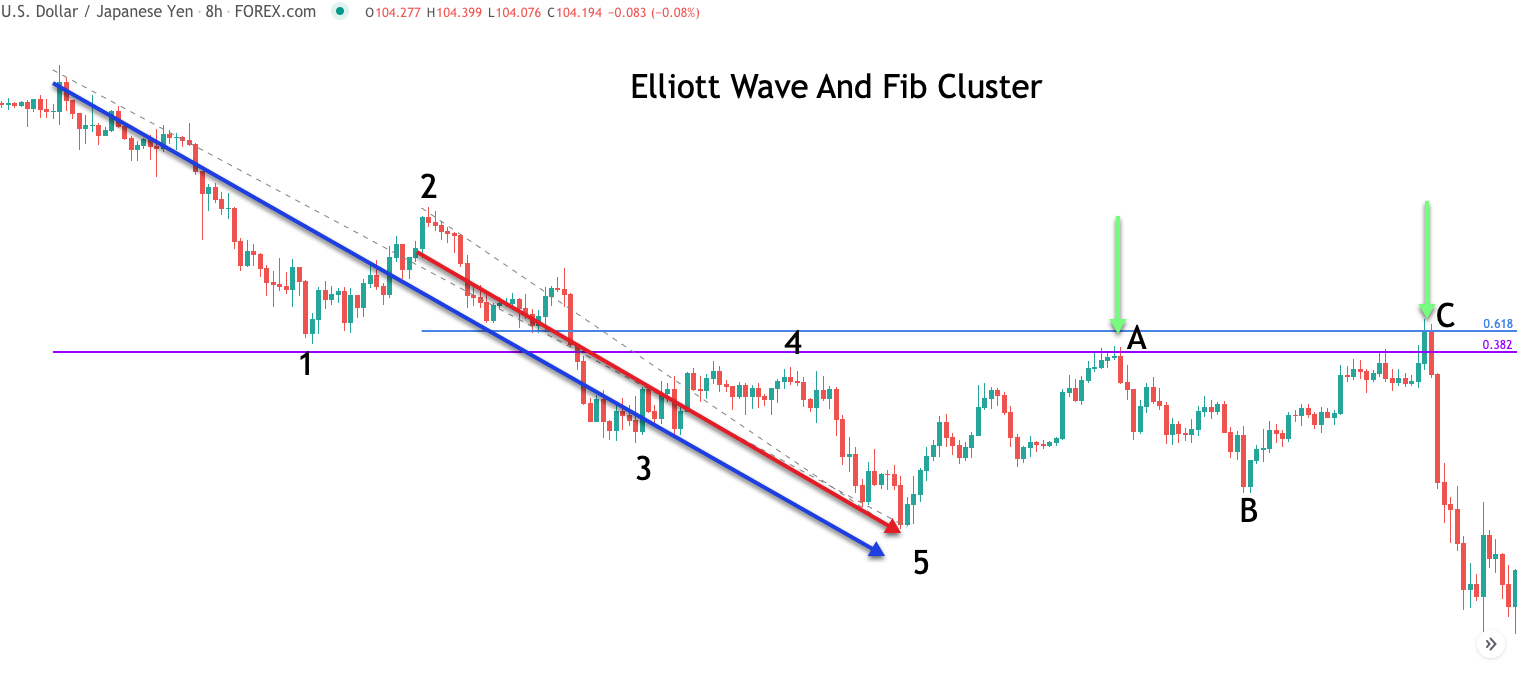
The downtrend begins at the swing high as can be seen at the far left of the price chart. As the price moves lower it completes wave one of the Elliott wave cycle. Then prices move higher to retrace a portion of wave one. This corrective price leg is referred to as wave two. And one of the most important rules within Elliott wave, is that wave two cannot exceed 100% of wave one. As we can see, wave two did retrace a portion of wave one, however, it was certainly less than a 100% retracement.
Following the completion of wave two, the price begins to move lower, but more sharply as wave three progresses. In the vast majority of cases, wave three will be the strongest wave within the sequence, and one wherein there is the strongest momentum seen within the price action.
This is quite evident from the wide range bearish candles that we can clearly see within this wave three price action. Following wave three, we will often see a sideways price movement with overlapping price action. This is characteristic of wave four. Wave four will retrace a portion of wave three but that retracement will be fairly shallow.
Following wave four, the final leg within the impulse phase begins to takes form, and this wave is referred to as wave five. Wave five will terminate the entire impulse sequence. After which, we will see a countertrend move that retraces a portion of the entire price move starting from wave one to the end of wave five. This corrective sequence is referred to as waves A, B, and C.
Notice that following wave five, there was a move higher that entered right into the Fib cluster zone. This is labeled as the wave A price leg. Following that, we can see a zigzag type move within wave B. Finally, prices begin their upside price move once again. This final leg, wave C, takes out the swing high of wave A. It moves right into the Fib confirmation zone once again before getting rejected to the downside. Wave C ends the entire corrective phase, and the new impulse phase down gets underway once again.
Summary
One of the best ways to utilize a Fibonacci-based approach is to look for areas of confluence wherein two or more fib ratios align in tight proximity. Specifically, Fibonacci confirmation using clusters is an excellent technique for forecasting future price swings, and potential reversal zones. Furthermore, although there are some Fibonacci cluster indicators available, it is generally best to perform fib clustering measurements manually.
Again, the vast majority of Fibonacci tools measure price swings on the x-axis, however, as we’ve illustrated earlier, we can also measure potential reversal points on the y axis using fib time ratios. Lastly, although all traders can benefit from utilizing Fibonacci tools as a standalone application, the superior edge comes from combining it with the Elliott wave methodology.