Before you initiate any trade, you must do the proper due diligence and market analysis to ensure that you are giving yourself the highest probability of success on a given trade. Without a coherent process or analytical methodology, you cannot expect to compete successfully in the currency markets or any other financial market for that matter. In this article, we’ll explore the different types of forex market analysis and provide insights on each.
Forex Market Analysis
In the foreign exchange market, currencies are traded in pairs. As a result, Forex traders analyze different currency pairs and attempt to forecast future price action. For example, if you are bullish on the GBPUSD currency pair, what that reflects is your bullish view of the British Pound in relation to the US Dollar. And conversely, your view reflects a bearish sentiment for the US Dollar in relation to the British Pound.
There are various types of forex analysis techniques that traders can use to arrive at their conclusions about future price movements. The major class of market analysis approaches include technical analysis, fundamental analysis, sentiment analysis, and statistical analysis. Within each of these different groupings there are further subcategories of market analysis techniques. Additionally, some FX traders rely on discretionary methods for market analysis, while others have adopted systems trading.
Regardless of the methodology employed, the primary goal of market analysis is to study and gauge the current environment of the specified currency pair under consideration, and determine what the most likely future price direction will be. If you are correct in your assumption, and act on it accordingly, you will benefit from realizing a profitable trade. Conversely, if you are wrong in your assumption, and the trade goes against you, you will realize a setback in the form of a trading loss.
This is a fairly easy and straightforward concept to understand, nevertheless, it’s important that Forex traders take the time to learn the basics of what the goal of market analysis is, before they begin their journey to find a suitable market analysis approach that fits their temperament and style.
As you begin to get your feet wet with different types of Forex market analysis techniques, you should also work towards creating a suitable watchlist. This is important because, although there are dozens of different currency pairs to choose from, not all are suitable for trading. This can be due to extremely low volume, low volatility, wide bid ask spreads, unstable price movements, or a combination of these characteristics.
The best currency pairs to add within your watchlist include the major currency pairs, and the cross currency pairs. Once you’ve decided on the style of trading that suits you and the currency pairs that you will focus on, then you can move forward and put together the best forex analysis tools to assist you in your decision process.
Top Down Analysis In Forex
A top-down analysis approach starts with analyzing the big picture and then moving to lower and lower resolutions gradually to arrive at the most informed decisions about a particular financial instrument or currency pair.
The term top-down analysis is often interchanged with the term multi-timeframe analysis. While both seek to gather information from different trading time frames, a multi-timeframe analysis approach may not necessarily be a top-down approach.
Whether you consider yourself a technical analyst, a fundamental analyst, or a combination of both styles, a top-down analysis methodology can serve to enhance your overall market outlook. Let’s look at an example of what a top-down analysis approach might look like using the GBPUSD currency pair. We will combine elements of both technical and fundamental analysis into our overall outlook for this example.
We’ll start our top down analysis by comparing the multi-quarter GDP (Gross Domestic Product) data for both the United Kingdom and the United States. We find that the UK has been consistently meeting or exceeding economists’ expectations for quarterly GDP in the last year. At the same time, the United States has been regularly falling short of economists’ expectation for its GDP growth figures.
Based on this GDP data, we may surmise that the British Pound should continue in its current trajectory, which should result in continued strength of the British Pound to US dollar exchange rate.
As we pull up a weekly price chart of the GBPUSD currency pair we find that the price is trading above its 50 period simple moving average line, suggesting that the weekly trend is also up. And so, as we scale down to the lower timeframe chart, we will make sure to only take set ups that align with this longer-term market trend. In other words, will be seeking opportunities to go long, and bypass any shorting opportunities.
Now we are reviewing our trading timeframe which is the daily chart. We recognize a pennant chart pattern forming within the context of the larger uptrend. The pennant formation is retracing a portion of its previous bullish leg.
Being proficient in technical analysis, we know that a confirmed breakout from a pennant formation will likely lead to a new leg in the direction of the current trend, which in this case is up. As such, we prepare for an upside breakout from this chart structure, and will go long the GBPUSD pair as soon as that event occurs.
Notice how this top-down analysis example starts with a longer-term fundamental analysis using multi-quarter GDP figures, and then scaling down to a weekly price trend analysis using the 50 period moving average study.
As both of these analysis techniques presented us with a bullish scenario, we were able to spot a bullish continuation pattern in the form of a pennant on the daily chart and use that as our long entry setup signal.
Forex Market Structure Analysis
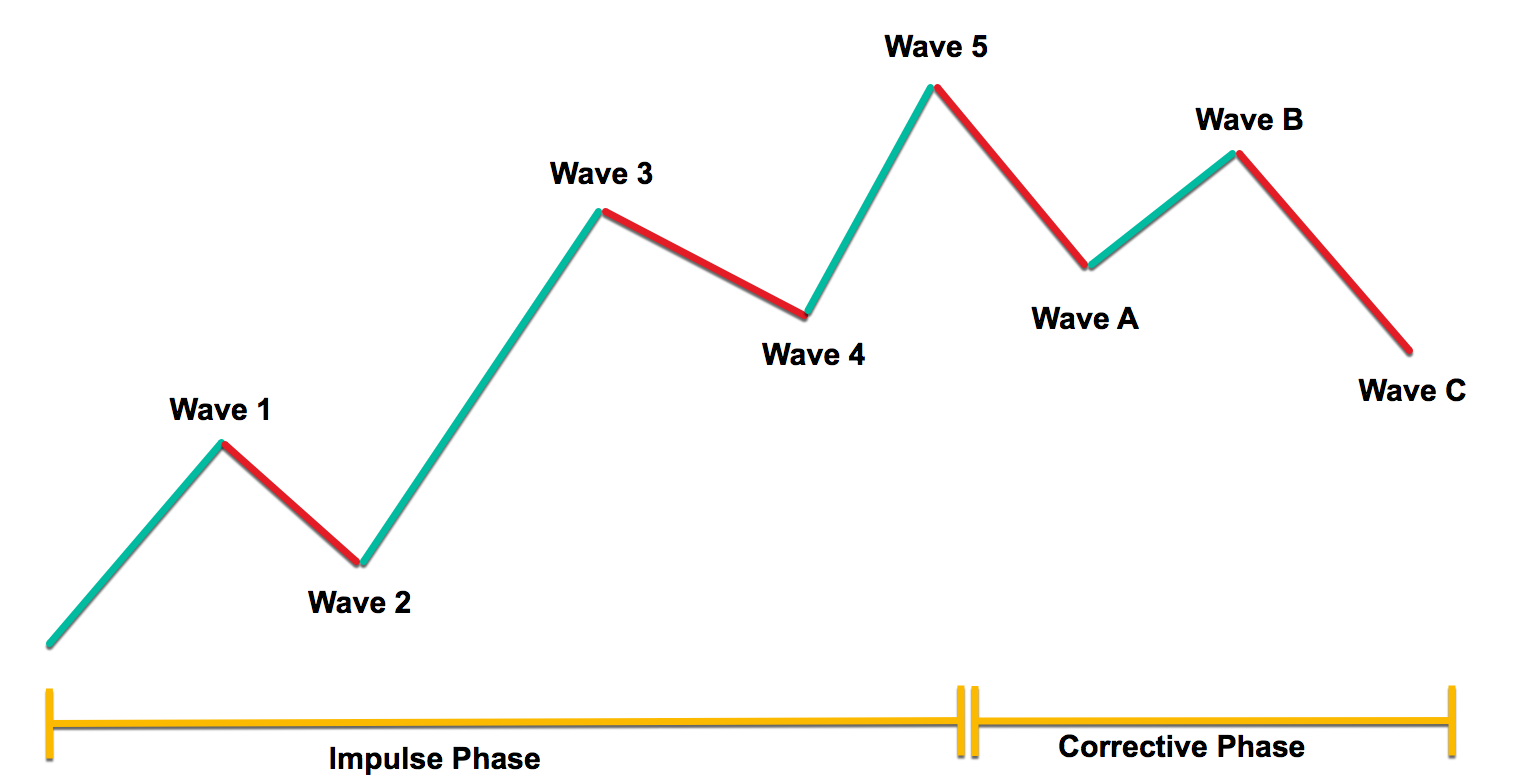
Having a solid understanding of the overall structure of the markets is essential to price forecasting. Some of the best methods for analyzing market structure include the Dow theory and Elliott wave theory. Both of these theories are related and help traders to understand the underlying structure of the markets. Many of the concepts within the Elliott wave principle are built upon the original findings within the Dow theory.
The key concept within the Dow theory states that markets move in recognizable trends and can be characterized as primary, secondary, or minor. Additionally, the basic form seen within the market consists of a three phase upward price movement interrupted by two countertrend price moves.
And similarly, within the context of a downtrend the market moves within three distinct down legs interrupted by two countertrend price moves. The Elliott wave theory expands on this market structure hypotheses in much greater detail.
Based on the Elliott wave model, markets move in waves that can be characterized as motive or corrective. Motive waves move in the direction of the larger trend, while correcting waves move counter to the larger trend. The two types of motive waves include the impulse and the diagonal structures. And the primary corrective wave structures include the zigzag, flat, triangle, and double and triple combinations.
Elliott wave analysis provides us a framework for price movements in the market. The financial markets have fractal characteristics, meaning that they contain self-similar patterns that occur at all degrees of trend. Although it is outside the scope of this lesson to detail all of the essential elements of market structure analysis using Elliott wave, it is important that traders at least have some basic understanding of the wave theory.
Below is an illustration of the structure of the markets based on the Elliott Wave theory.
Forex Price Action Analysis
FX price action analysis is a specific branch within technical analysis. Price action analysis incorporates things such as support and resistance, candlestick analysis, and chart patterns. It relies on the price itself as a primary means by which to analyze market behavior. Some price action traders will incorporate technical indicators into their strategy, while other price action traders rely exclusively on naked chart analysis.
Below are the three primary types of price action analysis.
Support and Resistance Analysis – Support and resistance is one of the most basic yet useful aspects of a price action analysis methodology. Support and resistance can come in many forms, some of which are purely price based, while others have a price and time component to them.
For example a key horizontal level above the current price would be considered a price based resistance level. A diagonal trendline drawn off of minor swing highs within the context of a downtrend would be considered a resistance line and can provide value with respect to price and time.
Candlestick Patterns – Candlestick patterns can provide insights into short-term price movements. Forex candlestick analysis takes into account single, double, and triple candle structures. There are dozens of very specific alignments within candle structures that can provide traders with clues into potential reversal or continuation points.
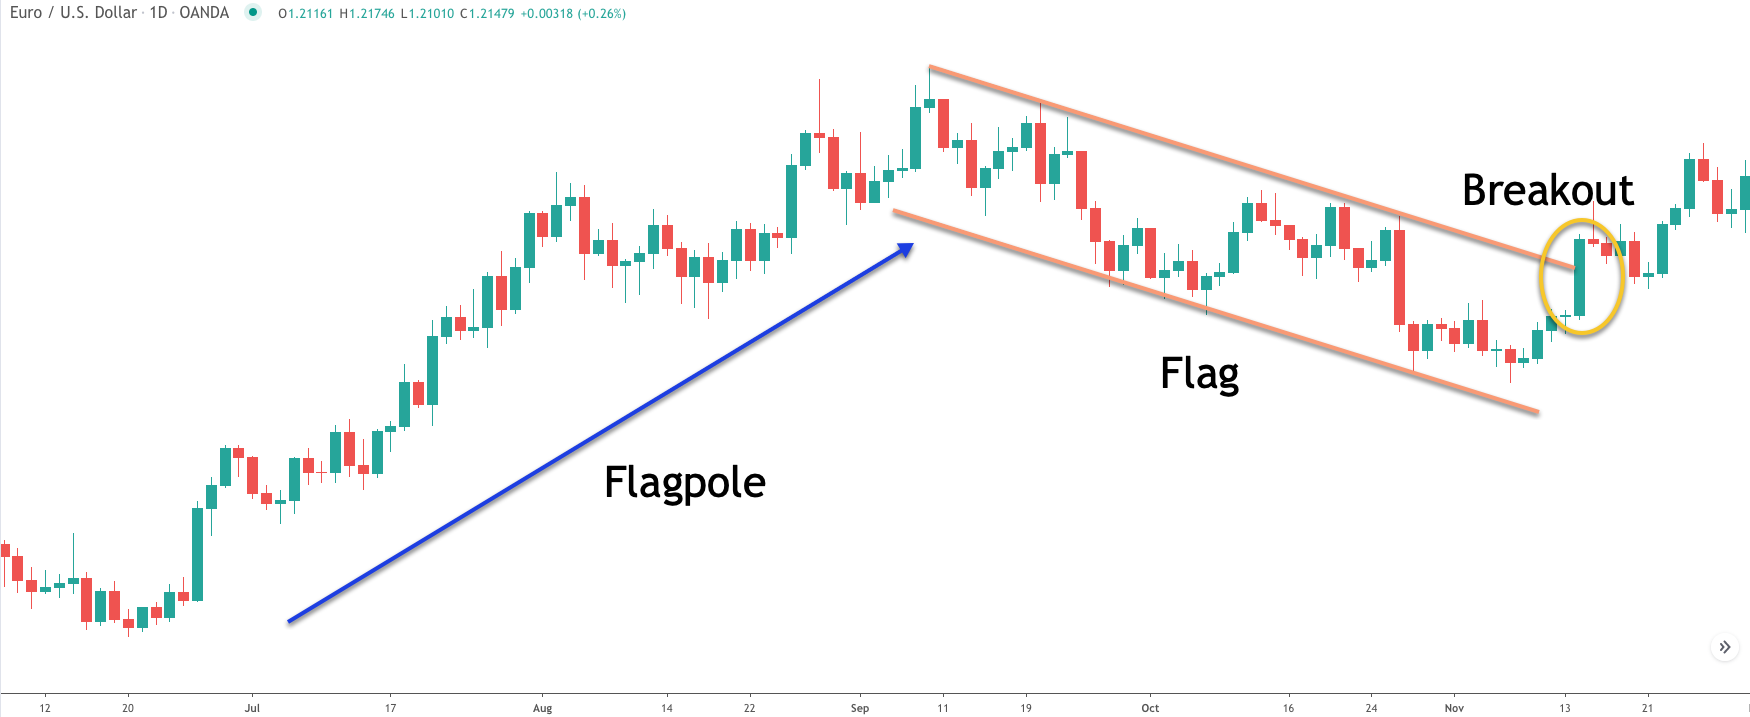
Chart Patterns – Chart pattern analysis can come in several different forms. The oldest and most recognized form of chart analysis includes classical structures such as pennants, flags, diamonds, head and shoulders, double tops and bottoms, and more. Additionally harmonic chart patterns have become increasingly popular over the more recent years. Harmonic chart patterns include structures such as the Cypher, Bat, AB=CD, Gartley, and more.
Below is an example of the flag chart pattern.
Forex Economic Analysis
Forex fundamental analysis seeks to understand the major underlying factors within an economy or region in an effort to determine its impact on the exchange rates of related currencies. This is an area of market analysis that often requires in-depth knowledge of the economic inner workings of specific countries.
Although you do not necessarily need a master’s degree or PhD in Economics to do the required research into economic trends, it nevertheless, helps to have a solid foundation in economic theory and analysis to make this approach a viable one.
Some of the major economic reports that fundamental analysts study include employment reports such as the US NFP report, inflation reports such as the Consumer Price Index, interest rate decisions by major central banks such as the US Federal Reserve or Bank of England, and economic activity and growth reports such as the Gross Domestic Product.
These are just a few of the data releases that currency analysts focus on. If you are interested in this area of analysis, you will be glad to hear that there are a myriad of forex analysis sites that dive deeply into the subject of macro-economic data and its impact on the currency markets.
Economic data reports are usually released on a monthly or quarterly basis. As such, a forex analyst has sufficient time to dissect these reports to arrive at longer-term market biases. They can be quite valuable for macroeconomic position traders and others who have a longer-term focus in their trading and investments.
Aside from short-term news traders who look to trade around high impact reports, this type of analytical method is not particularly well-suited for shorter-term and intermediate-term forex traders. This is because market timing becomes much more important at the relatively shorter timescales. And for those that rely on market timing, a technical analysis approach tends to offer a better alternative to traditional economic analysis.
Now that is not to say that a technical analyst should not use fundamental or economic data as part of their trading program. Instead, the point is that a purely fundamental approach applied to the shorter time horizons will leave a lot to be desired.
COT Analysis In Forex
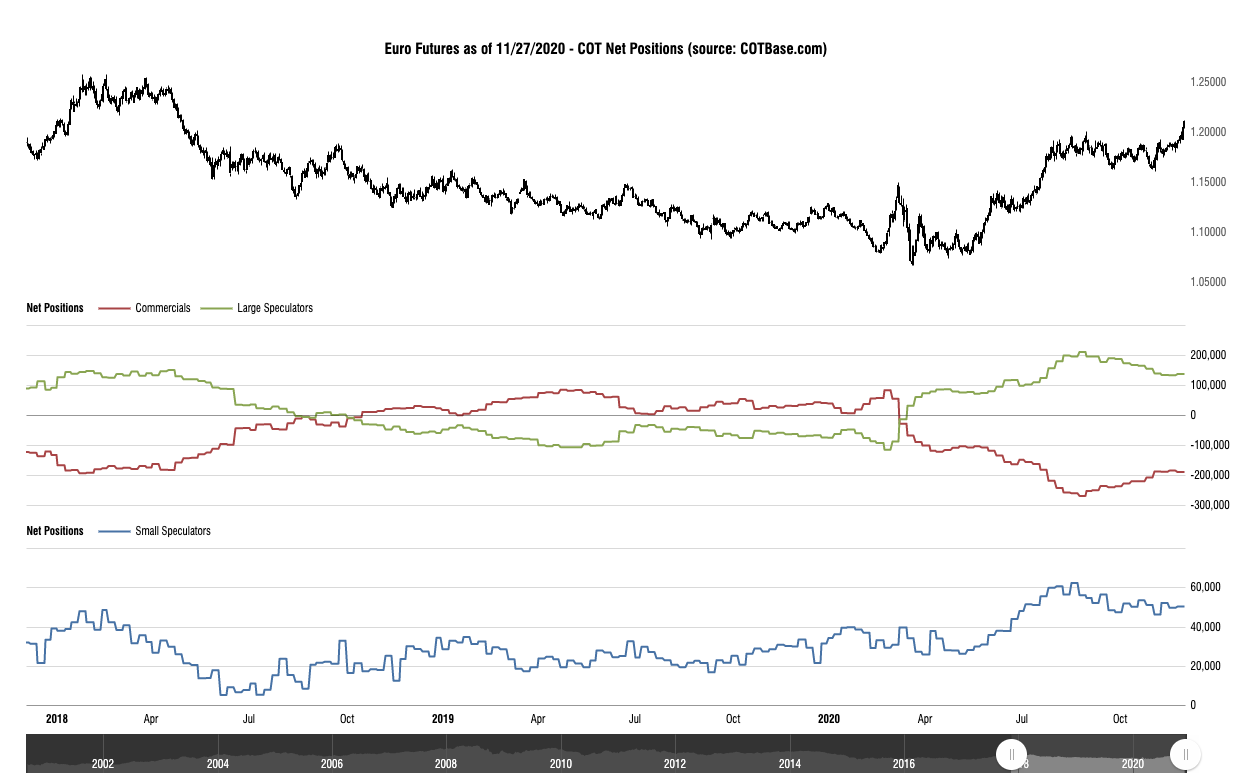
A lesser known forex analytical technique involves the use of weekly COT data. COT is short for Commitment of Traders, which is a weekly report issued by the Commodity Futures Trading Commission, also known as the CFTC.
This is a valuable sentiment based report that provides details on the positioning of various groups of traders. The three primary groups include the commercial traders, non-commercial traders, and non-reportable traders.
The commercial traders are typically large manufacturers who engage in the market for hedging purposes. The second group called the noncommercial traders are comprised mostly of large speculators such as hedge funds, and commodity trading advisors. And thirdly, the non-reportable traders represents the small speculator group of traders whose trading activities are relatively small in relation to the other two groups.
Now it’s important to note that the COT data is based on the activity within the US futures market. Nevertheless this data can be extremely valuable to spot Forex traders as well since there is a high level of correlation between both types of markets.
So now that we understand what the COT report is, what significance does it hold and how can it help in anticipating future price movements of a currency pair? Well, if we knew how the smartest traders are positioning themselves in the market, and whether that represents any major deviation from their historical norms, wouldn’t that be valuable information that we can use in our own trading?
The commercials are considered the “Smart money” and they are typically on the right side of the market at major turning points. The large speculator class of traders are mostly trend followers, and as such, will be on the right side the market during a trend. Lastly, the non-reportables are the small speculators, which are considered the “dumb money” and are usually wrong most of the time.
As such, a thorough COT analysis can help us to understand the positioning of major groups of market participants at different stages of the market cycle.
Below is an example of the COT chart for the Euro futures contract. The red line represents the net positions of commercials, the green line represents the net positions of large speculators, and the lower blue line represents the net positions of small speculators.
Volume Analysis In Forex
Unlike the futures and equities markets, the foreign exchange market does not have a centralized exchange. As such it is difficult to gauge the total volume within a specific currency pair. Forex traders that rely on volume analysis to support their trading decisions must come up with creative ideas for tracking volume figures.
One way that spot Forex traders evaluate volume figures is by using the volume data within the currency futures market as a proxy. For example, if based on your forex analysis, you are interested in going long the EURUSD currency pair and would like to get a sense of the volume data over the last week or so, you could turn to the Euro futures instrument, 6E, which is traded at the CME, the Chicago Mercantile Exchange.
Alternatively, many Forex brokers provide volume figures based on their own internal data from their user base. This is a viable option, especially if you trading with a global Forex broker with a large client base. The volume figures provided by these types of global FX brokers will be more useful because they can represent trading activity of a relatively large group of traders.
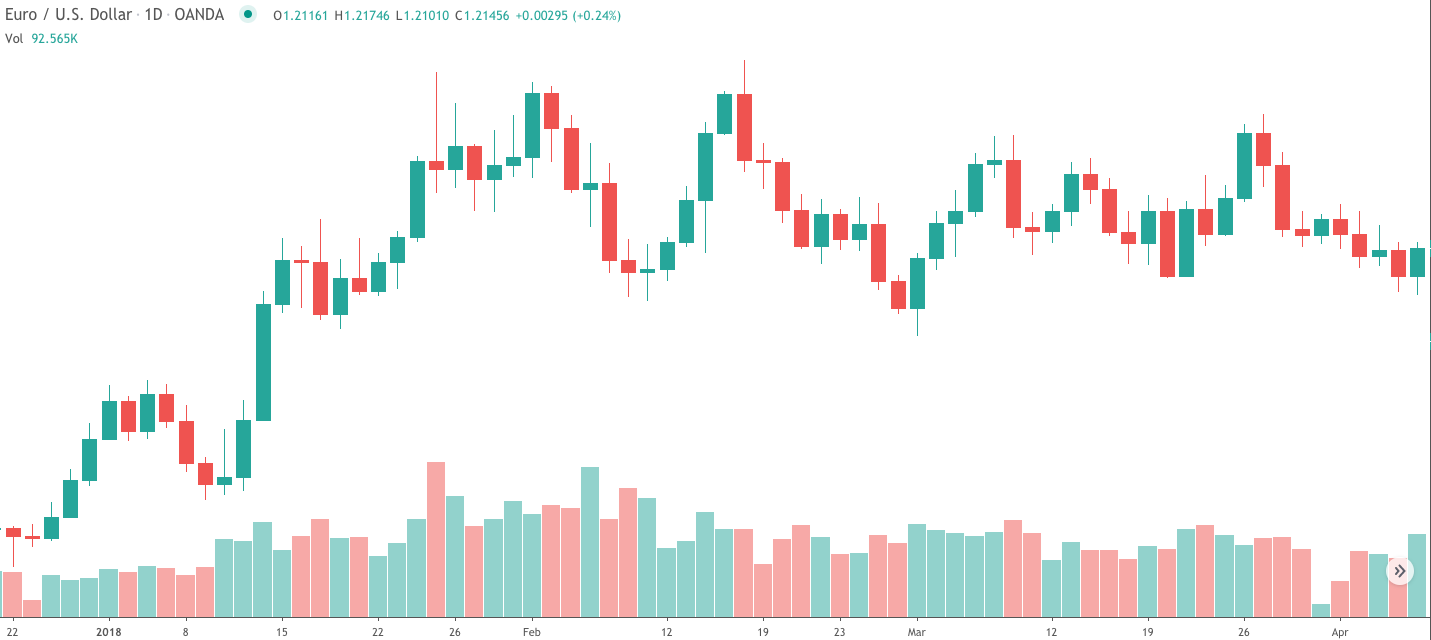
Below will find the chart of EURUSD with volume data below the price. The volume data is provided by the forex broker, Oanda.
Last but not least there are certain technical indicators that can be used to analyze large institutional activity such as accumulation and distribution phases. One such indicator that provides such insight is the Chaikin Money Flow indicator, which was developed by Marc Chaikin. By studying the different readings within this indicator, traders can determine when it might be best to enter a trade, exit a trade, or stand on the sidelines.
Summary
Performing the required Forex research and analysis is integral to achieving consistency as a trader. Much of your overall success in trading will be dependent upon your level of expertise in market analysis. And as such, you should take as much as time as possible to study the different Forex market analysis methodologies.
Whether you find yourself most comfortable with a technical based approach, or a fundamental based approach, it’s imperative that you have a clearly thought out process detailed within your trading plan for executing trades in the market. Once you have a robust model for analyzing the market and the discipline to follow through on the signals that it provides, you may likely be on your way to reaching your goals in the market.