Fractals can be seen all around us in both the natural environment, and the financial markets. Here we introduce the concept of fractals, and their practical applications in the world of trading. You will learn how to recognize the core fractal pattern on the price chart, and how to combine it with specific technical tools to build a cohesive trading strategy.
What Is A Fractal?
Fractals are self-similar patterns that repeat at various degrees of scale. The fractal was discovered in 1975 by Benoit Mandelbrot, who was a famous mathematician that worked at IBM. A fractal can be thought of as irregular geometric shapes that have recursive properties, and can continue on into infinity.
We can see examples of fractals all around us in the natural world. For example, trees, seashells, fern leafs, sunflowers, and even galaxies have fractal characteristics. Fractals cannot be explained through traditional Euclidean models. That is to say that the irregularities within fractal structures cannot be measured through linear mathematical models. Let’s look at an example of a fractal in our natural universe. Below you will find an image of a tree.

Notice how each of the branches starting from trunk of the tree branches out into smaller and smaller extensions. Each extension or branch is similar in appearance to its larger structure. Notice the recursive process as bigger branches lead to smaller and smaller branches that are similar in their appearance.
What about another example? Take a look at the fern leaf below. Can you see how each leaf consists of many other smaller leaves? Additionally note how each smaller leaf has similar visual characteristics to its larger leaf.
They are similar in shape and appearance, however, they represent different scales within the larger fern leaf. The bigger leaves lead to smaller leaves, which in turn lead to even smaller leaves. All of which have self-similar characteristics at smaller and smaller scales.

Fractal Geometry In The Markets
The financial markets operate within the fractal framework. If you view a chart on a five minute timeframe, hourly timeframe, daily timeframe, or weekly timeframe, you would not be able to distinguish one from the other. That is to say that the price action on the charts have fractal characteristics in that we can see self-similar patterns at various time frequencies.
Fractal market theory provides an explanation of market movements through the lens of fractal geometry. In short, it provides for an insight into the financial markets as consisting of recursive geometric patterns that occur at the largest degree of trend down to the most minute degree of trend.
This is in alignment with the tenants of technical analysis, which says that, all public market information is digested within the price action. And as such, the best form of market analysis relies on a thorough understanding of repeating price patterns that form across all markets and time frames. The essential concept is that price movements within freely traded liquid markets form patterns that do repeat themselves in a continuous manner.
Now although there is an obvious cyclical nature to the market, the periodicity and amplitude seen within price structures can vary significantly. This makes market analysis based on a fractal application somewhat challenging, yet not completely elusive. The trained analyst can, through a thorough study of price action patterns, cycles, and chaos theory, gain a deeper understanding and edge as it relates to trading the markets.
Fractal market analysis seeks to uncover and exploit the apparently random nature of price movements for the benefit of financial speculation. So in a sense, the market must be viewed as a non-linear system wherein there is a higher hidden order that is disguised within seemingly random market movements.
Anatomy of Market Fractals
Let’s now begin to move from theory to practical application. Much of the practical applications of market fractals have been developed and popularized by Bill Williams. He is a leading expert on market fractals and chaos theory. He is the author of the book entitled “Trading Chaos”, in which he details the fractal formation. At the very core, a market fractal is the basic building block of price movements up and down within the market. Let’s take a look at the up and down fractal formations.
A fractal is comprised of five bars. In an up fractal the middle bar will have a higher high than both of the bars at either side of it. And similarly, in a down fractal the middle bar will have a lower low then both of the bars at either side of it. Below you can see the structure of both the up and down fractal. Up fractals are also referred to as bearish fractals, and down fractals are also referred to as bullish fractals. They are referred to as such because an up fractal has a bearish implication, while a down fractal has a bullish implication.
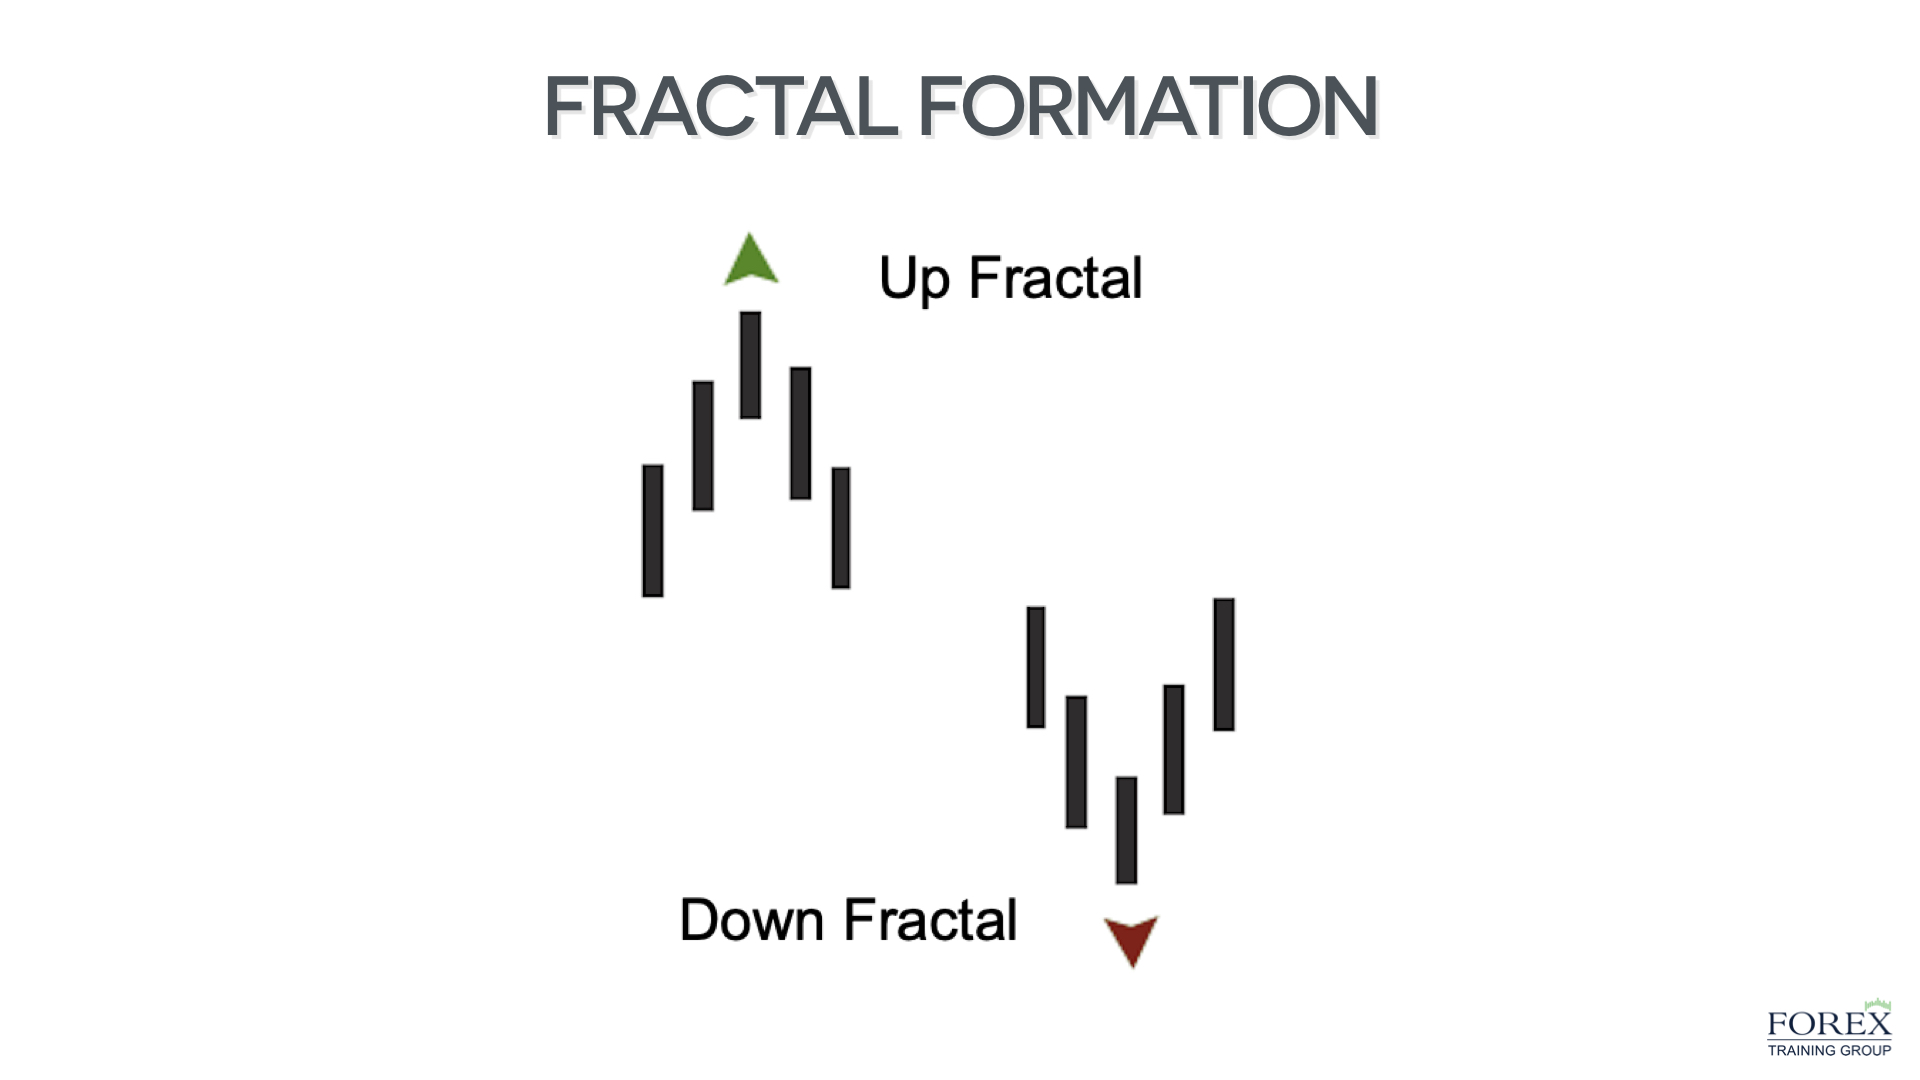
Notice on the illustration above how the middle bar within the up fractal has the highest high of the entire five bar structure, and how each of the two bars preceding it and following it have a lower high. This creates a level of resistance in the market, and the expectation is for price to continue lower until the next down fractal forms in the market.
On the flipside if you refer to the middle bar within the down fractal, you can see that it has the lowest low of the entire five bar structure, and that each of the two bars immediately before and after it have a higher low. This creates a level of support in the market and an expectation for price to move higher until the next up fractal forms in the price action.
As you can see, the structure and implications of the market fractals are fairly simple to understand. We can build many different trading rules and models around the concept of fractals which can aid us in our decision-making process.
These days, most trading applications will include the fractal indicator as described above, as a default study within their indicator library. As a result, you can simply apply the fractal indicator to your charts. This should automatically print a notation upon each fractal completion. Most fractal indicators will mark the middle bar of the fractal trading pattern upon the completion of the fifth and final bar within the fractal structure.
How To Trade Fractals
You should now have a pretty good understanding of the theory behind fractals and the actual fractal formation as seen on the price chart. There are a number of ways that we can utilize the fractal indicator within our overall trading program. We will be diving into a fractal based trading strategy in the later section, however for now, we just want to outline some of the primary ways that the fractal indicator can be applied.
The fractal indicator can help gauge the potential direction of a price move. For example, if a down fractal has recently printed on the price chart and the overall trend is higher, then we can expect with a reasonable amount of confidence that the price is more likely to continue higher. Along the same lines, if an up fractal has recently been breached by a new price leg that is moving higher, that upside breakout can indicate that there may be continued price momentum higher.
Another practical application of the fractal indicator is to utilize it for the construction of trendlines and parallel channels. Most technical analysts do not have any clear rules for the construction of diagonal support and resistance lines. Instead, they typically utilize very loose guidelines when drawing trendlines and channels. This can create a very haphazard process that lacks any clear edge. Fractal indicators are excellent for drawing objective trendlines based on market derived support and resistance levels.
The same can be said for drawing channels as well. For example, you could draw a bullish trend line sloping upwards by connecting the down fractals below the price action. And similarly, you can draw a clear bearish trend line sloping downwards by connecting the up fractals above the price action. This eliminates most of the discretion surrounding trendline analysis, and more importantly, it allows you to plot the most relevant diagonal support and resistance levels.
Fractals can also be used during the trade management process. We know that an up fractal can serve as resistance during a rising market, and that a down fractal can serve as support during a declining market. As such, we can use these important market derived levels for the placement of stoploss orders or take profit orders. These are just a few applications of the fractal indicator, but they should certainly give you some ideas that you can start thinking about.
William’s Alligator Indicator
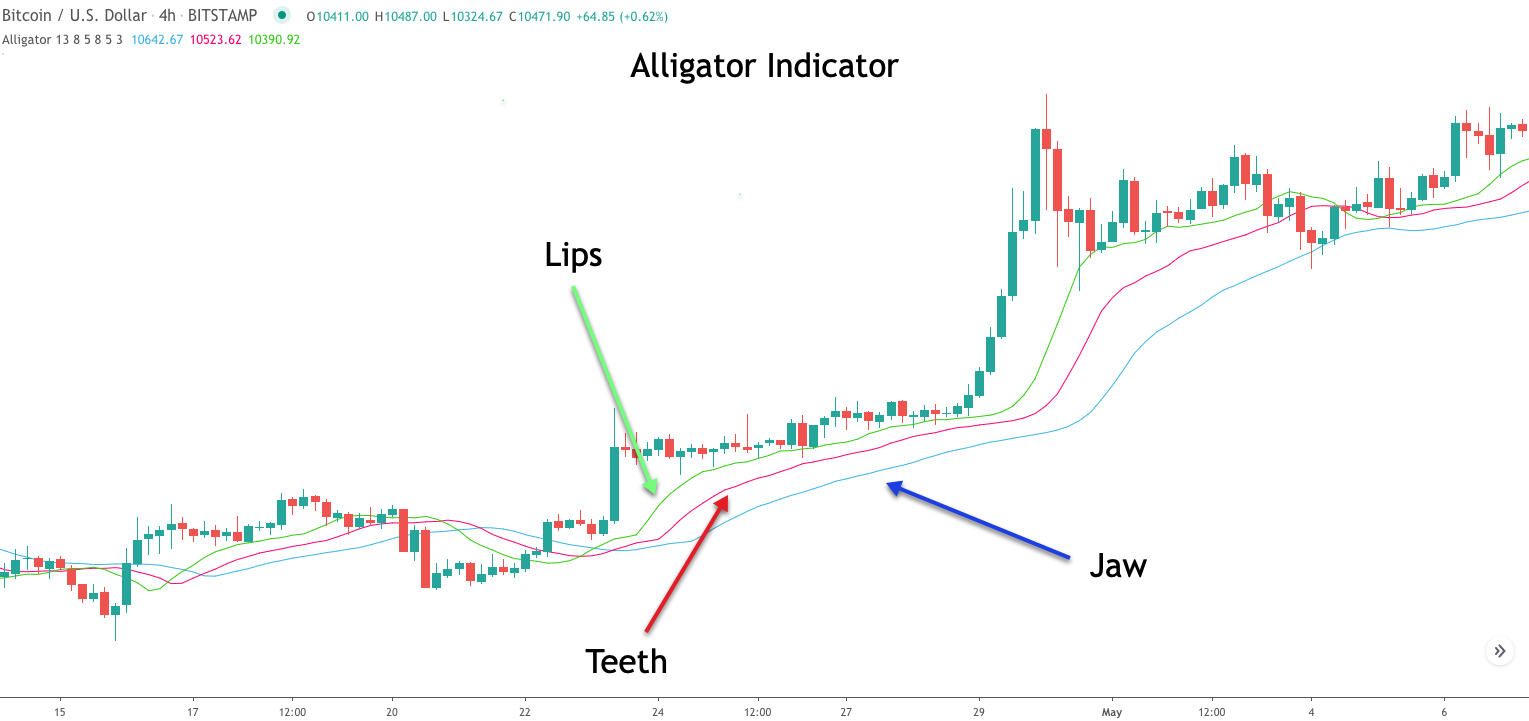
The alligator indicator is a complementary study that works well when combined with the fractal indicator. The alligator indicator was also created by Bill Williams. Essentially, it is comprised of three lines, called the jaw, teeth, and lips. It helps in the identification of a trend, and the potential future movement of price. Let’s take a closer look at the construction of the alligator indicator.
The formula for the alligator indicator:
The alligator’s jaw, which is typically shown as a blue line, is a 13 period smoothed moving average that is displaced forward by eight bars.
The alligator’s teeth, which is typically shown as a red line, is an eight period smoothed moving average that is displaced forward by five bars.
The alligator’s lips, which is typically shown as a green line, is a five period smoothed moving average that is displaced forward by three bars.
Below you will find a chart with the alligator indicator overlaid on the price action.
There are a few different methods for trading using fractals and the alligator indicator. However, the primary purpose in utilizing it is to maximize the profits realized in a trade by staying in a winning position for as long as the market is in alignment.
It is essentially a trend following indicator based on a triple moving average. The alligator indicator helps us to decipher between trending and non-trending market conditions, and take advantage of price moves that are on the verge of a potential trend.
When the three lines within the alligator indicator began to converge and tighten, that provides a base from which a new trend leg is likely to emerge. When this convergence scenario occurs, the alligator is said to be in a sleeping mode, wherein there is an absence of any clear trend.
Now when the lines began to separate or diverge, the alligator is said to be awakening, which is to say that a new trend leg may be in the works. Finally, the feasting phase of the alligator coincides with the continuation of the trend move, as prices are moving sharply higher or lower after the basing activity.
Traders can use a host of different technical studies in concert with the alligator indicator. Combining other non-correlated technical tools will typically help improve the overall strategy and make it more robust as well.
Fractal Trading Strategy
Now that we have a solid understanding of both the fractal indicator and the alligator lines, we can now move forward to describe a trading strategy based on these two technical studies.
The primary goal of our trading strategy will be to attempt to capture a price move following a period of relative calm. We will define the period of relative calm using the alligator indicator. Remember, that when the three lines within the alligator indicator are converging or narrowing, that is an indication of price consolidation.
Once volatility begins to pick up, we will begin to prepare to execute on the potential set up. We will also clearly define the volatility expansion with the alligator indicator. Specifically, we will watch for the alligator to awaken, meaning that the triple moving averages began to diverge from the basing price action.
We will want the line referred to as the lips to cross the other two lines. Keep in mind that the line that represents the lips is the shortest smooth moving average. You want to keep a close eye on the last few up fractals in the case of a long signal, and similarly on the last few down fractals in the case of a short signal. The fractal breakout from one of these relevant fractal patterns will serve as the entry signal.
Let’s now detail the trading rules associated with this fractal trading system.
Rules for entering and managing a long trade set up:
- The alligator indicator lines have recently been tight and narrow, suggesting a market pause.
- The lips of the alligator, which is typically the green line, crosses above the other two lines. The alligator indicator lines begin to diverge, indicating a potential price move.
- Locate the most relevant recent up fractal. When a candle crosses above and closes above the high of this fractal, it will serve as the entry trigger.
- Stop loss to be placed at the most recent down fractal preceding the entry signal.
- The lips of the alligator, which again is the green line, will serve as the exit signal. Specifically, when this line crosses below either of the other two lines, that will serve as a signal to exit the trade.
Rules for entering and managing a short trade set up:
- The alligator indicator lines have recently been tight and narrow, suggesting a market pause.
- The lips of the alligator, which is typically the green line, crosses below the other two lines. The alligator indicator lines begin to diverge, indicating a potential price move.
- Locate the most relevant recent down fractal. When a candle crosses below and closes below the low of this fractal, it will serve as the entry trigger.
- Stop loss to be placed at the most recent up fractal preceding the entry signal.
- The lips of the alligator, which again is the green line, will serve as the exit signal. Specifically, when this line crosses above either of the other two lines, that will serve as a signal to exit the trade.
Fractal Alligator Strategy – Bullish Example
Now let’s demonstrate what the fractal alligator system looks like on the price chart. We’ll start with a bullish example. If you refer to the price chart below you will find the price action for the New Zealand Dollar to Canadian dollar forex pair based on the daily timeframe.
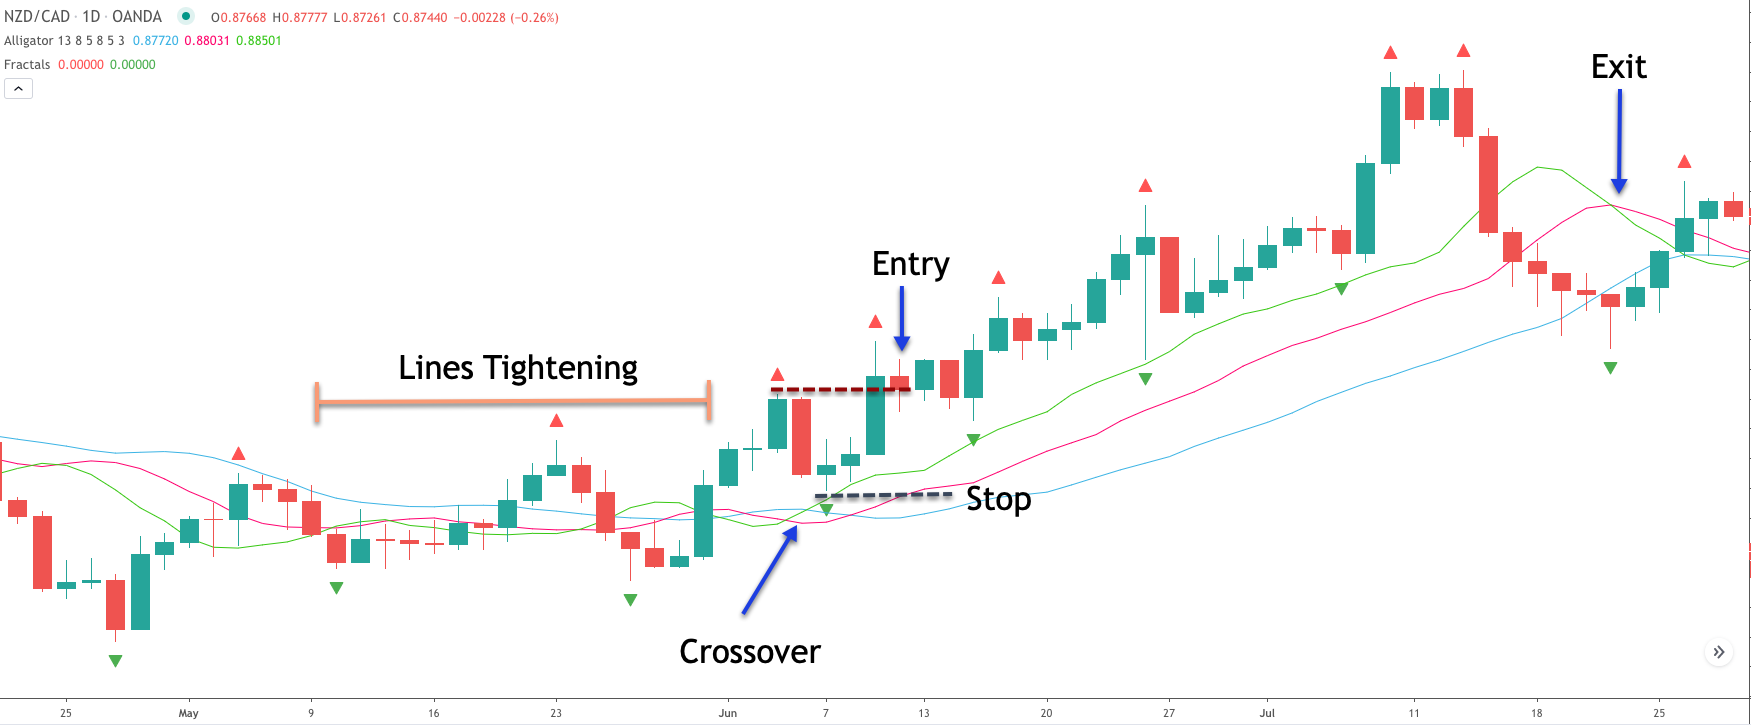
Notice on the chart above you will find the alligator indicator overlaid on the price. The fastest line, which is referred to as the lips of the alligator is shown in green. The slowest line, which is referred to as the jaw of the alligator is shown in blue. And the teeth of the alligator is represented by the red line.
Starting from the far left of the price chart, you will notice that the lines begin to converge and overlap, creating a tight congested appearance. This tells us that the market is in a sleeping mode, which could result in a volatility expansion at some point.
We have noted where the upside crossover occurs, and can see that the lines began to diverge from that point onwards. Now, the actual entry signal would occur upon a breakout and close above a relevant nearby up fractal formation. That specific up fractal that we would want to use as our breakout signal is noted with the maroon dashed line. A close above this level would provide confirmation for the buy signal based on this trade strategy.
Shortly after the formation of the up fractal noted, the price began to rise and eventually broke above and closed above the high of that up fractal. A market order to buy would be initiated at the start of the following candle, which is noted on the chart as the entry point.
Based on the rules of this forex fractal trading strategy, the stoploss would be placed below the nearest down fractal preceding the entry signal. You can see that stoploss noted, and is placed accordingly, under the candle that appears to be a doji candlestick formation.
Now that we have protected the position with a stoploss, we will need to monitor the price action closely to execute the exit as the price moves in our favor in the bullish direction. The exit signal here would be the cross of the green line, the lips of the alligator, below either of the other two lines.
Fractal Alligator Strategy – Bearish Example
Let’s now take a look at a bearish example of this fractal alligator trading strategy. The chart below is for Bitcoin based on the daily timeframe.
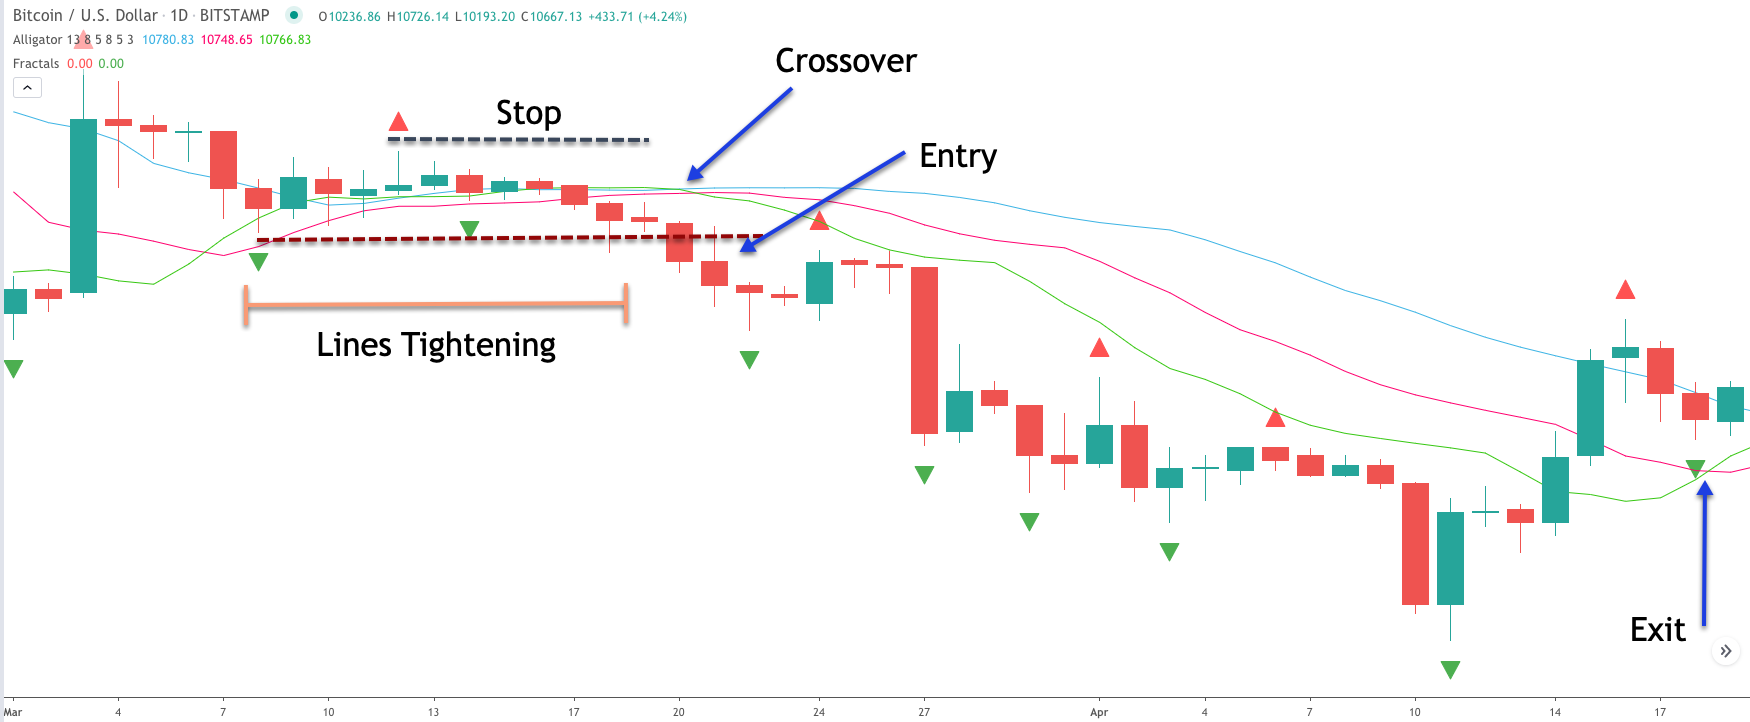
Starting from the far left of the screen, we can see that the three lines that make up the alligator indicator began to converge and narrow. At the same time the price action is becoming compressed, building up energy for the next price move.
The alligator indicator is quite useful in finding market conditions that are displaying this type of congestive price behavior. We know that the markets are cyclical in nature, and that low volatility periods are followed by high volatility, and vice versa. As such, we should expect the price to begin a new trend leg following the tight consolidation phase.
The next step would be to wait for the green line, the lips, to cross below both the red and blue lines, which represent the teeth and jaw of the alligator respectively. That crossover event is noted on the price chart. From here, we’ll want to mark a support level that coincides with the low of the most relevant down fractal. That specific fractal low has been marked with the dashed maroon line. This will serve as the short entry trigger for this trade set up.
Shortly after the crossover to the downside, we can see that a bearish candle penetrated below the low of that down fractal and managed to close below it as well. A market order to sell would be initiated at the start of the following bar. You can see where that sell order would occur by referring to the blue arrow labeled as Entry.
The stoploss placement is also determined by a nearby fractal. In this particular case, we will refer to the closest up fractal that forms preceding the entry signal. If you scroll to the left side of the chart from the entry point, you can find a shooting star candlestick which serves as the relevant fractal that we would need to use for our stop placement.
Finally, we need an exit plan if the price continues to moves lower in our intended direction. Per our rules, the exit will be executed when the green line, the lips of the alligator, crosses above either of the other two lines within the alligator indicator. If you scroll to the right side of the chart, you will see where that cross occurs, taking us out of the position.
Summary
Fractals are the basic building blocks of market movements. Once you understand the mechanics of fractal formations, you will gain a much better appreciation for technical based market analysis. These simple but robust patterns are the basis for virtually all turning points in the market. Although fractals are simplistic in their design, they are extremely versatile in their application.
Fractal trading techniques can be incorporated within various components of a strategy. Those interested in the complexities of price behavior both from the theoretical and practical perspective are encouraged to study the concept of fractals on a deeper level.