There are literally dozens, if not hundreds of ways to trade the forex market. We have discussed some of these technical trading methods in our articles. Today, we will go through a specific set of Forex trading tools formulated by W.D Gann, many of which are based heavily on geometric angles. We will discuss several important Gann indicators and its application in financial markets forecasting.
What is the Gann Theory?
The Gann theory is based on the work of W.D Gann who was a financial trader that lived from 1878-1955.
Interestingly enough, another notable technical analyst, named R.N Elliott, also lived around the same time, and was busy with his own intensive research in the market, which later came to be known as the Elliott Wave Theory.
Gann relied on geometrical approaches to track price moves in the financial markets. The theory relies on geometric angles, and ancient mathematics to predict price movements.
Gann analysts believe that price moves occur in predictable geometric cycles. And the resulting angles created thru this price action act as support or resistance on the price chart. It is important to mention that the Gann parameters are better when applied on bigger time frames. The Gann set of indicators provides higher accuracy in the longer term.
The Importance of 45% Trends
W.D. Gann suggested that a trend which has a 45 degrees’ inclination, is sustainable and will last longer.
In this manner, the default Gann trading application suggests that 45 degrees’ trend lines is the most important reference point from which other Gann trading tools should be analyzed.
However, this doesn’t mean that Gann analysis cannot be performed on other types of trends. But essentially, when the Gann indicators are applied to forty-five degree trends, they are considered the most accurate.
Main Gann Indicators
There are several Gann trading tools, however the most popular are the Gann Fan and the Gann Grid. Let’s now go through each of these two trading applications:
Gann Fan
The most popular Gann indicator is the Gann Fan. This drawing tool is based on a series of diagonal trend lines, which are inclined or declined at different angles.
To build the Gann Fan you would start by spotting a trend. Draw the angled trend line and the drawing tool will populate the various angled lines which could act as future support and resistance areas.
The Gann Fan tool consists of 9 diagonal lines – a middle line and 4 lines on each side of the middle line. If the Gann Fan is applied on a 45 degrees trend, the default parameters of the indicator are going to be as follows:
8×1 = 7.1 degrees
4×1 = 15 degrees
3×1 = 18.75 degrees
2×1 = 26.25 degrees
1×1 = 45 degrees
1×2 = 65.75 degrees
1×3 = 71.25 degrees
1×4 = 75 degrees
1×8 = 82.5 degrees
Since this may be hard to visualize in your head, we have prepared an image for you, which shows the Gann Fan placed on a 45 degrees’ bearish trend.
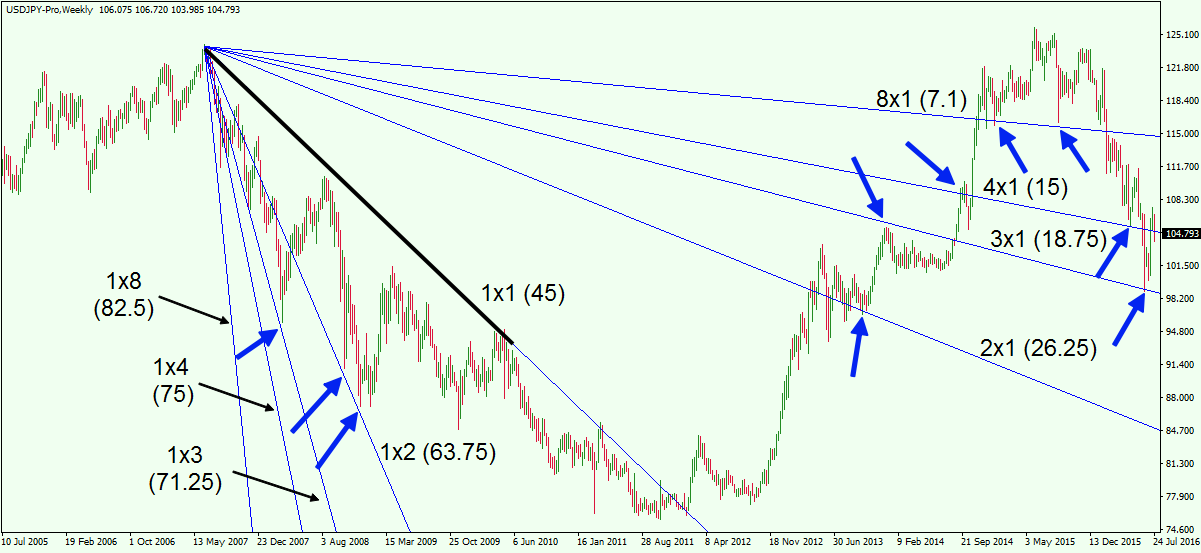
This is the weekly chart of the USD/JPY. The black line on the chart depicts the bearish trend, which we use to place the main 1×1 Gann angle. The other levels of the indicator appear automatically. These are shown as the blue lines on the chart. The blue arrows point out the places where the price action of the USD/JPY conforms to the Gann levels.
As such, the blue arrows show the support/resistance functions of this indicator. However, the price also creates breakouts through the Gann lines, so when you spot a Gann fan breakout, you should expect the price to continue further to the next level. As you see, this happens quite often on the image above.
Gann Grid
The next indicator we will discuss is the Gann Grid. This trading indicator illustrates a sort of “net” effect on the chart and the levels in the grid can have support/resistance functions.
To apply the Gann Grid on the chart you should pick two points on the chart which you use as a base for the drawing tool. Then you stretch the indicator based on these points and the rest appears by itself.
When you apply the Gann Grid successfully, this is what you should see on the chart:
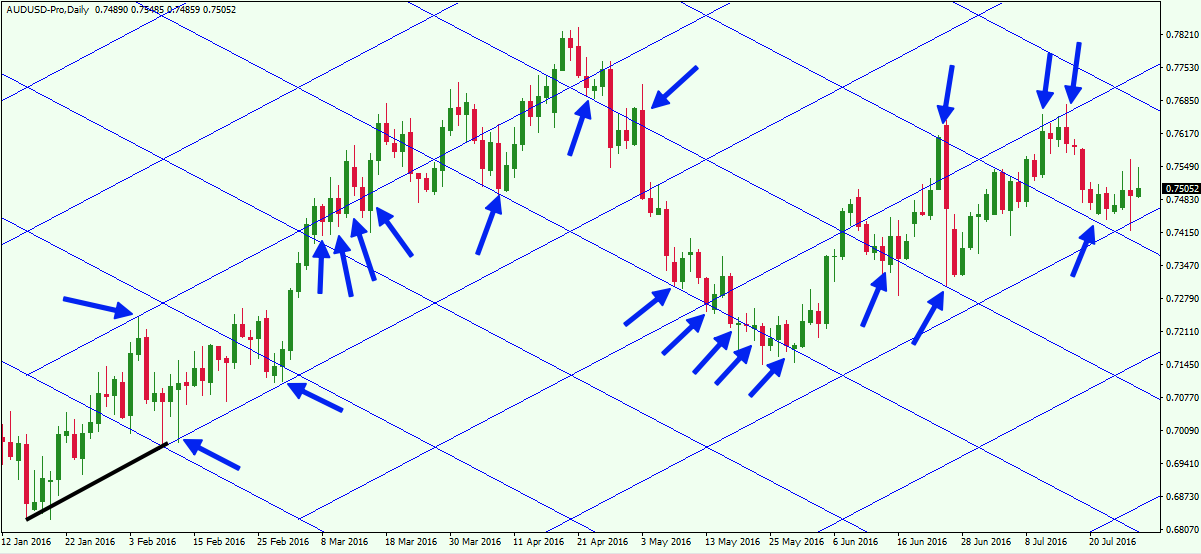
Above you see the daily chart of the AUD/USD. The image illustrates the way the Gann Grid indicator works. The thick black line is the base movement we take for our grid. At the beginning and the end of the plotted black line, we have the two bottoms that form the base. As you see, the size of the black line equals the size of each side in the blue rectangles. The blue arrows on the chart indicate the moments when the price action finds support/resistance within the Gann Grid. As you see, the price action interacts with the gird in a similar way as illustrated earlier with the Gann Fan. We also have breakouts in the levels, which can signal potential price moves in the direction of the breakout.
Gann Trading Strategies
Now that you are familiar with the way the Gann Fan and the Gann Grid work, we will now proceed with discussing potential trading strategies using each of these tools.
Gann Fan Trading Strategy
The first Gann trading method we will discuss revolves around the fan. We will go through setting entry and exit points on the chart based on Gann Fan signals. Also, we will implement some rules around how you can manage your stop loss when trading with the Gann fan.
Gann Fan Trade Entry
There are two alternatives to open trades with the Gann Fan. The first one is to trade breakouts, and the second one is to anticipate bounces from the diagonal lines.
Gann Fan Line Breakouts – If you spot a breakout through one of the nine Gann Fan lines, then you should open a trade in the direction of the breakout. However, don’t hop into a trade with the first candle which closes beyond a Gann line. Sometimes the interactions with the levels are not always so accurate. In this manner, it is better to wait for a candle to close beyond a Gann line and then to wait for a second confirmation candle which breaks beyond the initial breakout candle.
Gann Fan Line Bounces – Whenever the price bounces from a Gann line, you can use this opportunity to open a trade. The same as with the Gann Fan Line Breakouts, after you spot a bounce you should confirm it with an additional candle.
Gann Fan Stop Loss
In any type of leveraged trading, you should use a stop loss in order to protect your account. Here are some ideas to consider for placing stop loss orders when trading with Gann Line Breakouts and Bounces.
S/L on Gann Line Breakouts – When the price breaks through a level and you open a trade, you should place a stop loss below/above a previous bottom/top on the chart.
S/L on Gann Line Bounces – When the price bounces from a level and you open a trade, you should place a stop loss below/above the bottom/top of the most recent swing created at the time of the bounce.
Gann Fan Take Profit
Now that you know when to open Gann trades and how to protect them, we will discuss some trade management ideas.
T/P on Gann Fan Breakouts – When the price breaks through a Gann fan level and you open a trade, you should stay in the trade at least until the price reaches the next Gann Support or Resistance line.
T/P on Gann Fan Bounces – When the price bounces from a Gann fan level and you open a trade, you should stay in the trade at least until the price reaches the previous Gann Fan Support or Resistance line.
Gann Fan Trading Strategy
Let’s now summarize all these rules into a concrete trading example:
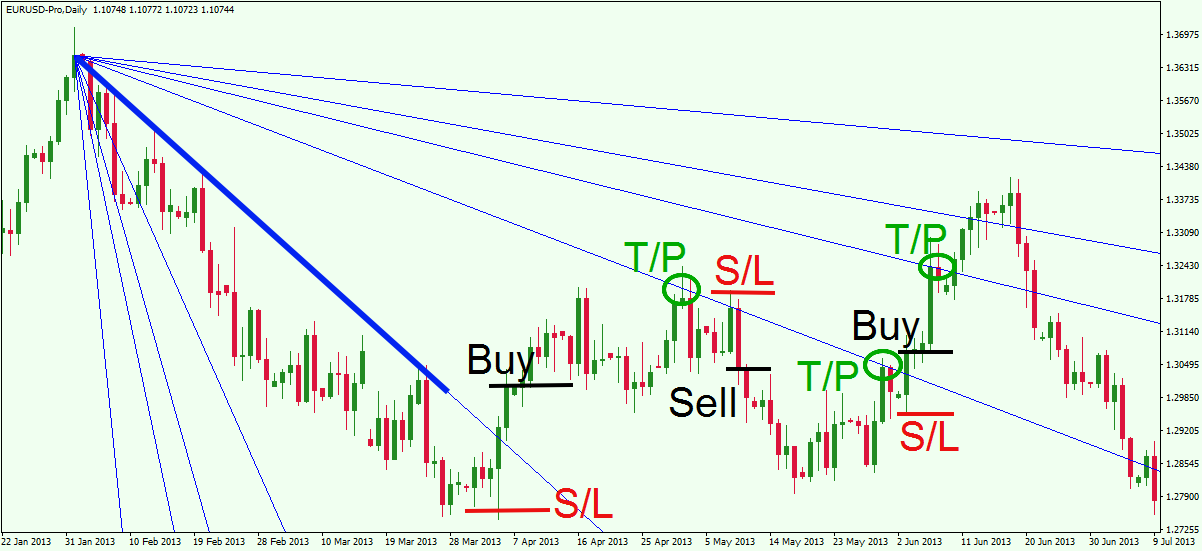
Above you will see the Gann Fan applied to a bearish trend of the EUR/USD chart. The blue thick line on the image shows the base we use which will calculate the Gann Fan lines at varying degrees. The black lines on the image illustrate the moments when trades should be opened per our rules. The red lines are the locations of the stop loss orders for each trade. The green circles show the moments when profits should be taken on the trade.
Our Gann analysis leads to three trades on this chart. The first one starts when the price breaks through the 1×1 Gann level. The candle which closes above the breakout candle creates a buy signal on the chart. The stop loss should be placed near the bottom that was created prior the breakout. The trade should be held until the price action reaches the next Gann level – the 2×1 level.
We see that the price doesn’t break the 2×1 level, and actually bounces downwards from it. A short trade should be opened when a candle breaks the support area created prior to the bounce. The stop loss should be located above the top created just before the downward bounce. This trade should be held until the price breaks the same diagonal line in the bullish direction. Notice, the take profit signal comes approximately around the same level as the initial sell signal, which makes this trade a scratch.
The Gann Fan gives another buy signal when the price action breaks the 2×1 line and closes a candle above the breakout. The stop loss in this trade should be placed below the bottom created prior the breakout. The trade should be held until the price action reaches the next resistance line.
Gann Grid Trading Strategy
The next trading strategy we will go through concerns the Gann Grid trading indicator. We will consider how you should open trades, put stop loss orders, and take profits when trading with the Gann grid.
Gann Grid Trade Entry
There are two alternatives to open trades with the Gann Grid. The first one is to look for breakouts thru the grid levels, and the second one is to spot bounces from the grid levels.
Gann Grid Breakouts – The breakouts in the Gann Grid are traded the same way as with the Gann Fans. If a breakout appears in the Grid, then you should open a trade in the direction of the breakout. Again, do not enter trades right after the first candle, which creates the breakout. Make sure you wait for a second confirmation candle, which extends beyond the breakout candle.
Gann Grid Bounces – When a bounce from a Gann Grid level appears on the chart, you can trade in the direction of the bounce. But as we just mentioned, make sure that you confirm the bounce with an additional candle.
Gann Grid Stop Loss
The Gann Grid indicator should also be traded in conjunction with a stop loss order. This way you will be protected from any surprises against your trade. Let’s now see how we should put in a stop loss in the two different Gann Grid trading scenarios:
S/L on Gann Grid Breakouts – When the price breaks through a grid level and you open a trade, you should place a stop loss below/above a previous bottom/top on the chart.
S/L on Gann Grid Bounces – When the price bounces from a Gann Grid level and you open a trade, you should place a stop loss below/above the bottom/top which is created at the time of the bounce.
Gann Grid Take Profit
But how long you should hold your Gann Grid trades?
T/P on Gann Grid Breakouts – When the price breaks through a Gann Grid level and you open a trade, you should stay in the trade at least until the price reaches the next level on the grid.
T/P on Gann Grid Bounces – When the price bounces from a grid level and you open a trade, you should stay in the trade at least until the price reaches the previous level on the grid.
Gann Grid Trading Example
Let’s now apply the rules from above to a practical trading example. Have a look at the image below which will demonstrate the use of this Gann Grid Trading Strategy in action:
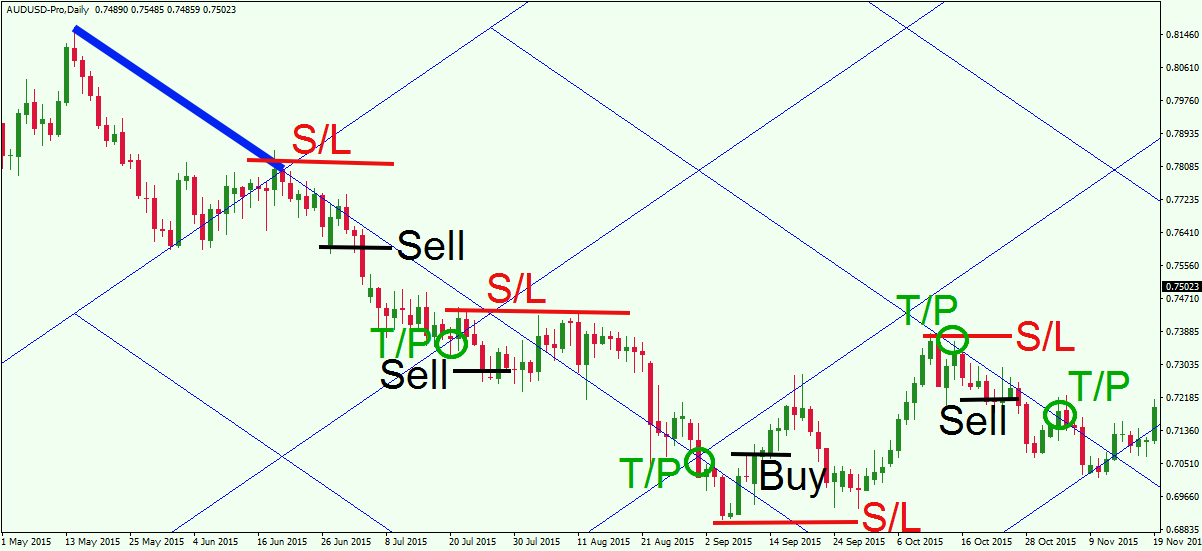
Here we are looking at the daily AUD/USD chart. The image starts with two tops, which are directed downwards. These two tops are marked with the blue thick line and they are used as a base for the Gann Grid indicator.
The picture illustrates four trades based on signals from the Gann Grid indicator. The black horizontal lines on the image show the moments when trades should be opened. The red horizontal lines on the chart are the suggested places for stop loss orders. The green circles point out the moments when profits should be collected based on our target rule.
The first trade is short and it comes after the price breaks a grid line downwards. The stop loss order should be located above the immediate top prior the breakout. The trade should be held until the price reaches the lower support grid line.
The next trade, which is opened when the price breaks the take profit grid line of the previous trade. In this case, the price comes close to hitting the stop loss, but the bearish move is resumed and eventually reaches its target.
Then the price reverses and breaks a grid level upwards. This is a buy signal on the Gann chart. The S/L should be placed below the bottom created at the time of the reversal. The trade should be held until the price reaches the next parallel resistance on the grid.
When this happens, the price bounces downwards, creating a new short opportunity. This is a new reversal and we use the top of the reversal for our stop loss order. The trade is held until the price breaks the same level it has bounced from.
Conclusion
- The Gann theory is based on the work of W.D Gann. It is a geometrical based trading approach.
- Gann strategy suggests that certain angles created by the price action can act as hidden support/resistance levels on the price chart.
- Gann theory holds that trends are more reliable and sustainable, when they are inclined at 45 degrees. In this manner, the Gann trading indicators are considered more accurate when they are applied to 45 degree trends.
- Two of the most popular Gann trading tools are:
- Gann Fan – Apply the fan by taking a trend on the chart for a base.
- Gann Grid – Apply the grids by taking two points on the chart.
- The Gann trading tools are more accurate when applied on bigger time frame charts.
- The main functions of the Gann Fan and the Gann Grid are to act as support/resistance levels and help in spotting potential breakouts.
- A trader could incorporate a Gann trading system using the Gann Fan and Grid in the following manner:
- You can open a trade when the price breaks a Fan or a grid level.
- Your stops should be located above/beyond the previous top/bottom on the chart.
- You should stay in your trade until the price reaches the next Gann S/R line.
- When you look to open a Gann trade using the Fan or Grid setup, it is suggested that you enter the market after the breaking candle itself gets broken by another candle. This way you will attain additional confirmation and higher probability of success for your Gann trades.