The Morning Star pattern is a candlestick formation that is often seen within the price action. It has a bullish implication and can often pinpoint a major swing low in the market. In this article, we will take an in-depth look at this pattern, along with some of the best practices for trading it effectively.
Morning Star Candlestick Pattern
The Morning Star is a candlestick pattern that is comprised of three candles. A completed Morning Star formation indicates a new bullish sentiment in the market. It is considered a reversal pattern that calls for a price increase following a sustained downward trend. The Morning Star candlestick structure starts off with a relatively long red candle, followed by a small second candle that can either be red or green, and then the third candle which confirms the structure will be a relatively long green candle.
Below you can see the illustration of Morning Star candle pattern
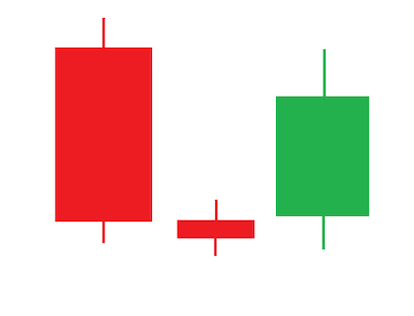
Notice on the illustration above, how the first candle is a bearish candle that is relatively large in size, followed by a smaller inner candle, and a final third candle which is a relatively large bullish candle. The first candle within the structure confirms the bearish sentiment within the downtrend, the second candle indicates indecision in the market, followed by the third candle which confirms a potential reversal to the upside. As such, the Morning Star candle formation is a bullish reversal pattern. And the implication is that the price should continue higher after the Morning Star structure has completed.
It’s important to note that within the Morning Star formation, the center candle plays a critical role. The central candle will be a relatively small candle in relation to the other two candles adjacent to it. Additionally, it is often seen as a doji candle. A doji candle is essentially a relatively narrow candle pattern wherein the body is extremely small and there exists a noticeable wick on either side of the candle’s body. This formation within the Morning Star pattern indicates hesitation or indecision in the market.
In terms of identifying a valid Morning Star pattern on the price chart, it’s important that the structure be analyzed in the context of the current price action. That is to say that a valid Morning Star pattern will generally occur after a downtrend has been in place for some time. This is what gives the Morning Star pattern the characteristics of being a bullish reversal signal. The pattern is indicating that the bearish price trend is in jeopardy, and that an upside price reversal is imminent.
There are several ways that a trader can execute a buy entry using the Morning Star formation. One of the more widely used techniques for entering into a long position following the Morning Star formation is to wait for a breakout above the high of the third candle within the structure. When this occurs it provides confirmation of continued upside momentum following the Morning Star formation, which should lead to additional price gains to the upside.
Another technique that some traders utilize for entering into a long position following the Morning Star pattern is to wait for a minor retracement of the third candle. Typically this retracement will be a 38 to 50% retracement level. The logic here is that the market should subside a bit following the Morning Star formation, providing a better entry for the long position.
Although this is a viable entry method for trading the Morning Star pattern, it does come with some additional risks. The primary risk being that the minor retracement could lead to a further price decline, and thus there exists a higher chance of getting stopped out. Unlike the breakout entry mentioned above, this retracement entry does not require the market to provide additional confirmation of bullish momentum.
Generally speaking, the stop loss for the Morning Star pattern should be set below the low of the central candle within the formation. This will usually be the lowest low within the structure, and as such provides an excellent area for placing the stop loss. Prices should not move below this level, and if it does it will typically invalidate the bullish potential of that specific setup.
Bullish Morning Star At Key Support
When trading the bullish Morning Star pattern, it’s best to focus on the highest probability set ups. One of the ways to do that is to take those trades wherein a bullish Morning Star pattern occurs at a key support level. When this occurs, it provides additional confirmation and confidence on the trade.
This is because at a critical support level, sellers could overwhelm the buyers leading to a breakout below the level or buyers could overwhelm the sellers leading to a reversal to the upside from the key level. Since we know that the Morning Star pattern is a bullish reversal pattern, it can be an excellent buy signal when it occurs near a major support level.
Let’s take a look at an example of a Morning Star at a support level using the daily chart of the EURJPY pair.
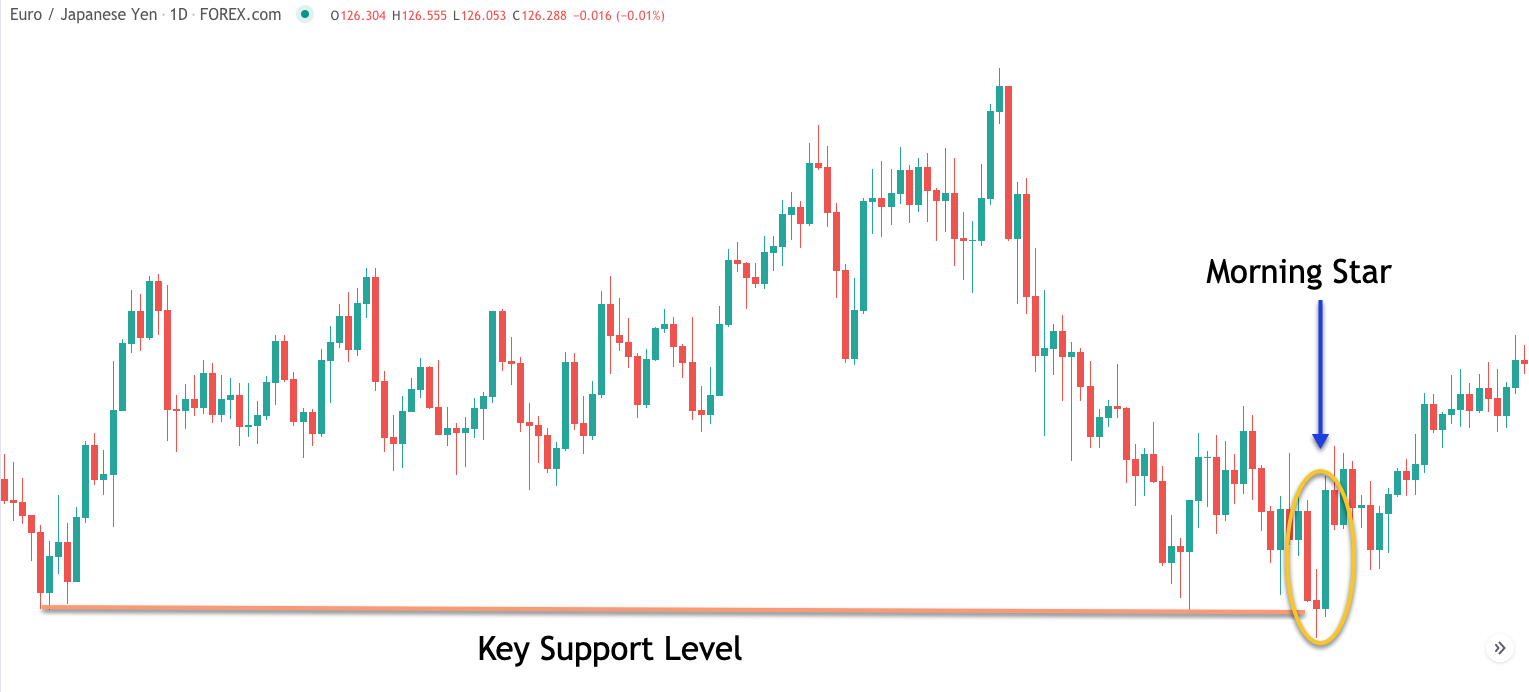
Notice on the chart above, the two important swing lows that occur prior to the formation of the Morning Star pattern. These two swing lows should be connected with a horizontal line to create the key support level. Once price returns to this level, we will want to watch the price action closely for any clues of a potential breakout or reversal.
As prices move higher following the second swing low, we can see a third test of the key support level. And this third test results in the formation of the Morning Star pattern. Because of this, we would favor an upside reversal and expect the key support level to hold. As expected, the price begins to rise following the completion of the Morning Star formation.
When entering into a long position using the Morning Star pattern, it can sometimes be difficult to gauge where the price target should be placed. This is because the Morning Star pattern does not provide any clues as it relates to the extent of the price move that will follow. As such, you will need to use some other technical tool for exiting the trade. One such technique could be to use a three bar low as a trailing stop after the price has moved in your favor by a certain amount. That is to say that your exit order would then be triggered when the price breaches the low of the last three completed bars.
Bullish Morning Star With Stochastics
Let’s now look at another filter that works well with the Morning Star set up. More specifically, when you incorporate an oversold reading from a momentum based oscillator, such as the Stochastics indicator, you will increase your chances of a successful trade.
The Stochastics indicator is a popular oscillator that provides oversold and overbought readings based on a default look back period of 14 days. The Stochastic oscillator has two primary lines, the faster percent K line which is more sensitive, and the slower percent D line which is less sensitive.
And so, when the percent D line of the Stochastics indicator is in oversold territory, then that is usually a signal that prices are more likely to reverse to the upside. When you couple that oversold reading with a candlestick pattern like the Morning Star, that can provide for a high probability play to the long side.
Let’s take a look at an example of the Morning Star with the Stochastics oscillator using the daily chart of the GBPJPY pair.
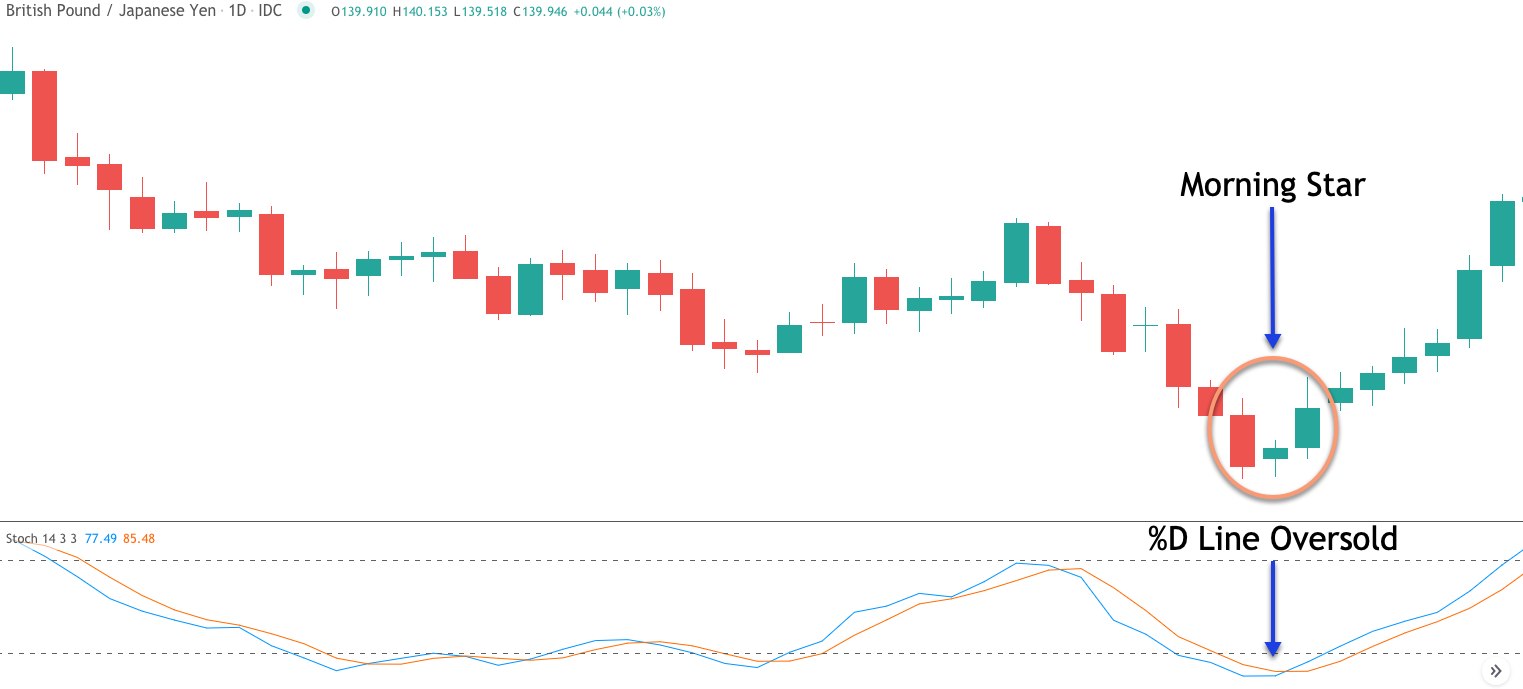
On the candlestick chart above you can see there is a strong downtrend leading up to the Morning Star formation. At the time the Morning Star reversal pattern was forming, the Stochastics percent D reading was below the oversold threshold as can be referenced by the lower blue arrow on the chart.
As such, our expectation would be for a price increase following the completion of the Morning Star pattern. As is clearly evident, after a few bars of sluggish upward price movement following the completion of the Morning Star, the price moved higher quite sharply, surpassing an important swing high level.
Now, although we’ve demonstrated this set up using the Stochastics oscillator, it would work equally well with other momentum oscillators such as the Relative Strength Index and the Williams %R indicator.
Morning Star Trading Strategy
Let’s work on building a strategy that incorporates the Morning Star trading pattern. We’ve looked at how we can use key support levels, and momentum based oscillators to add confluence for the Morning Star trade set up. Now, we will describe a full Morning Star pattern strategy that includes the entry, stop loss and exit. The strategy includes the Morning Star pattern along with the Bollinger band indicator.
The Bollinger band indicator is a volatility based study that is very useful in finding overextended price moves. More specifically, when the price reaches the upper line of the Bollinger band, that is typically a good time to look for selling opportunities. Similarly when the price reaches the lower line of the Bollinger band, that is often a good time to look for buying opportunities.
Now, trading the Bollinger band in this manner can be effective by itself, however when you combine these conditions with the Morning Star candle structure, you will dramatically improve your trade results.
Since the Morning Star is a bullish reversal pattern, we will only seek long trade set ups within the strategy.
So here are the rules for a long trade using the strategy:
- A Morning Star formation must have formed on the price chart.
- An easily recognizable downtrend must be present prior to the Morning Star pattern formation.
- Enter a market order to go along upon completion of the Morning Star pattern.
- The stop loss should be placed below the lowest low within the Morning Star pattern.
- Exit rule if the entry price is below the centerline, and the Morning Star pattern does not touch the centerline. — The price must cross above the centerline of Bollinger band within 10 bars following the long entry. If this condition is not met, then exit the trade on the next bar. If met, then, Exit the trade upon a close back below the center line of the Bollinger band.
- Exit rule if the entry price is above the centerline, or the Morning Star pattern touches the centerline. — Exit the trade upon a touch of the upper Bollinger band.
Morning Star Pattern Strategy Example 1
Let’s now turn to an actual example that demonstrates the Morning Star strategy shown on the price chart. Below you will find the British Pound to Japanese Yen currency pair based on the daily chart.
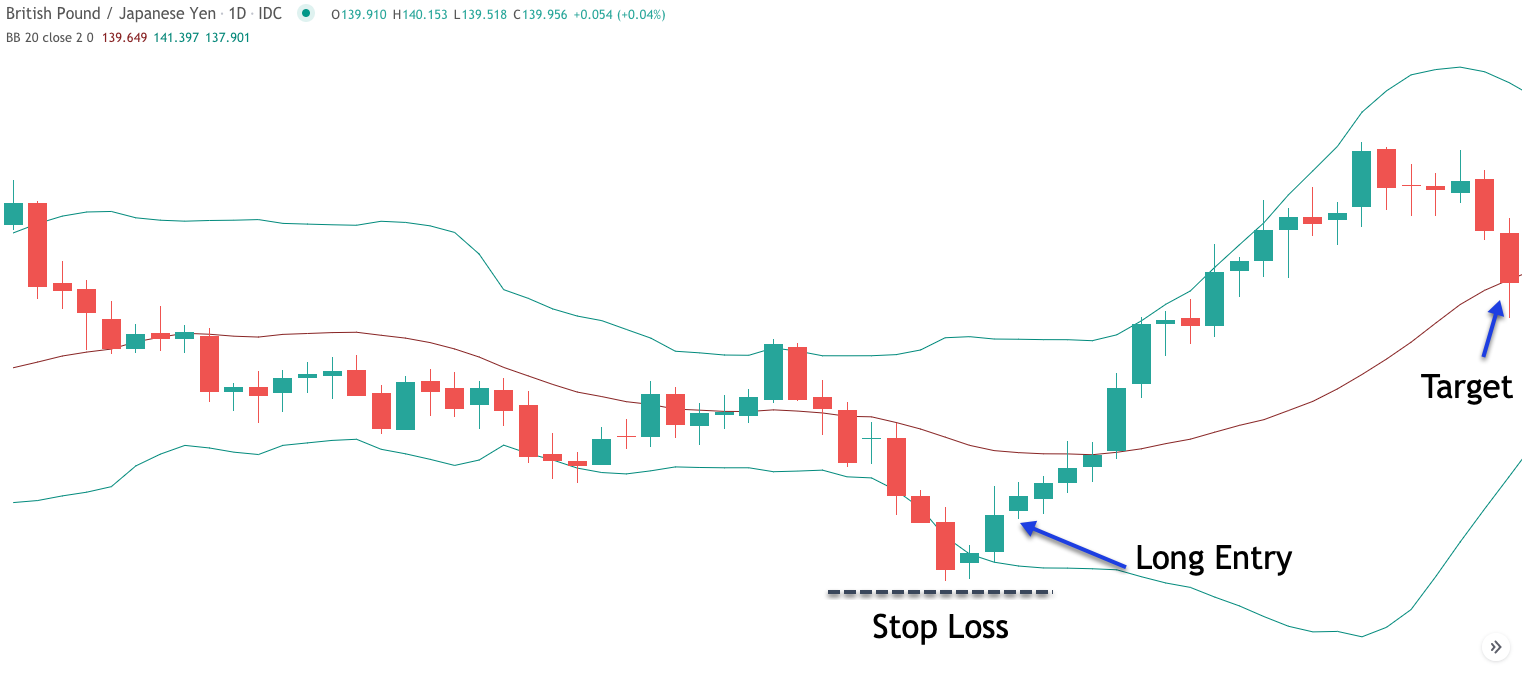
We can see towards the bottom of this chart there was a Forex Morning Star pattern. Notice the strong bearish candle as the first candle within the structure, the smaller middle candle which illustrates indecision in the market, followed by the relatively strong bullish candle that completes the pattern.
Once we have confirmed the presence of the Morning Star pattern, then we would look to the previous price action to confirm that there was an easily recognizable downtrend in place leading up to the pattern itself. As we can clearly see the price was moving lower in a stairstep manner creating a downtrend in the price action.
Now with these conditions met, we can focus on executing a long entry on this currency pair. The long entry would be initiated at the beginning of the candle immediately following the completion of the Morning Star pattern. You can see where that entry would’ve occurred by referencing the blue arrow following the Morning Star formation.
The stop loss would be placed below the lowest low within the Morning Star structure as can be seen by the black dashed line drawn below the long entry point.
At this point, we would turn to the trade management process to try to manage the existing trade as the price moves in our favor to the upside. The first thing that we would want to watch is the price in relation to the centerline of the Bollinger band. More specifically, based on our strategy rules, the price must exceed the centerline within 10 bars following the long entry. This condition will allow us to stay in the trade for further upside potential.
As we can clearly see the price moves above the centerline within three bars of the entry signal. As such, will continue holding the trade and utilize the same centerline as our trailing stop mechanism now.
That is to say that the exit signal would occur when the price closes back below this centerline of the Bollinger band.
Referring to the far right of the price chart you can see when that event occurred, which would have taken us out of the position, resulting in a profitable trade.
Morning Star Candlestick Setup Example 2
Let’s now look at a second example of the Morning Star set up. Below you will find the price chart of the Euro to Yen currency pair shown on the daily chart.
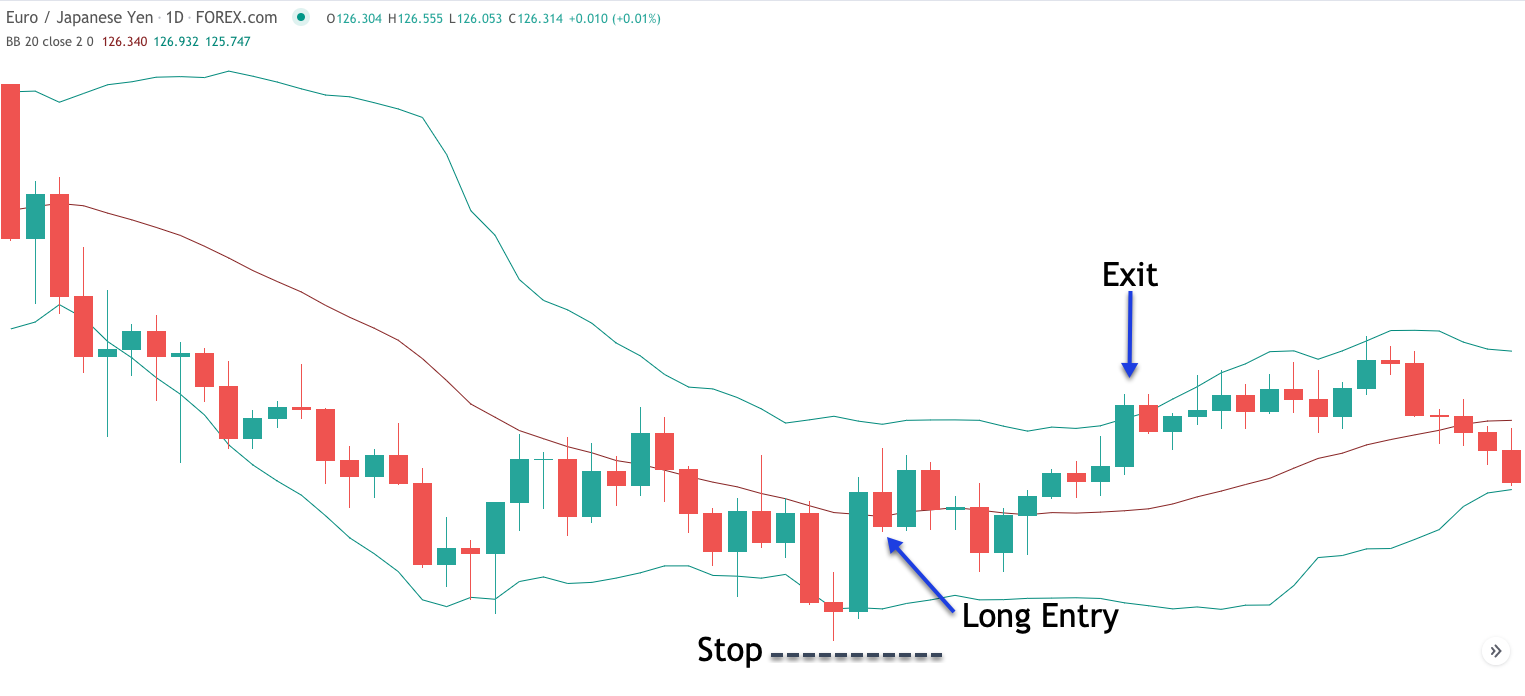
If you refer to the bottom portion of the price chart, you will find a well-defined Morning Star candlestick. Notice how the first candle within the formation is a relatively long bearish candle, followed by a Doji type candle, and then finally a strong bullish candle. These three candles combine to form the Morning Star structure. Now that we have identified a Morning Star pattern, we must confirm that it exists within the context of a down trending market condition. If you take a close look at the price action leading up to this Morning Star, you can see that a clear downtrend was in place.
Now that we have confirmed the Morning Star pattern, we can turn to the trade entry. As per our rules, we would enter a long position immediately following the completion of the Morning Star pattern. As such the long entry would be triggered at the start of the following candle as shown on the price chart.
In order to protect ourselves in the case of an adverse price move, we will set a stop loss below the lowest low within the Morning Star structure. Since, the Morning Star pattern touches the centerline, our exit rule calls for closing out the trade upon the touch of the upper Bollinger band. You can see where that first touch occurred following the entry signal. This event would have required us to close out the trade.
Summary
The Japanese Morning Star candlestick pattern is a three candle formation that has a bullish implication. It is a powerful pattern when it occurs in conjunction with some other technical based studies particularly a support level, or an oversold market condition as can be seen using a momentum indicator such as Stochastics, or a volatility indicator such as Bollinger bands. Adding this additional layer of confluence to the Morning Star set up will help to increase the probability of success.