Along with candlestick charts, bar charts are the two most popular charting styles used by traders and investors. Although a lot of newer traders are not as familiar with bar charts as they may be with candlestick charts, they are still quite popular among a certain segment of traders. Our discussion here will revolve around how to read bar charts, and the most important patterns that emerge from bar chart analysis.
What Is A Bar Chart?
A bar chart is a charting style that displays the price action during a specified period. Each bar shows that specified period’s opening price, high price, low price, and closing price. This is also referred to as the OHLC prices. Unlike candlestick charts which were introduced by a Japanese rice trader, bar charts are an invention of the Western world. They were the primary charting style used by American and European technicians prior to the popularity of candlestick charts.
Each bar within a bar chart will display a vertical line and two horizontal lines. The upper threshold of the vertical line represents the high price of the bar. The lower threshold of the vertical line represents the low price of the bar. The horizontal line on the left side of the vertical line represents the opening price. And the horizontal line to the right side of the vertical line represents the closing price. Below you will find an example of a forex bar chart.
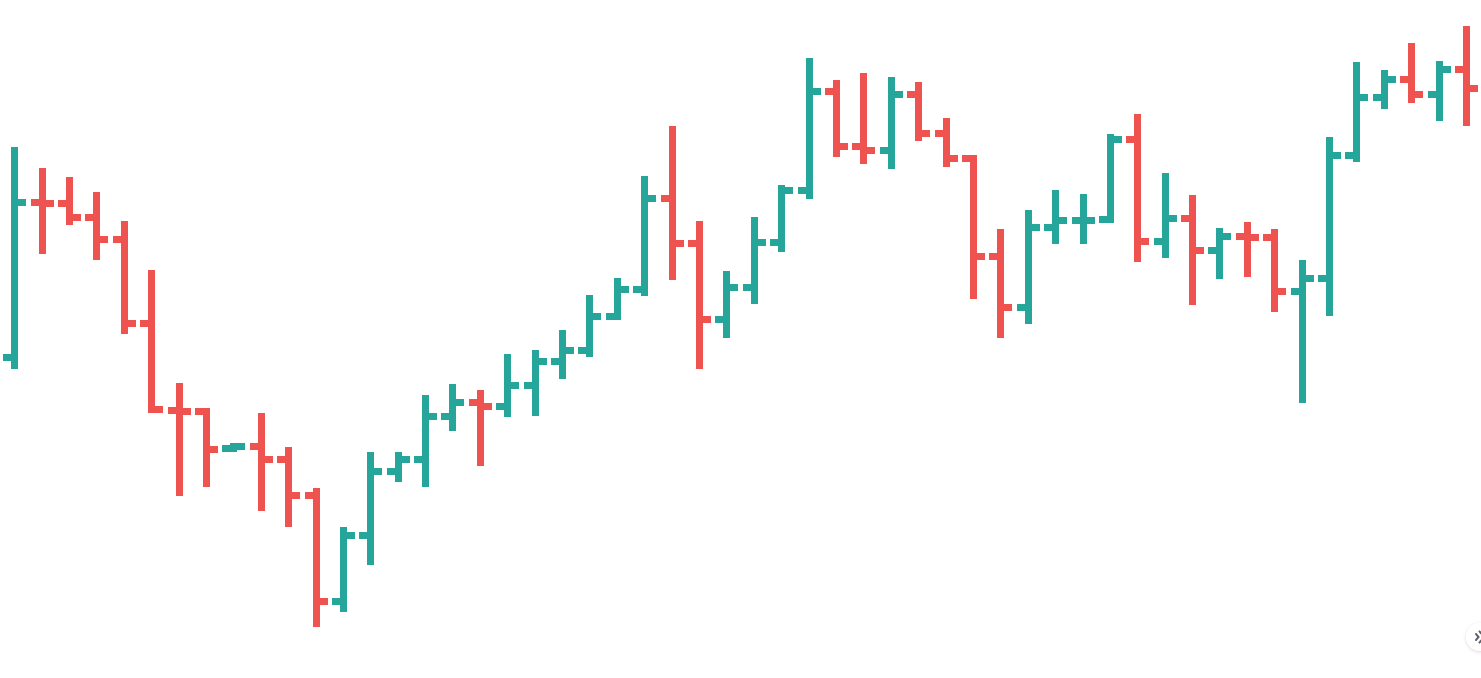
Many times the up bar will be represented by a green color bar, and the down bar will be represented by a red color bar. This color coding makes it easier for the chartist to quickly analyze the price action and differentiate between an up bar which represents bullish activity, and a down bar which represents bearish activity.
It should also be fairly evident that the longer the bar, the greater the range for that specific bar. That is to say that long bars represent a wider divide between the high and low for that specific bar, while short bars represent a narrower divide between the high and low for that specific bar.
As such, longer bars tend to represent higher volatility levels in the market while shorter bars tend to represent lower volatility levels in the market.
Just as with candlestick charts, bar charts can help traders to better analyze the price activity on the chart, and make informed decisions about whether the market is more likely to continue moving in the same general direction, or to reverse and move in the opposite direction. Bar chart analysis is a combination of art and science. Price action traders can use the various clues provided by individual bars and bar combinations to gauge the price pressures in the market as a result of increased demand or supply at any given time.
Bar Chart Patterns
Bar chart pattern analysis is an excellent way to gauge short-term sentiment in the market. Most bar patterns consists of 2 to 3 individual bars that combine to form a specific formation. Bar patterns can be classified as continuation patterns and reversal patterns. As the name suggests, a continuation pattern is expected to move prices in the direction of the current trend following the completion of the pattern. Along the same lines, a reversal pattern is expected to retrace or reverse the direction of the current price movement.
We will discuss some of the most important bar chart patterns that traders should be aware of. This includes the inside bar pattern, outside bar pattern, two bar pattern, three bar pattern, key reversal bar pattern, exhaustion bar pattern, and the island reversal bar pattern.
Now although you can use these various bar patterns on any timescale, they are far more reliable on higher time frames such as the four hour and above. They tend to work best on the daily chart, as the daily price bar has special significance in the market. Additionally, the more active a particular market is in terms of volume, the more reliable the bar pattern will tend to be.
As such, the best use of bar patterns for market analysis occurs when you are applying them to the daily or weekly charts, and on a very actively traded market instrument. Some examples of very liquid markets would include currency pairs such as EURUSD, GBPUSD, and USDJPY. For traders who participate in the futures market, some examples would include the E-mini S&P, Crude Oil, Gold, and Treasury Bonds.
Inside Bar Pattern
An inside bar pattern can be a continuation or reversal pattern based on which side a breakout from the pattern occurs. The inside bar pattern is a two bar formation that presents a market condition wherein traders are displaying indecision and reluctance. This is because the first bar in the pattern, which can either be, a bullish bar or a bearish bar is relatively normal in size, and the second bar, the inside bar, is completely engulfed by the first bar. As such, there is reduced volatility within the second bar, which is building energy for a potential breakout.
Let’s look at an example of an inside bar pattern. Below you can see an illustration of the inside bar.
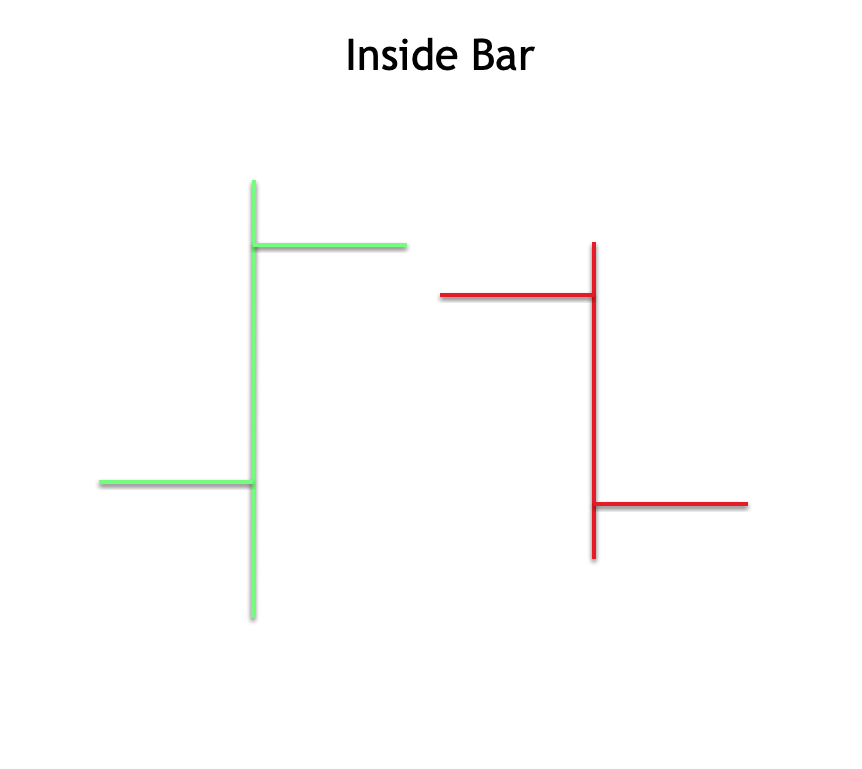
This example shows a condition wherein the initial bar is a not bar, and the inside bar is a down bar. But keep in mind, that any scenario with regards to an up bar or down bar will be acceptable within this formation. The most important criteria is that the second bar, the inside bar, be completely engulfed by the first bar. In other words, the high of the second bar should be below the high of the first bar, and the low of the second bar should be above the low of the first bar.
Going back to our illustration above, we can see that in this example the first bar is an up bar, where the close is above the open. And then the second bar is a down bar wherein the close is below the open. Notice how the high of the second bar is lower than the high of the first bar, and the low the second bar is higher than the low of the first bar. As such, this would be considered a valid inside bar formation.
Typically, the way that you would go about trading and inside bar formation is to wait for either a break above the high of the second bar to enter long, or to wait for a break below the low of the second bar to enter short. Once the breakout occurs either to the upside or to the downside, the price should follow through in the direction of the breakout for at least several bars or more.
Outside Bar Pattern
Outside bar formations are commonly referred to as engulfing patterns in candlestick analysis. Outside bar formations are considered reversal patterns and will typically occur at the end of an extended price move. A bullish outside bar formation would generally occur after a downtrend, and a bearish outside bar formation would generally occur after an uptrend.
The general psychology behind the bullish outside bar formation is that the current downtrend is beginning to wane, and sentiment is starting to shift from bearish to bullish. Similarly, within the bearish outside bar formation, the uptrend is beginning to wane, and the sentiment is starting to shift from bullish to bearish.
Below you will find an illustration of a bullish outside bar formation.
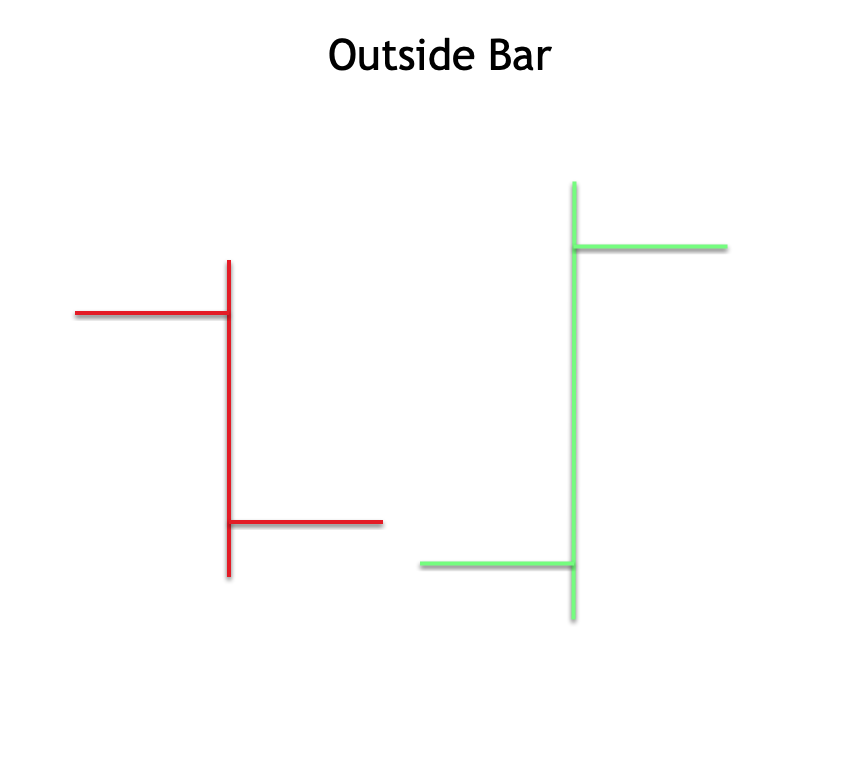
Looking at the structure above for the bullish outside bar pattern, we can see that the following conditions exist. For starters, the second bar opened below the previous close. The second bar also has a low that is lower than the previous bar. And finally, the second bar closes above the open of the previous bar. Thus it is a bullish bar reversal. When these conditions are met, we can classify the two bar structure as a bullish outside bar pattern.
The bearish outside bar pattern would work the same but in reverse. That is to say that the second bar within the bearish outside bar pattern will open above the previous close, and it will also have a high that is higher than the previous bar. And finally, the second bar will close below the open of the previous bar. Thus it is a bearish bar reversal.
Since the outside bar formation is a reversal pattern, the implications is for price to reverse the current trend. What the outside bar does not provide us with is the extent of the price move that we should expect following the completion of the pattern. Traders will need to utilize other technical tools to find appropriate target points when trading the outside bar pattern.
Two Bar Reversal Pattern
A 2 bar reversal pattern is a commonly seen structure within the financial markets. Within the bullish two bar reversal pattern, the initial bar is a relatively strong bearish bar, and the second bar is a relatively strong bullish bar.
The implication is that the initial bearish sentiment seen within the first bar has been reversed by the opposite, now bullish sentiment within the second bar.
Within the bearish two bar reversal pattern, the initial bar is a relatively strong bullish bar, and the second bar is a relatively strong bearish bar.
The implication here is that the initial bullish sentiment seen within the first bar has been reversed by the opposite now bearish sentiment within the second bar. Below you can see an illustration of a bullish two bar reversal pattern.

Notice how the first bar displays strong bearish characteristics, as the open is near the top of the range, and the close is near the bottom of the range. Then the second bar opens near the bottom of the range, and closes near the top of the range. Two bar reversals are often seen following a corrective phase within a larger impulse structure. In other words, they are often seen at the end of a pullback within the context of a trending market.
And so, it’s common to see a bullish two bar reversal form at the end of a downward corrective phase, within a larger uptrend. Similarly, it’s common to see a bearish two bar reversal form at the end of an upward corrective phase, within a larger downtrend. When this scenario occurs, it would be best to treat the two bar reversal structure as a possible terminal point within a minor retracement, and prepare to position in the direction of the larger trend.
Three Bar Reversal
The three bar reversal pattern is similar to the outside bar pattern in that it often occurs after an extended market move. However, the three bar reversal is composed of three bars while the outside bar pattern consists of only two bars. The 3 bar reversal pattern can be bullish or bearish.
A bullish three bar reversal pattern starts off with a strong down bar, which is then followed by a relatively narrow bar. This narrow middle bar closes below the opening of the first bar. Additionally the middle bar will be the lowest bar within the three bar structure. The last bar will be a strong up bar and close above the high of both the first and second bars. Within the candlestick terminology, the bullish three bar reversal is classified as the Morning Star pattern.
A bearish three bar reversal pattern starts off with a strong up bar, which is followed by a relatively narrow middle bar. The shorter middle bar will close above the opening of the first bar.
Moreover, the middle bar will be the highest bar within the three bar formation. Finally, the last bar will be a strong down bar that closes below the low of both the first and second bars. Candlestick traders will recognize the bearish three bar reversal pattern as the Evening Star pattern.
Below you will find an illustration of the bullish three bar reversal pattern.
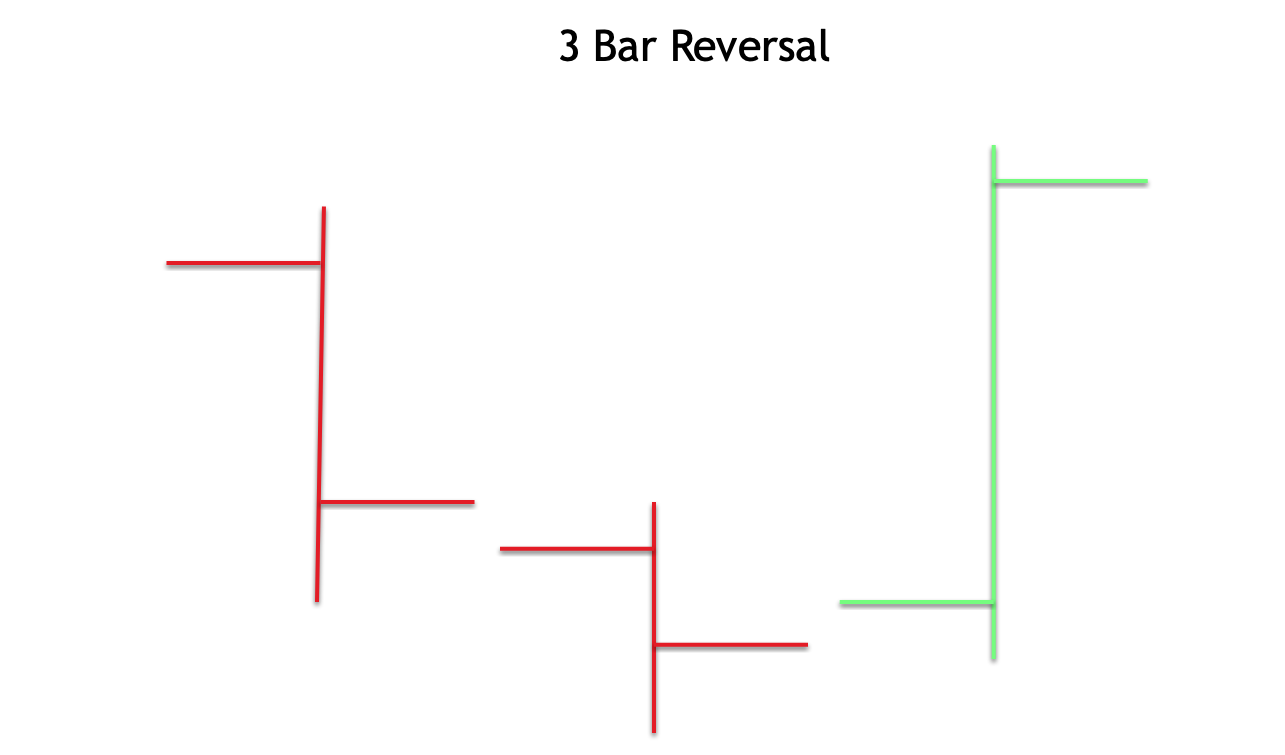
Generally, the bullish three bar reversal pattern will occur at the end of a relatively prolonged downtrend phase. The bullish three bar reversal can either lead to a minor upward price retracement, or a new uptrend altogether. Similarly the bearish three bar reversal pattern will occur at the end of a relatively sustained uptrend phase. The bearish three bar reversal can either lead to a minor downward price correction, or a new down trending market phase.
Key Reversal Bar Pattern
The key reversal bar formation is a two bar structure that can signal an impending trend change. The bullish variety of the key reversal bar will open below the low of the previous bar and trade higher and close above the previous bar’s high. The bearish variety of the key reversal bar will open above the previous bar and trade lower to close below the previous bars low.
In the illustration below, you can see an example of a bullish key reversal bar pattern.
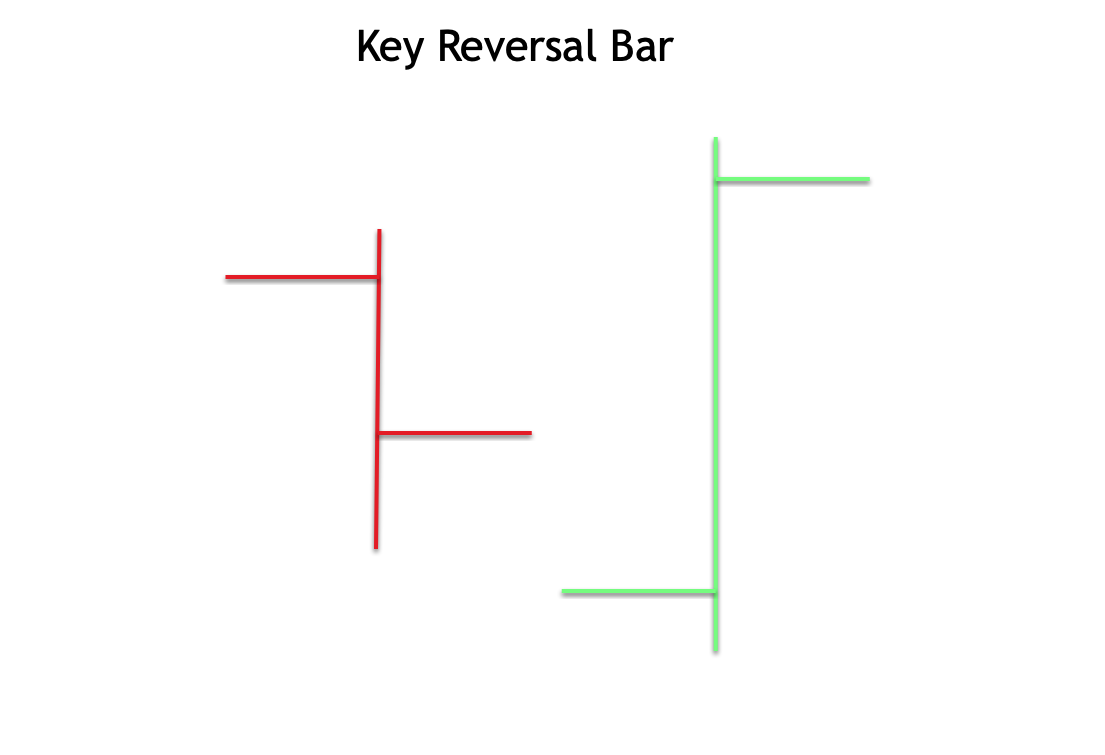
The best way to trade the key reversal bar pattern is to wait for a break above the high of the second bar, in the case of the bullish variety, and to wait for a break below the low of the second bar, in the case of a bearish variety.
The key reversal bar pattern is especially significant when it occurs at or near a fixed or dynamic support or resistance level. For example, a bullish key reversal pattern that occurs at a horizontal support level is considered quite significant. Additionally a bearish key reversal pattern that occurs at the 50 day moving average line would also be considered a significant signal.
These are just a few examples of how to combine the key reversal bar pattern with other technical studies, and there are many other ways to apply confluence using the key reversal bar, and other bar formations.
Exhaustion Bar Pattern
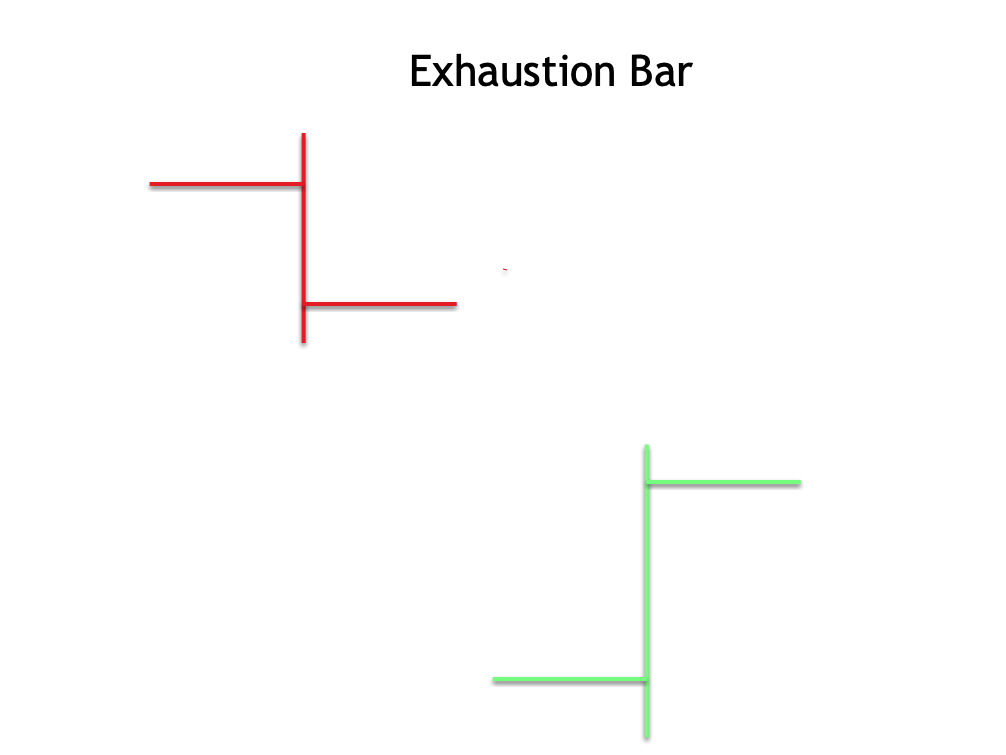
The exhaustion bar pattern occurs less frequently in the market compared to most of the other patterns that we’ve described earlier. Nevertheless, it is a very important reversal pattern that traders should keep an eye out for. The exhaustion bar pattern typically occurs at the end of a prolonged trend phase, either to the upside or to the downside. A bullish exhaustion bar opens with a gap down move, which is then followed by strong upward movement on high-volume. The price closes at or near the top of the range.
A bearish exhaustion bar opens with a gap up move, which is then followed by strong downward price movement on high-volume. The price closes at or near the bottom of the range. Within both scenarios, the gap created between the first and second bar remains unfilled upon the completion of the second bar.
Below you can see an illustration of a bullish exhaustion bar pattern.
Typically what’s going on behind the scenes within an exhaustion bar formation is that the market is trying to make a final attempt to push prices in the direction of the current trend. But that attempt eventually fails, and leads to a sharp reversal.
The best way to trade an exhaustion bar is to wait for a break above the high of the second bar to go long in the case of a bullish exhaustion bar. And you would wait for a break below the low of the second bar to go short in the case of a bearish exhaustion bar.
It’s also worth noting that the closing price prior to the opening gap will often act as an area of resistance in the case of a bullish exhaustion bar, and can act as an area of support in the case of a bearish exhaustion bar. As such, traders should watch the price action closely near this area or consider exiting a portion of the trade near this level.
Island Reversal Pattern
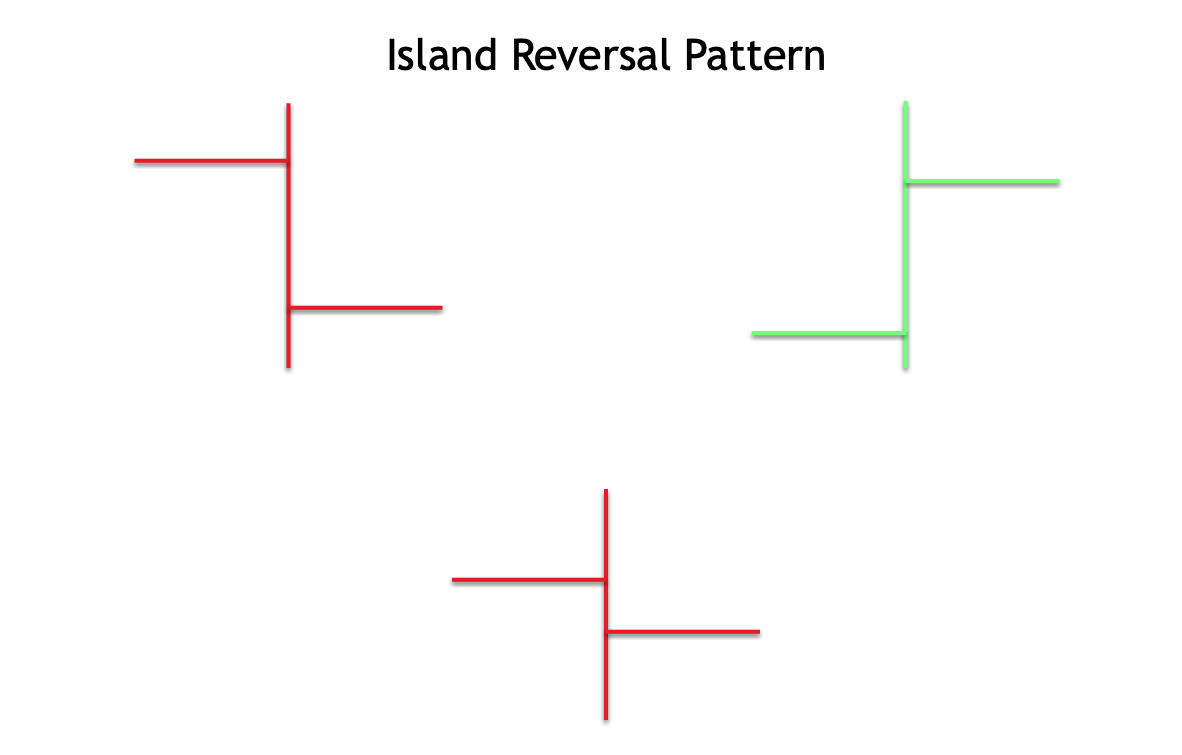
The island reversal pattern is also a relatively rare bar pattern, not often seen on the price chart. It is characterized by having a gap on either side of a bar or set of bars. As with the exhaustion bar pattern, it occurs after a prolonged price move that has often gone too far too fast. Typically we will see that there is increased volume on the initial gap and the secondary gap.
An island reversal that occurs near the top of a trend move is often referred to as an island top. The island top has a bearish implication. An island reversal that occurs near the bottom of a trend move is often referred to as an island bottom. The island bottom has a bullish implication.
Below you can see an illustration of a bullish island reversal pattern.
Island reversal patterns are known to trap traders on both sides of the market. The volatility is often relatively high during this time. Additionally, these patterns often occur on some unexpected news announcements or on a highly anticipated earnings report within the stock market. Traders need to be nimble when trading the island reversal pattern and maintain strict money management procedures to avoid getting whipsawed. In any case, the island reversal pattern is a high probability trade set up that should be on your radar.
Summary
Bar charts are a traditional charting style that has historically been more popular with Western traders. Over the years, candlestick charts have become more popular both among Western and Eastern traders. Both types of charting styles can be useful in analyzing price action, particularly as it relates to looking at specific patterns that form within two or three adjacent bars or candles. In that way, trading bar chart patterns can be very similar to trading candlestick chart patterns.
We have presented seven of the most important and noteworthy bar patterns. It would serve a trader well to memorize these formations so that they can quickly isolate them on the price chart, when they occur.