Within the realm of technical analysis, the Elliott wave theory is considered a more advanced trading methodology. It requires a bit of time to learn and apply correctly. There are many subtopics within the context of the Elliott wave theory, and no single article would be sufficient to address all of the important components of the theory. For our purposes here, we’ll focus on one core topic within Elliott wave. Specifically, we will try to help you better understand the general characteristics of the different waves within the overall structure.
What Is The Elliott Wave Theory?
The Elliott wave theory is a financial market theory that was developed by R.N. Elliott during the 1930s. It describes the nature of price movements within the markets and the role of mass psychology as the underlying force behind all price action regardless of instrument or timeframe. The Elliott wave theory is rooted in technical analysis but, unlike many other technical approaches to the market, the Elliott wave theory provides a much deeper explanation of price movements. Within the Elliott wave theory, price movements are labeled as waves that can be analyzed and used as a predictive tool for projecting future price moves.
The Elliott wave theory suggests that price movements in any freely traded, liquid, financial market create patterns that can be seen at all degrees of trend. These patterns are made up of two major classes known as motive waves and corrective waves. Motive waves move in the direction of the larger trend, while corrective waves move counter to the larger trend and thus retrace a portion of its prior leg.
Although RN Elliott is credited with the development of the Elliott wave theory, a more recent figure has emerged as a leading authority in the advancement of the Elliott wave theory. The person I’m referring to is a prominent technical analyst named Robert Prechter. He along with A.J. Frost wrote a book in the 1970s entitled “The Elliott Wave Principle”, which is considered the Bible on all things related to the Elliott wave theory. This is where any serious student of Elliott wave analysis should start their intensive study into this specialized area of technical analysis.
One of the key points within the Elliott wave theory is the concept of the fractal nature of the markets. This is to say that price patterns repeat themselves over and over again at all time frequencies. This is an important component of the Elliott wave theory and one that analysts and traders need to get understand in order to appreciate and apply the theory successfully in the markets.
Characteristics Of Elliott Waves
As we noted in the introduction, the Elliott wave theory is based on the idea that all price movements in the markets are driven by mass psychology. And this leaves a certain footprint on the price chart which the astute trader can learn to recognize and profit from. Under the Elliott wave theory, there are two types of price progressions. The first are those price movements or waves that are aligned with the larger trend. These price movements are referred to as motive waves. The second are those price movements are waves that are contrary to the larger trend. These price movements are referred to as corrective waves.
Motive waves can be classified further as impulse waves or diagonal waves depending on the form and location within the overall structure. Impulse waves are the most common form of motive waves. Corrective waves are generally classified as either flat structures, zigzag structures, triangle structures, or double or triple combinations.
The basic form of the entire Elliott wave sequence is comprised of five waves that make up the motive wave, which are labeled waves one through five. Following the completion of wave five within the motive sequence, the market will develop into a three wave retracement that moves contrary to this motive wave sequence. This retracement move consists of three waves labeled as waves A, B and C. We will be taking a deeper look into the characteristics and personalities of each of these waves in the upcoming section.
Many analysts and traders who come to study the Elliott wave theory, find that it is quite challenging to learn all the rules and nuances of the theory, and often give up before they can fully appreciate its powerful predictive value. Although there are quite a bit of nuances within the Elliott wave theory, the rules themselves are quite simple and straightforward. In fact, there were only three unbreakable rules as it relates to the Elliott wave principle.
The first rule is that wave two cannot retrace more than 100% of wave one. The second rule is that wave four cannot move into the territory of wave one. And finally, wave three cannot be the shortest waves amongst waves one, three, and five. Once you have a good understanding of these outlined rules, you can start applying many of the ideas within the Elliott wave theory in a practical manner.
Elliott Wave 1 Characteristics And Personality
Let’s now start our discussion of the unique characteristics and personalities of the various waves within the Elliott wave structure. We will illustrate the personalities of the waves from the context of a bull market.
Wave one is considered as the kickoff wave, meaning that it begins the impulse sequence. During this wave prices began to bounce higher after a long sustained downtrend. The sentiment in the market is very bearish at the start of wave one, and the fundamental and economic news is predominantly negative. As wave one moves higher, most people see this upside price movement as just a bear market rally, and many investors and traders consider wave one as a good opportunity to initiate a new short position or add to their existing short positions.
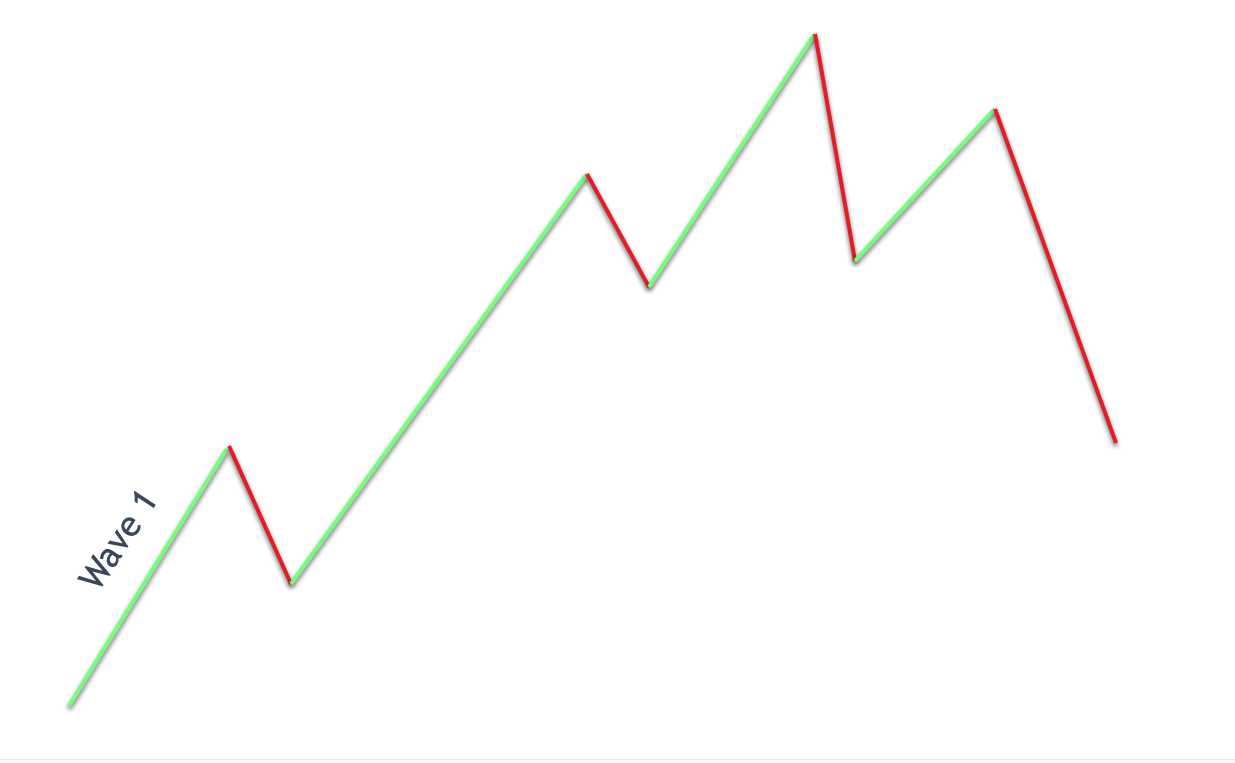
Wave one is generally the least predictive wave within the entire Elliott wave structure. That is to say that there is really no way to know how long the wave will last. However, at some point it will become clearly apparent that wave one has ended, as a significant swing high is reached, and prices begin to move lower in a bearish direction once again. Wave one generally subdivides into five smaller waves and can sometimes appear as a leading diagonal structure.
Elliott Wave 2 Characteristics And Personality
After wave one completes, the next wave in the Elliott wave sequence will be wave two. So, what can we gather from the Elliott wave two leg? Well, wave two will move counter to wave one, and will retrace a large portion of wave one. Often wave two will retrace wave one by either a 50% retracement, 61% retracement, or 78% retracement. During wave two investors and traders began to feel assured once again that the downtrend has continued. However, the market will fail to break below the wave one low. Remember, one of the unbreakable rules within the Elliott wave theory, which is, that wave two cannot retrace below the start of wave one.
Informed traders will begin to recognize this pattern and start to position to the long side of the market. Most other traders however will continue to add to their short positions and remain bearish. The news at the end of the wave two swing low is often more pessimistic then at the start of wave one.
Most traders simply are not prepared for the eventual turn in the market which will begin to lead prices higher. But those who are will be well rewarded for recognizing the extreme pessimism and the oversold market condition. Once all the sellers have placed their bets, there is nowhere else for the market to go but higher.
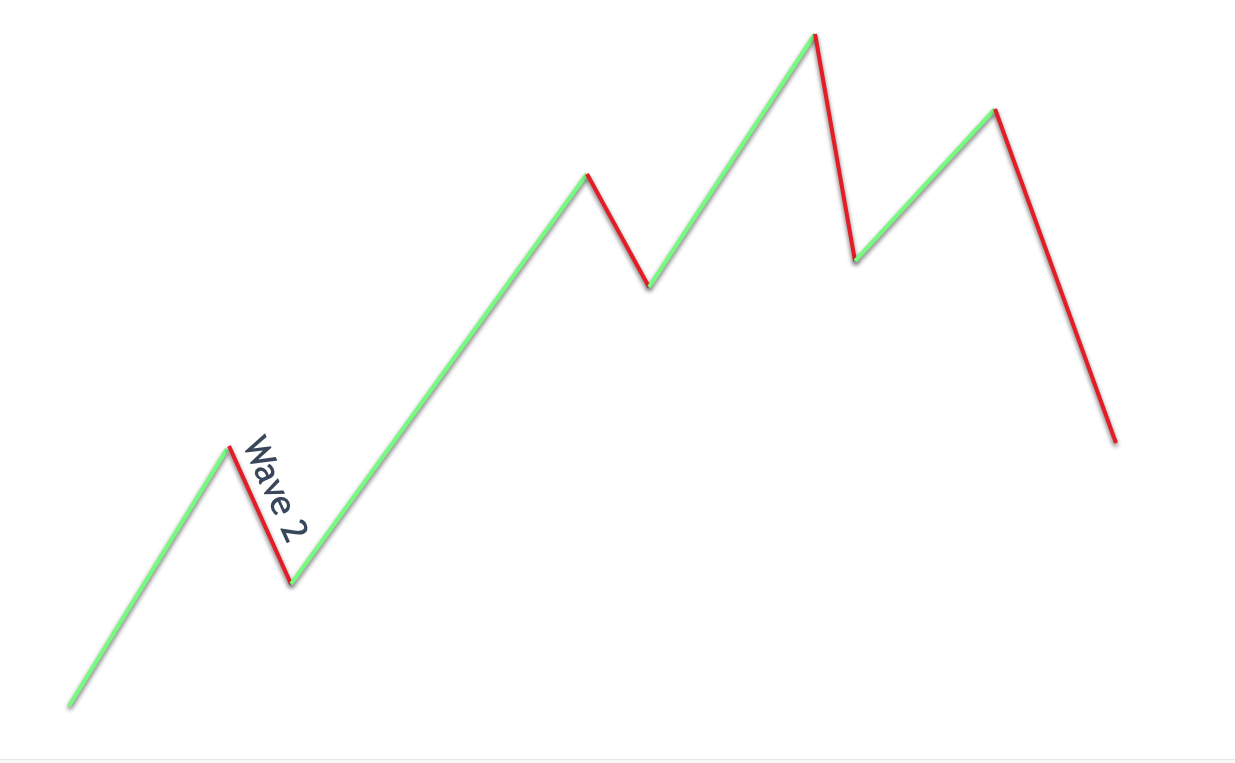
Wave two will generally take the form of a zigzag correction, or a flat correction. In either case the retracement will be fairly deep as noted earlier. Additionally, since wave two is a corrective structure, it will develop as an ABC pattern comprised of three waves.
Elliott Wave 3 Characteristics And Personality
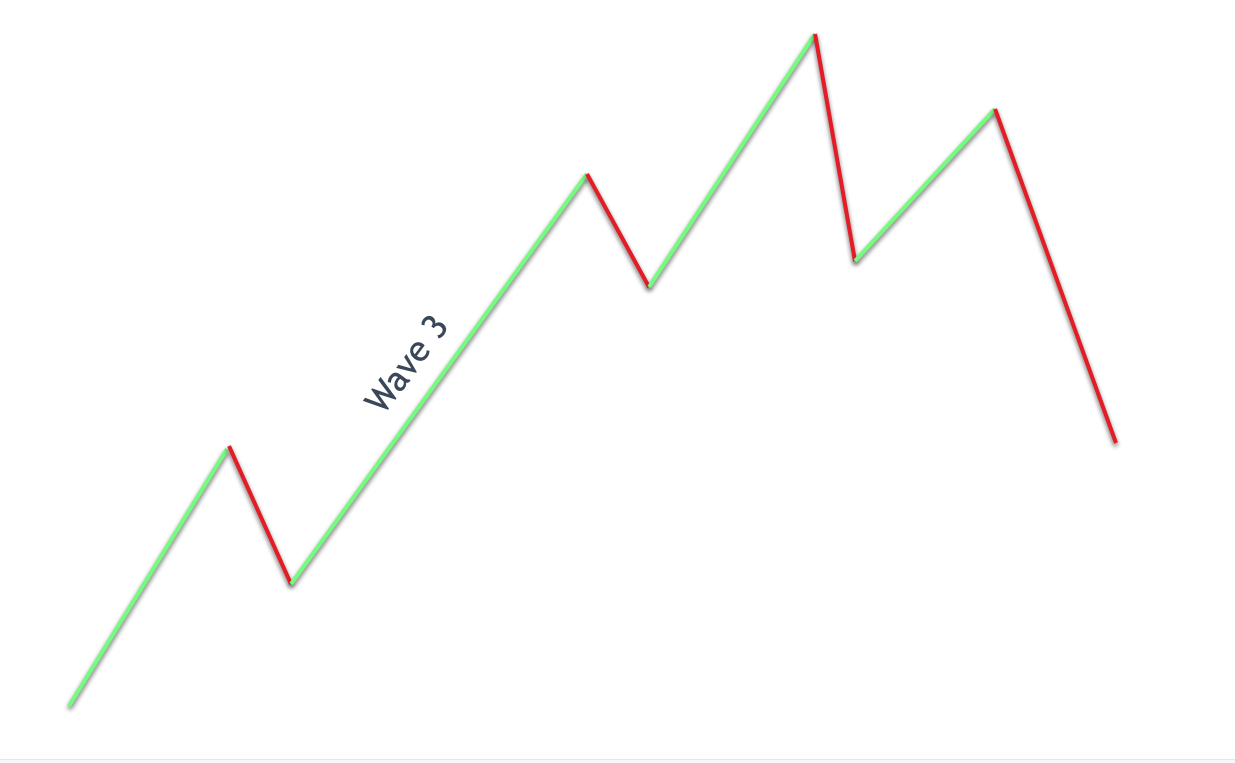
Let’s now move on to the personality of wave three. Robert Prechter, the leading authority on Elliott Wave theory noted of wave three that they are “wonders to behold”. Wave three offers the largest potential for profit as it is usually the biggest and most powerful wave within the overall Elliott wave structure.
The psychology of traders during wave three is generally one of growing optimism. Wave two has completed and wave three begins to move higher, and the economic environment can also be seen as improving. Although many of the earlier bears will still resist the optimistic outlook during the early stages of wave three, it will become increasingly evident to most traders that the tide has shifted, and the markets are poised to move higher.
Upon the break of the swing high of wave one, prices will begin to accelerate upward as more and more traders recognize the bullish sentiment and start taking long positions. Additionally, many bears will have their stops triggered at the wave one swing high, which adds further fuel to the upper price thrust.
Wave three is a time for swift action. That is to say that traders need to jump aboard the trend as quickly as possible in order to take advantage of the explosive moves that are characteristic of wave three. Those that wait for a pullback or retracement to get in will often miss the entire move, as wave three offers very little in the way of pullbacks, and when they are present, they tend to be quite shallow.
Wave three will often travel 1.618 times the length of wave one measured from the end of wave two. The second most common projection for wave three is for it to travel 2.618 times the length of wave one measured from the end of wave two. One of the guidelines within the Elliott wave principle is that among waves 1,3 and 5 of the impulse sequence, there will be one extended wave which is quite a bit larger than the other two. In most cases, wave 3 will be that extended wave.
Elliott Wave 4 Characteristics And Personality
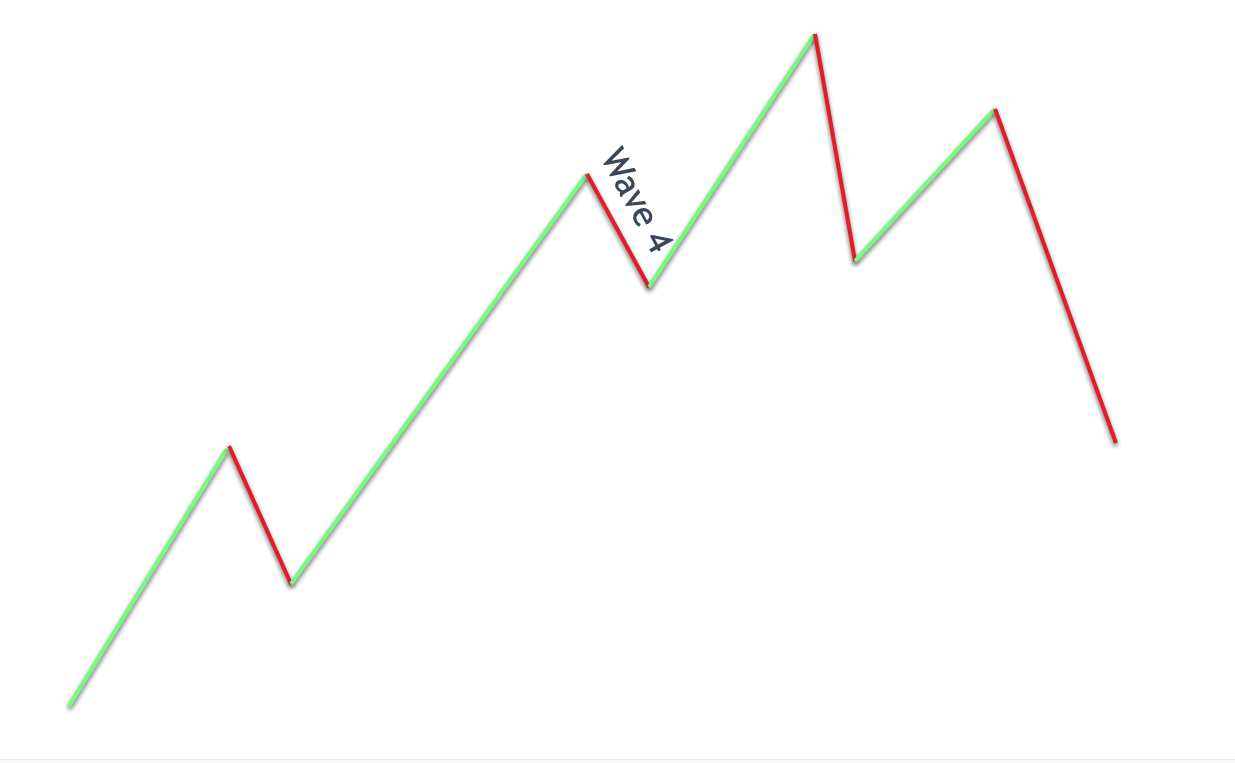
Let’s not continue to follow the Elliott wave structure and highlight the personality of wave four. Wave four will follow wave three and will retrace a portion of wave three. Typically, wave four will be a shallower retracement, and will often terminate at 38% or 50% of wave three. Since wave three is often the longest wave within the overall sequence, we can expect wave four to be less aggressive in percentage terms than wave two.
Also, we need to keep in mind one of the core rules within the Elliott wave theory during wave four. That is to say that wave four should not overlap into the territory of wave one. If it does, then you need to relabel your wave count as this is an unbreakable rule.
Wave four is often seen as a profit-taking wave. Because those traders that jumped aboard the trend early in wave three are sitting on a healthy amount of profits, many of these traders will begin to liquidate their positions and lock in their profits.
This creates a sideways price movement that is often prolonged in nature. Wave four often takes the form of a triangle. However, wave four can also be a flat formation, and sometimes it forms as a zigzag pattern or some combination thereof.
Regardless, we can expect wave four to transpire over an extended period of time. The price action often appears range bound with prices moving back and forth without any clear direction. Often when you are confused as to where you are within the entire Elliott wave market cycle, it’s often the case that you’re in the middle of wave four.
Often those trend traders that profited during the wave one and wave three price move will give back some portion of their profits during the wave four price progression. This is because wave four brings with it whipsawing price action that often generates false breakout on either side of the market. Traders need to be very careful when taking new positions during wave four as they are more likely to lose money during these directionless market conditions.
Elliott Wave 5 Characteristics And Personality
Wave five is the final leg within the Elliott wave impulse sequence. It moves in the direction of the overall trend similarly to waves one, and wave three. During the progression of wave five the economic and fundamental news is predominantly positive and almost everyone is bullish. Wave five is often considered a retail wave, because it is during this time that most retail investors begin to flock to the markets driving prices even higher, often to extreme valuations.
This is a time when even the most novice investors feel as if they are market experts, because they are making or have made sizable profits during the uptrend. But this recognition will not last for long as a large corrective phase will follow the end of wave five, which for many will serve to wipe out much of the profits realized during the impulse sequence.
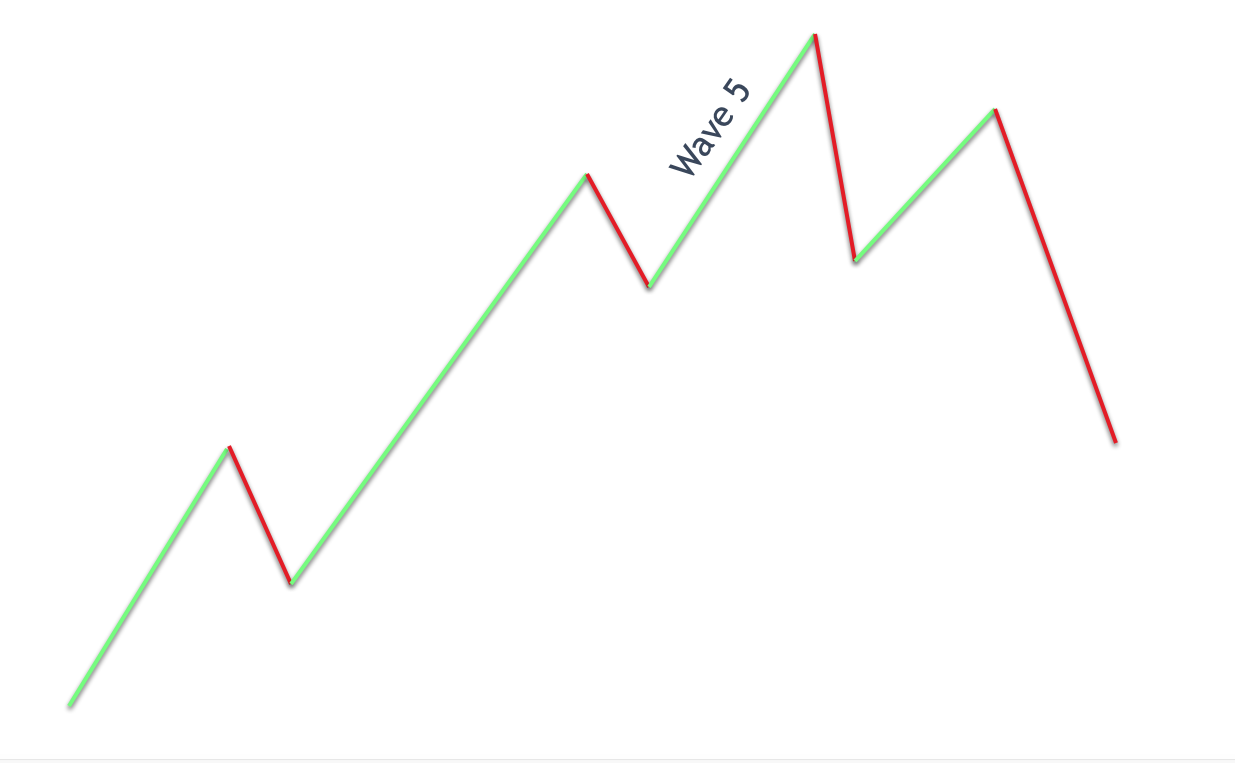
The momentum behind the bullish activity in wave five will be less dynamic than that during the wave three progression. That is to say that the velocity of the price movement will be more subdued than that seen during wave three.
It is during the late stages of wave five that we will also see technical divergence patterns form between the price action and many momentum indicators such as RSI, Stochastics, and MACD. What these momentum divergence signals are telling us is that the velocity of the price movement higher is waning, and as such we should expect the upside trend to reverse its course soon.
Along with momentum divergences wave five will often register lower volume than that seen in wave three. This is another indication that the trend is weakening and that profits should be locked in, as a potential reversal is imminent.
In terms of how far wave five will travel, one fairly reliable measurement for the termination of wave five is the following – wave five will terminate upon reaching a length that is equivalent to the length seen in wave one. The next most likely projection for wave five is for it to travel a distance of 61% the length of wave one. Both of these projections for wave five are measured from the end of wave four.
Elliott Wave A Characteristics And Personality
The end of wave five brings with it the completion of the impulse sequence. More specifically, the impulse sequence consists of waves one through five, and thus, at the termination of wave five, we can expect a corrective structure to follow which will often be a three wave affair and is labeled as waves A, B, and C.
Wave A kicks off the corrective sequence and during this phase, most traders are still very bullish, and consider the wave A pullback as just another minor retracement within the overall bull market. As a result, many traders will add to their positions averaging down as wave A progresses lower. These traders believe that they are getting a bargain because their expectation is that prices are likely to move higher in the near future.
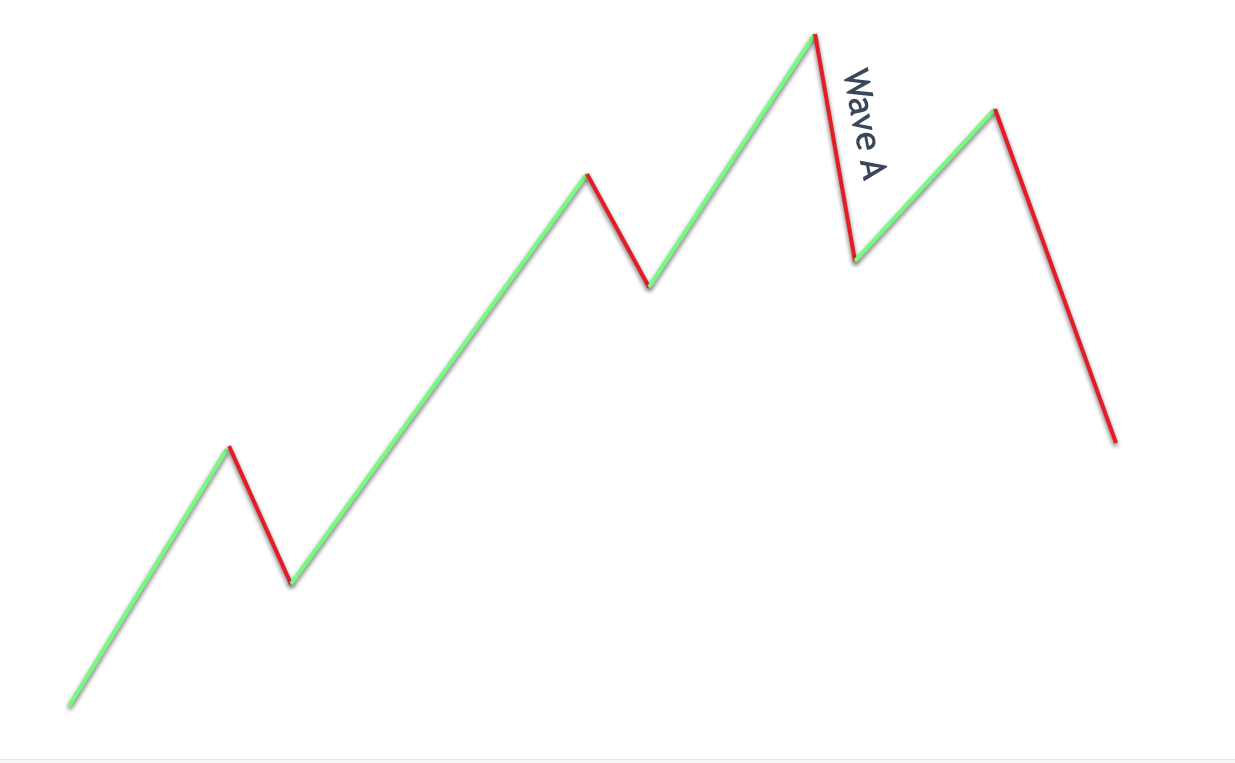
Wave A is somewhat similar to wave one in its structure and personality. During both of these wave progressions the market participants are overwhelmingly positioned on one side of the market or other depending on the direction of the larger trend. However, just as in wave one, some experienced traders begin to recognize the overbought market condition during wave five, and the writing on the wall that’s being presented by wave A, and these traders began to position for a potential reversal.
Wave A is often a sharp move and may subdivide as either a five wave affair or a three wave affair. In case it is a five wave affair, then we can expect the entire correction to most likely be a zigzag formation. On the other hand, if wave A subdivides as a three wave structure, then it is more likely that the entire ABC corrective structure will be a flat pattern.
Elliott Wave B Characteristics And Personality
Let’s now move on to the personality of wave B within the Elliott wave structure. Wave B is the second leg of the corrective structure and follows wave A. Wave B is often considered a bull trap, because it tends to draw in a lot of traders into believing that the existing trend is still healthy. However, this is far from the case. Wave B will be a fairly short-lived affair and will often fail to surpass the wave five swing high.
Many traders become trapped in their positions during the wave B price action. That is to say that these traders will either enter new long positions or add to their existing long positions at the very worst time.
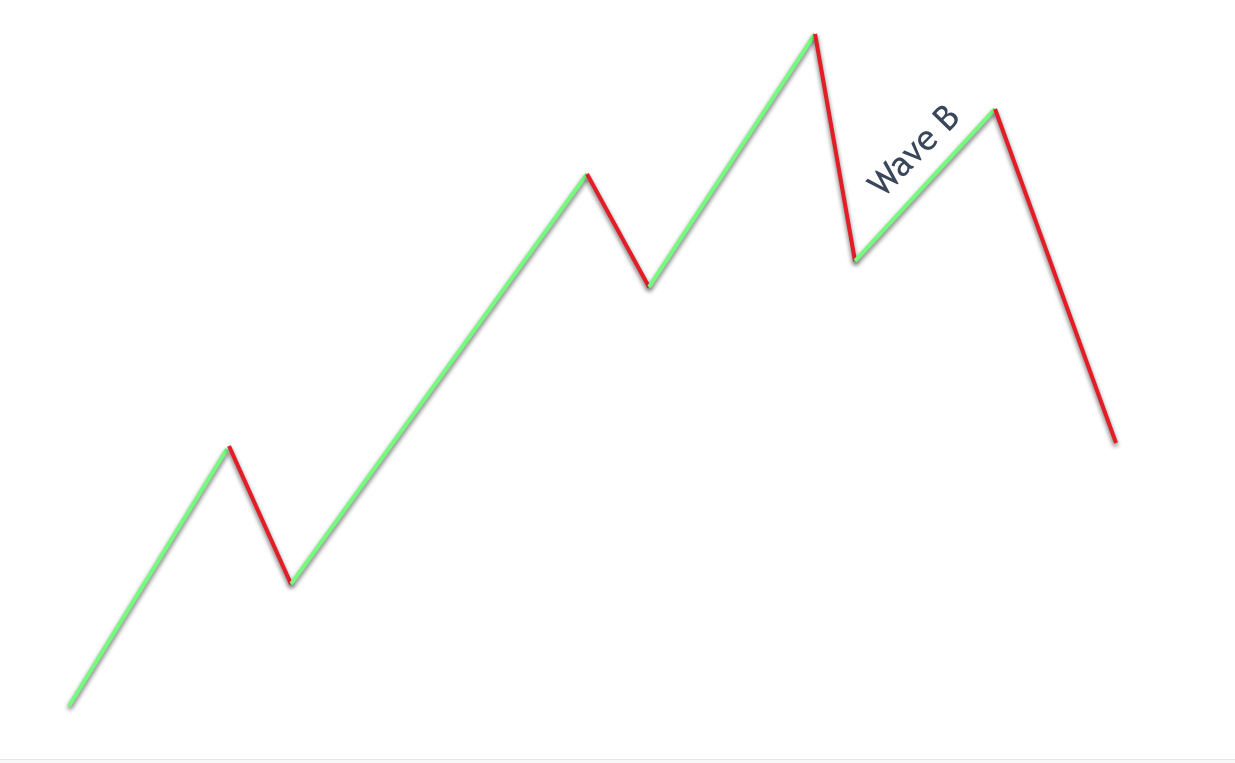
Wave B will often create a double top formation in which it will try to test the wave five extreme and fail to breach it. This does not always happen; however, it is quite characteristic for wave B to terminate just short of the wave five extreme. When wave B actually surpasses wave five, then we can expect that the overall ABC corrective structure is likely to form what is referred to as an expanding flat pattern.
Wave B is often a fairly deep retracement and will retrace wave A by either 50%, 61%, or 78%. The subdivision within Wave B itself is often seen as a zigzag pattern, but sometimes it will form as a triangle as well. Experienced Elliott wave traders know that one of the best trades within the Elliott wave sequence is to fade the wave B price move as it nears its terminal point.
Elliott Wave C Characteristics And Personality
After wave B completes, wave C will begin and this wave marks the final leg within the entire corrective structure, and also the entire 5-3 Elliott wave structure of one degree. Remember, that the impulse structure consists of five waves in the direction of the larger trend, while the corrective structure moves counter to the larger trend and is comprised of three waves.
During the early stages of wave C, many traders are still bullish on the market and believe the pullback to be a temporary one, which will eventually reverse in the direction of the larger trend. When the wave B swing low be is breached, that event will mark a turning point wherein more and more traders will become convinced that the uptrend has actually ended, and the market is poised for lower prices.
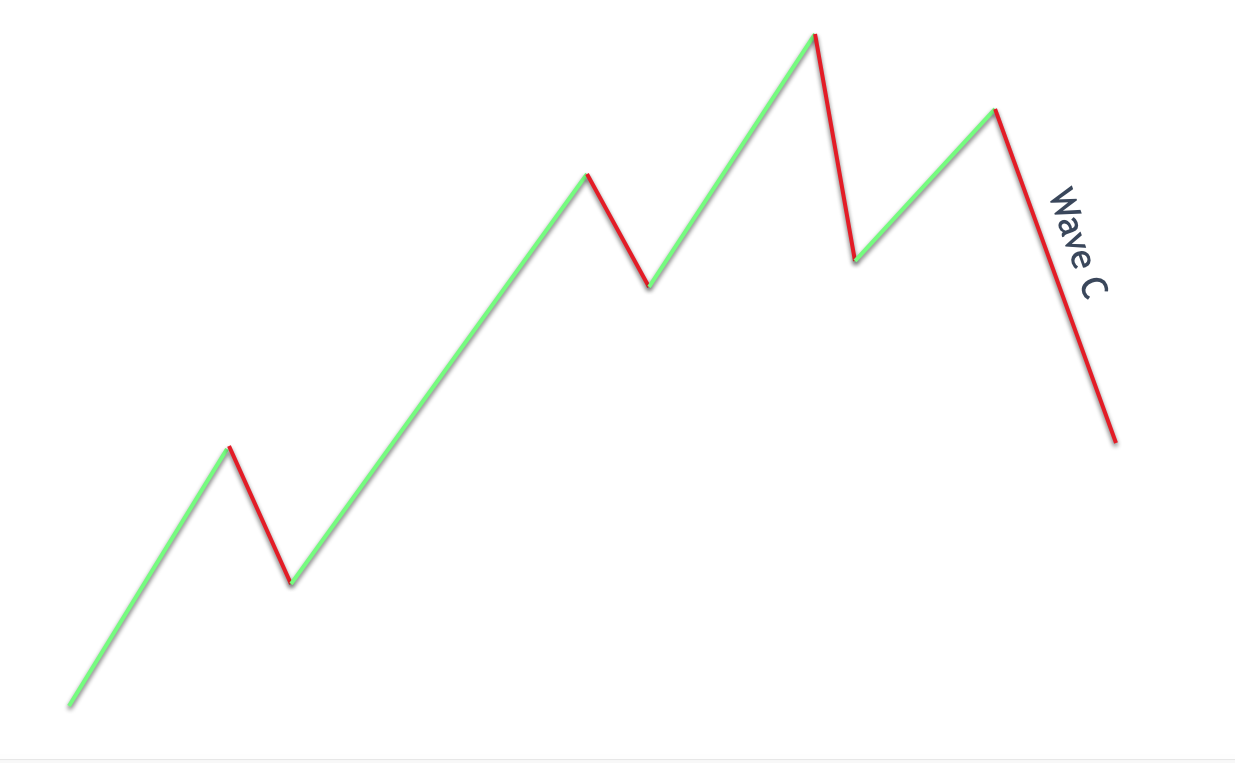
Wave C has many of the same characteristics as wave three. Both wave C and wave three tend to be relatively long waves and can be quite powerful from the momentum standpoint. Wave C is often equivalent to the length of wave A. The next most common relationship is for wave C the travel a distance of 1.27 times the length of wave A. After that relationship, the next most likely area for wave C to terminate would be when it has traveled the distance of 1.61 times the length the wave A.
As with wave five, we will often see divergence patterns form at the termination point of wave C. That is to say that the price will diverge with many different momentum indicators, indicating a weakening price move that is poised for a reversal.
Summary
Elliott wave is a more advanced technical methodology compared to most other price action based strategies. Having said that, it is by far the best in terms of its predictive value. Traders that are serious about gaining unique insights into the market that can be translated into profits need to understand market structure from the perspective of Elliott wave. In this lesson, we’ve highlighted some of the basic personality and characteristics of the different waves within the Elliott wave structure.
We’ve tried to provide a good solid foundation for understanding the Elliott wave theory, however, there is much more to learn about how to apply Elliott wave profitably. As such, you’re encouraged to learn as much as you can about this form of technical analysis as it will inevitably help you progress along trading journey.