One of the big questions that many new traders ask is how to trade market bounces correctly? The market bounce trade seems to be a setup that always captures the attention of new traders in particular. However, trading market bounces is often the mainstay of professional and experienced traders also.
A well-executed bounce trading strategy can yield powerful results. Traders can buy bounces or sell bounces depending on the market conditions and the underlying tone of the price action, meaning that a market bounce can either offer the opportunity to participate in the recovery, profiting as the market goes higher, or the market bounce can offer the potential to initiate a sell trade, profiting as the market sells off again.
So, in this article, we are going to break down exactly what a market bounce is. We’ll take a look at some of the different ways to identify a bounce and talk through some different options when it comes to trading a market bounce including both how to buy and sell bounces depending on the market conditions.
What Is A Market Bounce?
A market bounce is very simply, a period of price action when price pops higher during a downtrend. Market bounces occur in all asset classes, trading instruments, and trading timeframes.
In the chart below you can see highlighted sections of the chart where price has popped higher during a downtrend. We know the market is in a downtrend because price is broadly moving from the top left of the chart to the bottom right.
However, in all downtrends, there will be periods when the market bounces and price pops higher.
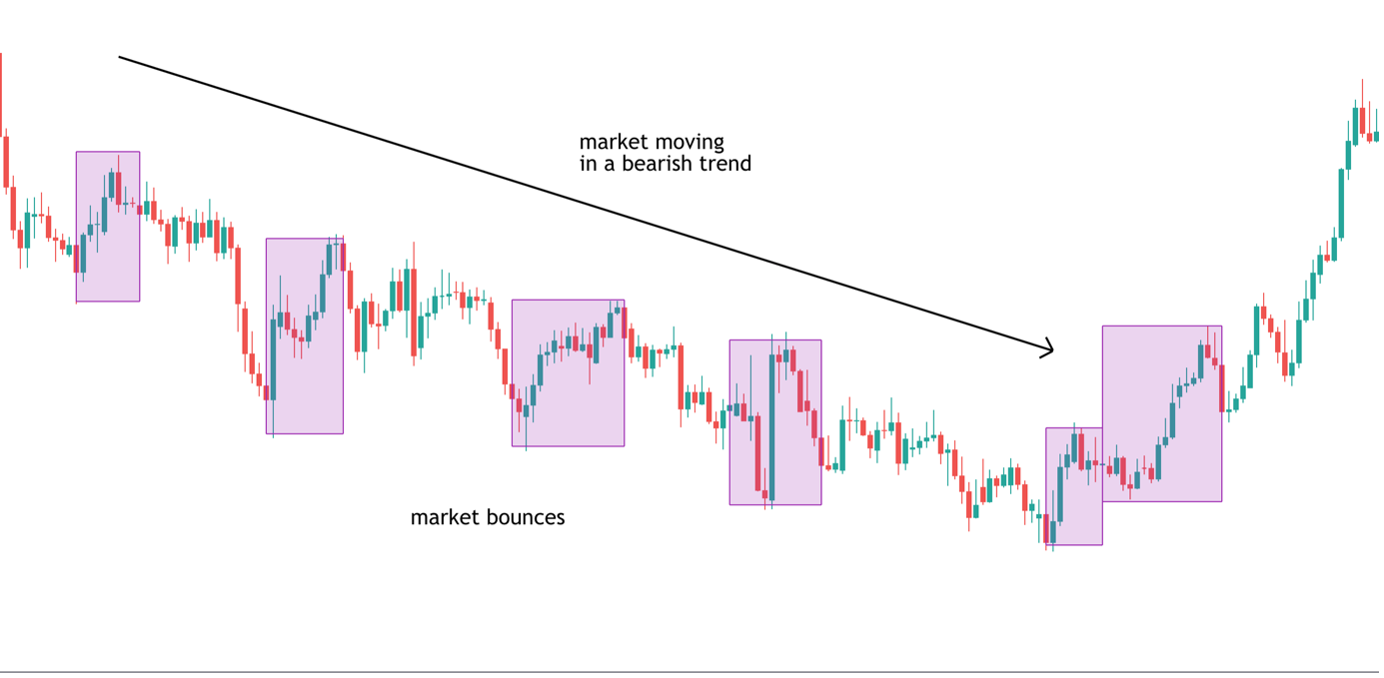
These bounces occur to varying degrees, sometimes only mild bounces and sometimes sharp moves to the upside. A market bounce can turn out to simply be a correction within a downtrend, or sometimes it can form the start of a broader reversal and recovery higher.
Now, looking at this chart you can see that the majority of these bounces ended up being short-lived corrections where price would move higher and then run into selling pressure and reverse lower, continuing the down trend. However, you can see that the final bounce highlighted actually created the foundation of a trend reversal and a broader move higher. So, just looking at this chart alone we can get a sense of the opportunities that are available to us when it comes to trading market bounces.
What Causes A Market Bounce?
Market bounces are simply caused by the changing, underlying order flow which develops during a trend. In any trend, there are periods when the trend intensifies and when the trend weakens. So, with price moving lower in a downtrend, we know that sellers are in control, driving price lower.
However, at certain points selling pressure dries up, and buying pressure builds and this leads price to bounce. This can occur as a result of traders covering their short positions ahead of certain news events or ahead of the weekend. It can also occur as a result of traders taking profit on positions as their targets are. These short-term supply/demand imbalances are what create the market bounce and are also why most bounces turn out to be simply short-lived corrections.
Trading Market Bounces
So, now that we know what a market bounce is, what it looks like and what causes it, the next question is, how do we trade market bounces? As we’ve briefly touched on, a trader can buy bounces or sell bounces so let’s first off take a look at selling bounces.
Selling Market Bounces
Selling market bounces is a great way to trade with the trend. As we saw in the chart above, if price is moving within a downtrend, a market bounce offers a great opportunity to enter a sell trend at an advantageous price and profit as the downtrend resumes. However, many new traders might be asking themselves, how do you know when the bounce is ending and it’s time to sell.
Selling Market Bounces with Technical Indicators
When it comes to helping us trade market bounces, technical oscillators can actually be a very helpful way to find the right place to execute a trade. One such indicator that works very well with selling market bounces is the stochastics indicator. The stochastics indicator is a momentum indicator that identifies when price is overbought or oversold. When price is overbought, this means that buying momentum is stretched and is vulnerable to snapping back with price moving lower.
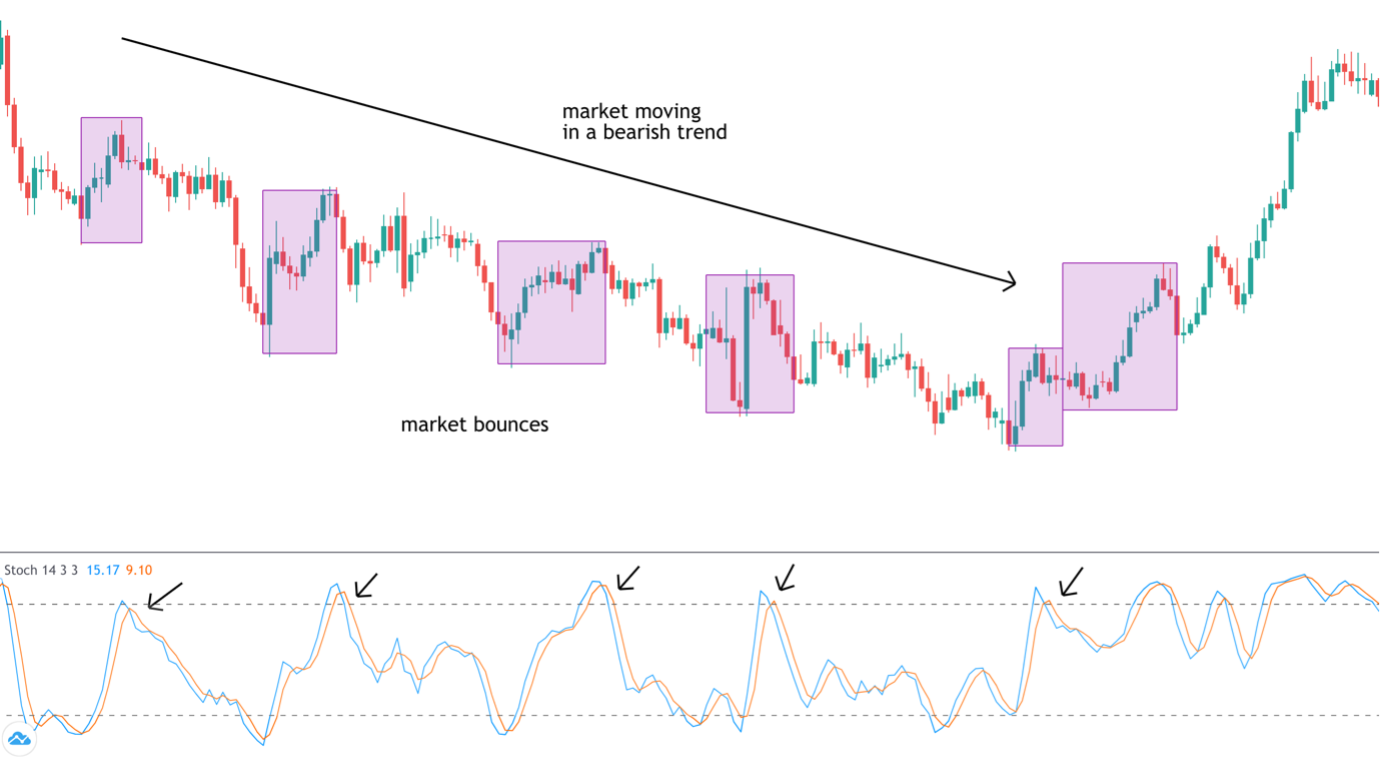
So, looking at the image above again but this time with the stochastics indicator turned on you can see that there are several areas when the indicator moves above the upper threshold, telling us that buying momentum is overstretched and price is vulnerable to reversing lower. You can see that these points where price crosses above the threshold typically line up with the market bounces.
So, one great way to trade market bounces is to wait for price to bounce higher and look for the indicator to move above the upper threshold telling us that buying momentum is overstretched.
Then, once the indicator moves back below the upper threshold, this tells us that buying momentum is reversing and the market bounce is likely over. At this point we can go ahead and place our sell trade, looking for the bearish trend to continue.
The beauty of using the stochastics indicator to help you trade market bounces is that it gives some extra confirmation when taking the trade. Oftentimes, a market bounce will occur, and the trader will be unsure of exactly when to take a sell trade to capitalise on the bounce reversing and the downtrend continuing.
Using the stochastics indicator is therefore a great way of trading market bounces because it removes some of the uncertainty and is a simple and easy-to-use tool when it comes to placing a trade.
Using Trend Lines to Sell Market Bounces
Another great way to sell market bounces is to use trend lines. Trend lines are diagonal lines that a trader applies to a trend to map the key points within that trend. So, for a bearish trend line, the trader will apply a line sloping downward which connects key swing highs (market bounces).
Once a trend line has been established by connecting two price points, the trader can then look to use the trend line as resistance, meaning that as price tests the trend line subsequently, the trader can place a sell trade.
The beauty of using this method is that it gives the trader an exact location to place their trade, at the point price touches the trend line. It is also a very easy way of measuring the strength of the trend. If price is respecting the trend line this means the market is in a strong bearish trend and is likely to continue moving lower, creating further selling opportunities.
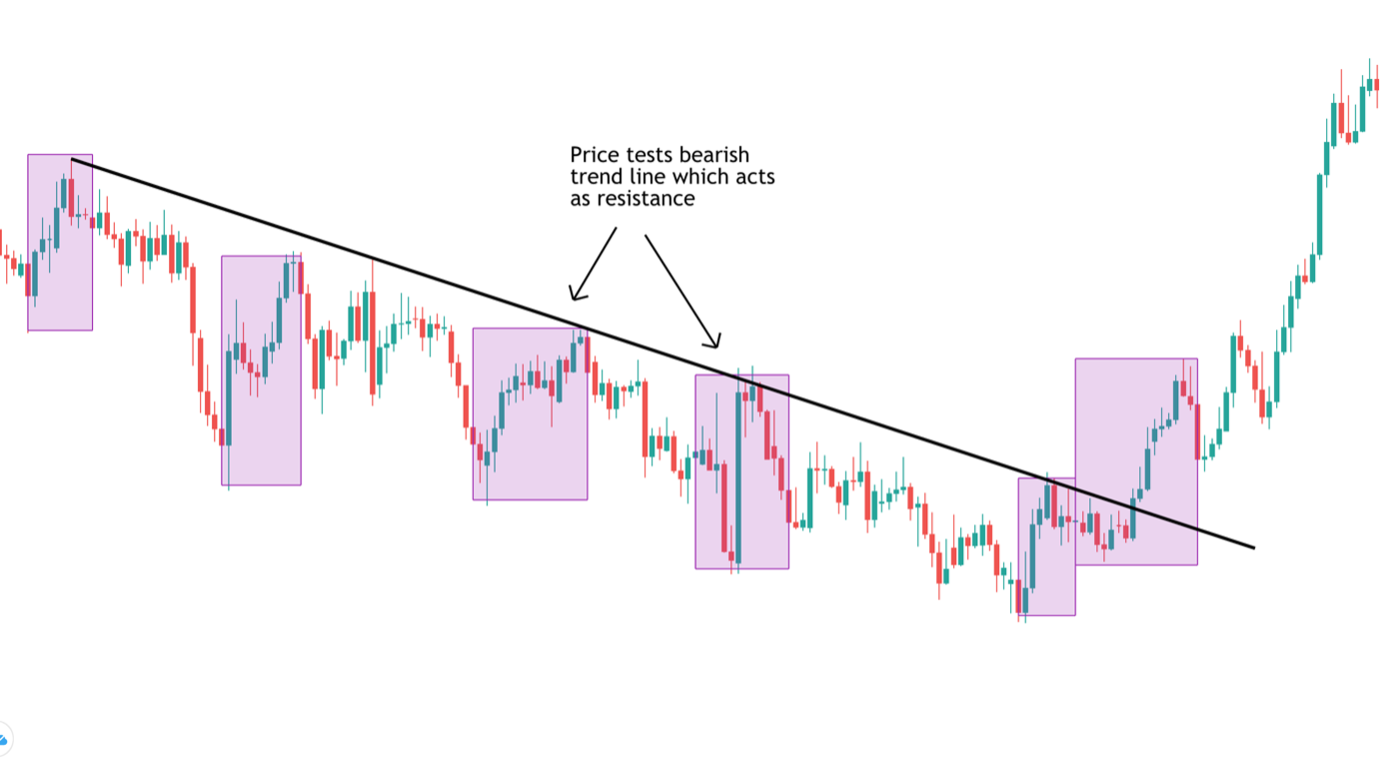 In the image above you can see a great example of how using a bearish trend line, we can capture great market bounce trades. Once we have established our trend line by connecting the first two swing highs, we can see that price tests the trend line a further three times before the trend line breaks. So, that means that once we have established our trend line, there are two market bounces that see price trading up to test the trend line, giving us our opportunity to sell.
Trend lines are a fantastic tool when it comes to selling market bounces because they are easy to identify and give the trader a clear view of where to place their trade. Furthermore, if price breaks above the trend line this can be an early signal that a market bounce is potentially turning into a bigger correction or even a reversal, offering buy opportunities which we will explore shortly.
Buying Market Bounces
So, we’ve now looked at a couple of really great options when it comes to selling market bounces. Understanding that most bounces tend to be corrections within a trend, we’ve identified ways we can capitalise on this price action to place a sell trade, including using the stochastics indicator and trend line.
However, as we briefly touched on in the last section, there are times when a market bounce turns into a reversal or a breakout bounce. With this in mind, it is also important for traders to understand trading a breakout bounce and how to buy bounces.
A breakout bounce trade can be a little trickier because we are technically going against the trend. However, a good market bounce trading strategy can be a powerful method because it helps the trader get in early on a reversal.
Using Trend Structure to Trade Market Bounce Breakouts
When it comes to trading breakout bounces, one of the best methods is to simply use the market trend structure. So, we know that a bearish trend is a series of lower lows and lower highs, with the market moving downward in staircase formation if you will.
With this in mind, we know that as the market continues within this formation the trend is healthy and the market is likely to continue lower. However, if this structure is violated, we know there is a chance the trend is coming to an end and price is vulnerable to a bigger reversal higher.
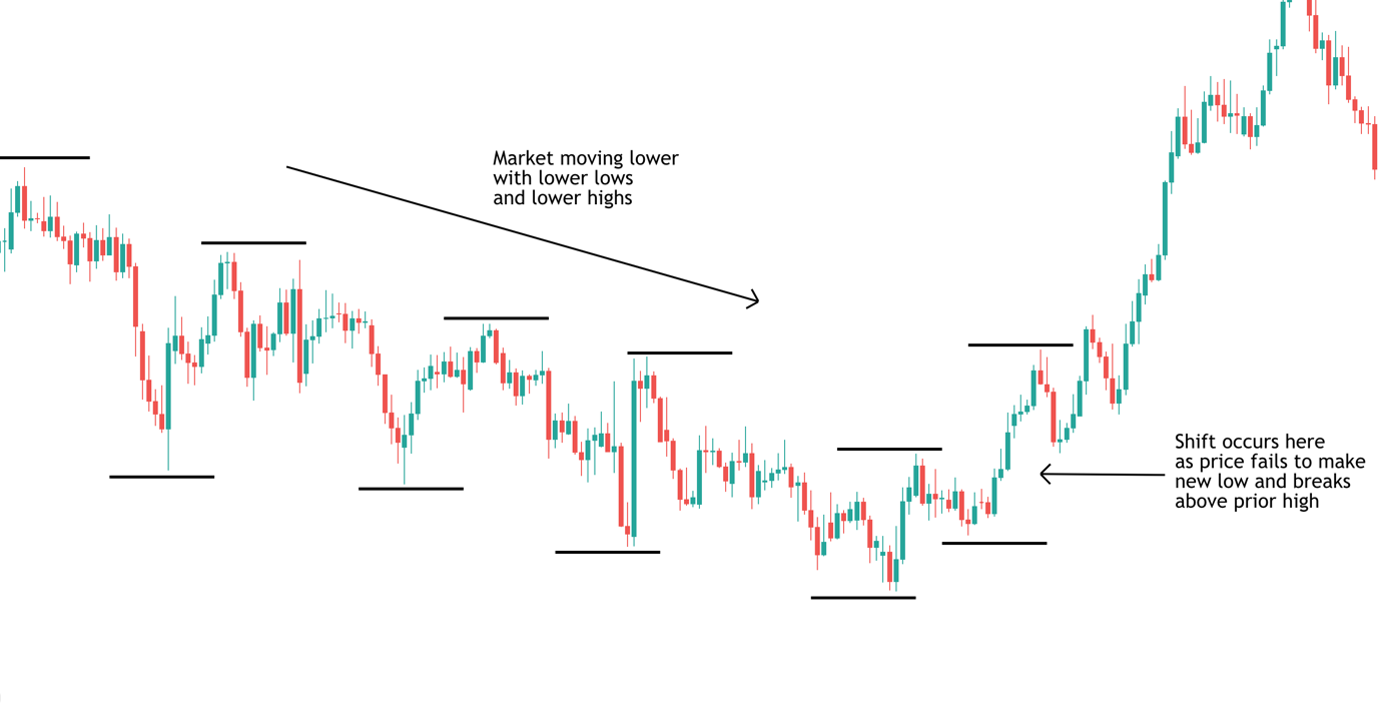 In the image above you can see how the market is initially moving in a classic bearish trend formation. Price is making a series of lower lows as the trend expands and then a series of lower highs as each correction meets selling pressure, taking the market lower. However, at the end of the downtrend, notice the subtle shift in structure.
Price fails to break down past the last swing low in the trend, and instead trades back up and makes a high above the last swing high in the structure. So now, for the first time in the formation we have a new high and a higher low. This alerts us to a change in the market trend.
In terms of how we would trade this market bounce, the best option is to place a buy trade as price breaks above the last swing high in the downtrend. Because we know that in a downtrend, price should always be making lower highs, we know that if price moves above that last high, there is a likelihood that the trend is reversing, and we can place a buy trade and trade the market bounce breakout higher.
Buying A Market Bounce with Technical Indicators
As we saw with selling a market bounce, indicators can be highly useful when it comes to confirming a trade idea and finding an exact trade location. When it comes to buying a market bounce, technical indicators can be just as useful.
One particularly useful indicator is the moving average. A moving average essentially acts as a price pivot on our charts. The rule of thumb is that if price is moving below the moving average, the market is in a bearish trend. Alternatively, if price is moving above the moving average, then price is in an uptrend.
So, with this in mind, we know that if price is moving in a healthy downtrend, price will be contained beneath the moving average. This means that any market bounces which occur under the moving average are likely to just be a corrective bounce. However, if the market bounce sees price breaking above the moving average, this can be a signal to trade the market bounce breakout.
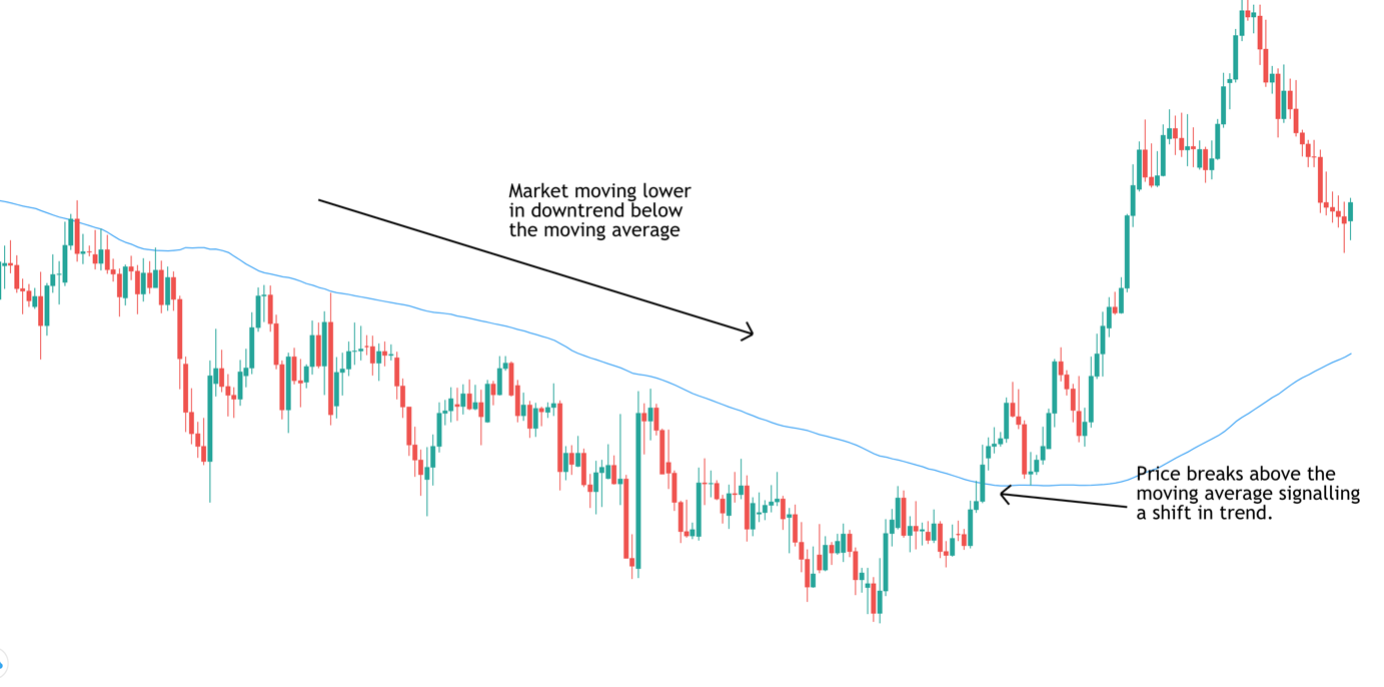
In the image above we can see our bearish trend but this time we have the moving average indicator turned on and set to the 100 period, which is a classic moving average length on the daily chart. You can see that while the downtrend is in good health, each market bounce is contained by the moving average which in places, even acts as resistance (another great tool if you are looking for a selling idea).
However, at the point that the trend shifts, you can see that the market bounce actually breaks above the moving average. So, at this point we know that the market bounce might actually be the start of a reversal higher, offering us the opportunity to place a buy trade.
Waiting for a Retest of the Moving Average
Another option here, which is for the slightly more conservative traders is to wait for price to retest the broken moving average once it has moved above.
So, looking at the image again you can see that after price breaks out above the moving average, signalling a potential trend shift, and then the rally runs into selling pressure. Price reverses lower and trades back down to retest the broken moving average.
Now at this point, if the move was a false breakout the market bounce will reverse and price will trade back under the moving average. However, you can see what happens here is that price actually finds support as it tests the moving average and then continues higher again as buying increases. So, this is a great sign that the market bounce is turning into a full reversal.
Key Things to Remember When Trading A Market Bounce
Stay with the Trend to Start
As with all technical setups and strategies, the more time you spend studying the charts, the better you will get at identifying market bounces and learning to trade them. One good rule of thumb is to look to trade with the trend until there is a change.
So, in the example we have been studying above, we saw how price respected the bearish trend line, the bearish trend structure and stayed below the moving average up until the point where the trend reversed. This means that while price is respecting the trend, traders should look to sell market bounces as corrections. Staying with the trend has a better risk-reward profile and is certainly advisable for new traders.
Wait For Trend Break
Once the trend has been challenged, meaning that once we see price break above the trend line or above the moving average or once we note that the structure has shifted, this means that we can start looking to buy. The chances of a reversal have increased. Catching a reversal can be a profitable trade but traders should certainly not be looking to trade each market bounce as if it is a breakout trade. As always, when trading, make sure to use a stop loss to protect yourself from any adverse market moves and always aim for a target of at least two times your risk to ensure a positive risk-reward ratio.
Conclusion
Hopefully now you have a much better understanding of how to trade a market bounce, whether that be looking to sell a bounce as a correction within a trend or looking to buy a bounce as a breakout. Now its times to get to the charts and do some studying. One final thought is that the technical indicators we’ve looked at today are by no means the only indicators that can be useful when trading market bounces.
So, if there are any indicators you like in particular, spend some time studying how they interact with market bounces based on the principles shared in this article and you should find you will be able to incorporate them into trading market bounces also. You might even be able to come up with your own market bounce trading strategy.