Trading breakouts is a popular and viable trading strategy. However, as all breakout traders are aware, some breakouts will not materialize and turn out to be fake or false breakouts. This can be quite frustrating, not to mention it can often result in a losing trade.
But many times, a skilled trader can sense what is happening behind the scenes and react quickly to this type of situation in the market. In fact, false breakouts and fakeouts can be profitable setups when you know how to trade them. In this article, we will take a closer look at this topic, and present some ideas for taking advantage of fakeouts in the FX market.
What are False Breakouts in Forex?
False Breakouts are occurrences on the chart when the price breaks an obvious level, but then suddenly changes direction. When the initial breakout happens, many traders are lured into the trade by entering the market in the direction of the breakout. These traders become trapped when price reverses, resulting in a cascade of stop loss orders being triggered. New traders enter the market as well sensing what is happening, and this acts to put further pressure on price. Very often this reaction evolves into a new trend opposite to the initial breakout –the false break.Below you will find an example illustrating a false breakout and reversal.
Above you see an example of an Inverted Head and Shoulders chart pattern that is marked in blue. The magenta line is the Neck line of the pattern, and considered the signal line.
In the red circle we see an upside breakout through the Neck Line of the pattern. This provides confirmation for the Inverted Head and Shoulders pattern, and creates a strong bullish potential on the chart. However, we see that the price action quickly rejects this bullish breakout.
The price reverses sharply and creates a bearish move that is approximately equal to the size of the Inverted H&S pattern. Therefore, we say that the breakout in the red circle was a false breakout, also known as a fakeout.
The Power of the Fakeout Pattern
After you have been on the wrong side of a breakout a few times, you should begin to realize that these fakeout formations can actually provide high quality tradable opportunities. If you manage to identify a false break on the chart, then you can take advantage of these opportunities and position yourself for the reversal leg.
In fact, some traders design their entire trading strategy around these types of scenarios, as it can be a very powerful trading approach. Some of the best trades occur when market players become trapped and begin to cover their losing trades.
So, if the false breakout is to the upside, you can short the Forex pair on the assumption that a pullback in bearish direction is on its way. Contrary to this, if the false breakout is to the downside, then the expected pullback will be bullish, creating a long opportunity on the chart.
Sounds simple, right? Yes, but there is one major detail here. You must learn how to anticipate and distinguish a fakeout from a real breakout. And the best way to do that is by studying your charts on historical data and putting in the required screen time. Eventually this should become second nature to you.
How to Identify False Breakout Patterns
This is the trickiest part of trading false breakouts. If you don’t learn how to identify a false breakout properly, you won’t be able to trade them profitably. For example, there will be times when you misread the price action for a false break and price returns back to the breakout point only to confirm the initial breakout and continue in the direction of that initial breakout.
One way to identify false breakouts is by keeping an eye on the trading volume. Real breakouts are usually accompanied by strong trading volume readings in the direction of the breakout. When this volume is absent, there is a higher chance of the breakout not materializing. So if the trading volume is low or decreasing during a breakout, then you are probably looking at a breakout trap. Contrary to this, if the trading volume is high or increasing, then you probably have a real breakout occurring on the chart.
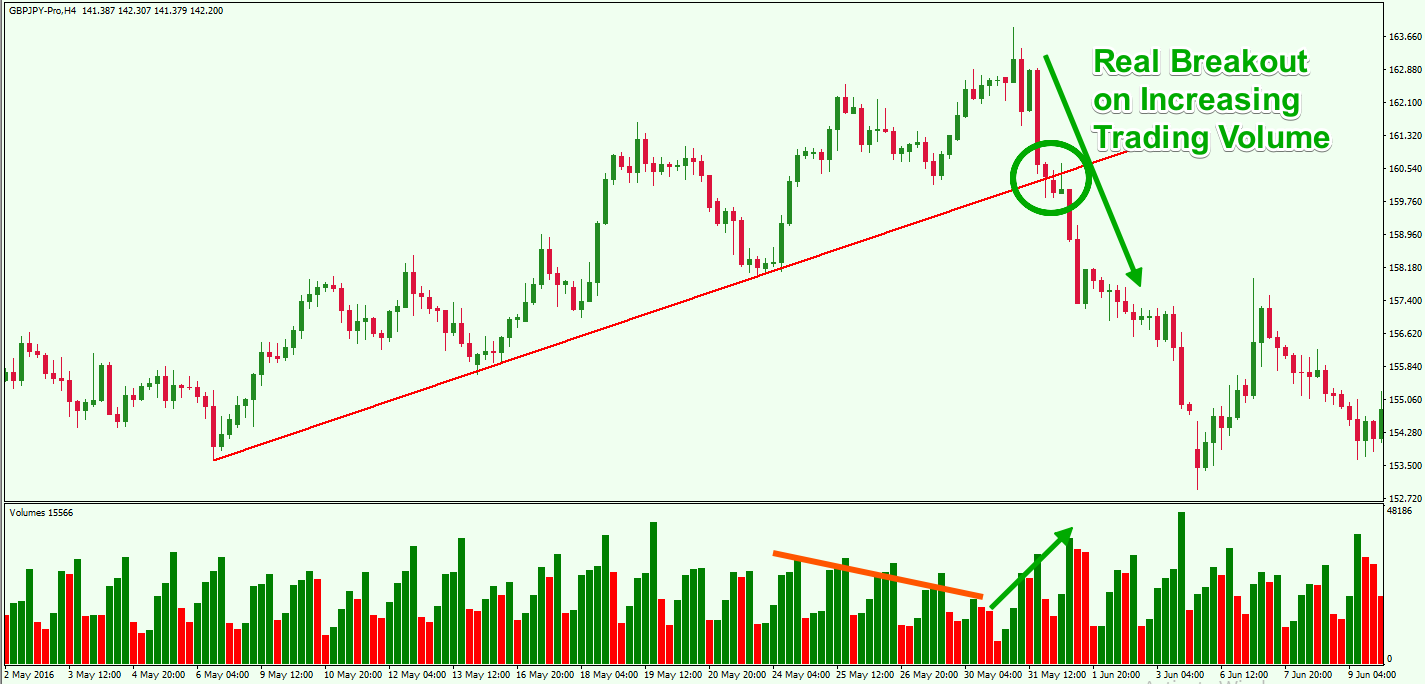
Above you see an example of a breakout that occurs in a bullish trend. We have the Volume indicator added to the bottom of the chart. Notice that the Volume indicator is showing increasing trading volume at the time of the breakout. After the breakout, the price continued in the direction of the break. This breakout is confirmed by volume, and as such it creates an attractive opportunity to trade the trend line break to the downside. Now, let’s take a look at a fakeout pattern:

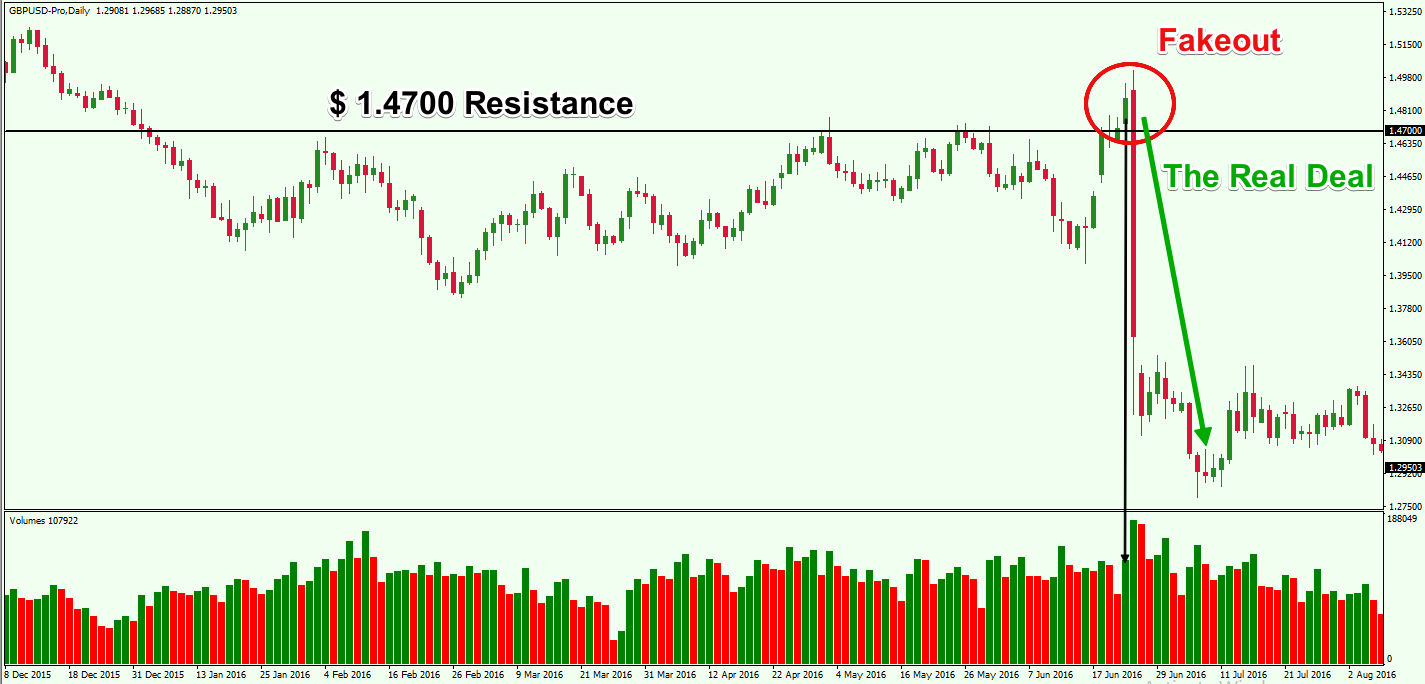
The example above is a fakeout play which shows a resistance level at $1.4700. On the fourth test of the level, the price closes a candle above the $1.4700 resistance – something that has not happened during the previous tests. Many traders would be hopping in on the long side of this trade.
In this case, however, the Volume indicator does not provide us a great deal of information. The tiny vertical arrow points to the bar that concerns the respective period.
Nevertheless, price reverses sharply. The Volume indicator shows an average reading at the moment of the breakout, but it leads to a fakeout pattern. So, even though the Volume indicator is useful, it is not foolproof. Sometimes it helps to move down a timeframe to get a more granular view of price action and see if there is additional supporting evidence of a breakout or fakeout.
This is why you should carefully monitor not only trading volume but also price action on the lower timeframe. In many cases, you will see that the price creates a very sharp pullback on the lower timeframe which is not apparently visible on your trading timeframe.
As we mentioned, trading breakouts and fakeouts is not always clear cut and easy. In many cases, you will see that what you considered as a fakeout pattern is actually a real breakout. This is why you should be very careful to monitor price action closely when trading this tricky pattern.
False Breakout Strategy in Forex Trading
In order to stay disciplined when trading fakeouts, you should create a specific set of rules that will guide you when these patterns occur in the market.
Entry Point when Trading Fakeouts
Timing your entry is critical when trading fake breakouts. When you see a break out of an obvious level, and the volume is low or decreasing, you could enter the market when the price returns to test the level. If the return occurs with a higher momentum compared to the break, then the price is likely to be a false breakout.
If the key level is broken in a bullish direction on low volume, you could short the Forex pair on the bearish pullback. If the key level is broken in a bearish direction on low volume, you could buy the Forex pair on the bullish pullback.
Note that the key level could be in many forms. This could be a horizontal support or resistance level, a diagonal trend line, a parallel price channel, a Fibonacci level, a Pivot Point, a chart pattern, a candle pattern, etc.
Stop Loss on Fake Breakouts
Risk management is crucial when trading fakeouts as prices tend to be volatile around these areas. As mentioned earlier, in some cases a real breakout pattern can be disguised as a fakeout and test the key level and then continue in the direction of the original breakout. Therefore, you should always protect your trade with a Stop Loss order. This is the best way to limit your risk when trading the fakeout pattern. So where should you place your stop loss order when trading a fake breakout play? The best place for your stop is usually on the opposite extreme of the initial breakout. Let’s take a closer look at this:
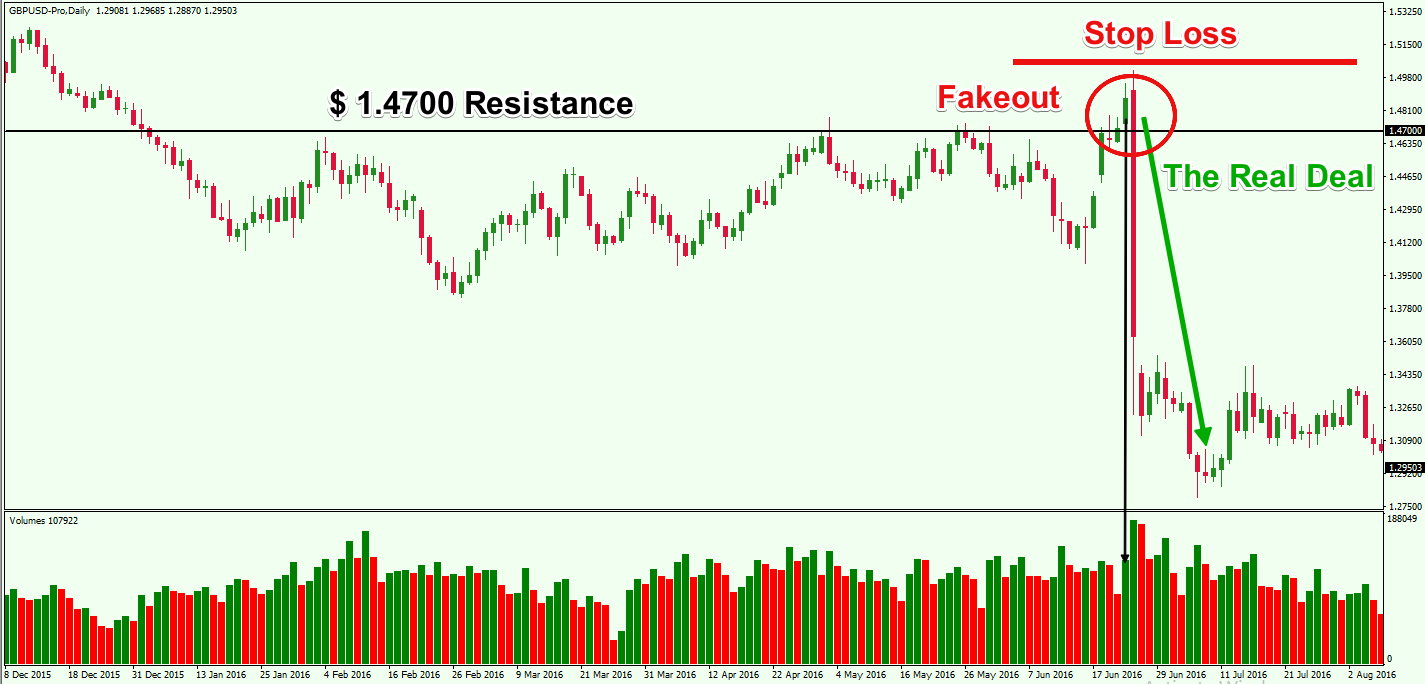
This is the same chart image we used for the previous example. However, this time I have indicated the proper place for the Stop Loss order.
In many cases, the Stop Loss order will be relatively close to your entry point, which will give you a very attractive Risk Reward ratio. Since the price is likely to reverse sharply after the fakeout, you will be able to position the Stop loss fairly tight. After all, if the price breaks this level, then it will be very likely that price action is confirming that this is actually a real valid breakout.
Targets in Fakeout Trading
There is no specific target when trading fakeouts. Chart patterns are an exception since most of them are likely to suggest a target at a distance equal to the size of the pattern.
If the fake breakout occurs within a chart pattern, simply measure the size of the formation and apply it from the opposite side starting from the fakeout price extreme.
When you identify the fakeout pattern on low trading volume, you are likely to see a pick up in the volume during the time of the pullback and beyond.
Therefore, you should hold your trade as long as the volume is strong during the impulse move. If you spot a drop in the volume, then the price move might be getting exhausted, and it might be wise to close the trade and collect your profit at that time. Also, never forget to keep an eye on the price action. It is always a helpful approach when looking for your exit point.
Example of Fakeouts in Fx Trading
Now that you are familiar with how fakeouts work in Forex, I will give you a few additional examples that should make the picture even clearer.

Above you see the H1 chart of the GBP/USD Forex pair for the end of May 2017. At the bottom of the chart, we have the Volume indicator. The example shows a bullish trade that could be taken on the assumption of a false breakout and a reversal.
Notice that there is a strong support level at 1.2790 that has been tested several times. Suddenly, the price action closes a bearish candle below that support level. This has not happened during the last three tests. And so, at first glance, this looks like a viable breakout opportunity to the short side.
However, let’s examine the trading volume leading to the breakout. It does not seem to be confirming that breakout. The trading volume has been steadily decreasing, and as a result the breakout is suspect.
Notice the price rejection represented by the bullish engulfing candle pattern. This could be used to open a long trade on the assumption that the price is likely to create a sharp increase.
You should protect your trade with a Stop Loss order of course. You can never be sure that the price will not return below the support level. The proper location for the Stop Loss order is below the Engulfing pattern.
Fortunately, the price increases sharply creating the pullback we are waiting for. Meanwhile, the Volume indicator readings are registering a couple of very big bars. This supports the idea that the real price move is actually to the upside. Afterwards the trading volume begins to get muted, which corresponds to the price decrease. You could close the trade when the very small volume bar prints as shown on the chart.
Now let’s discuss another trading example using the concepts we have discussed thus far:
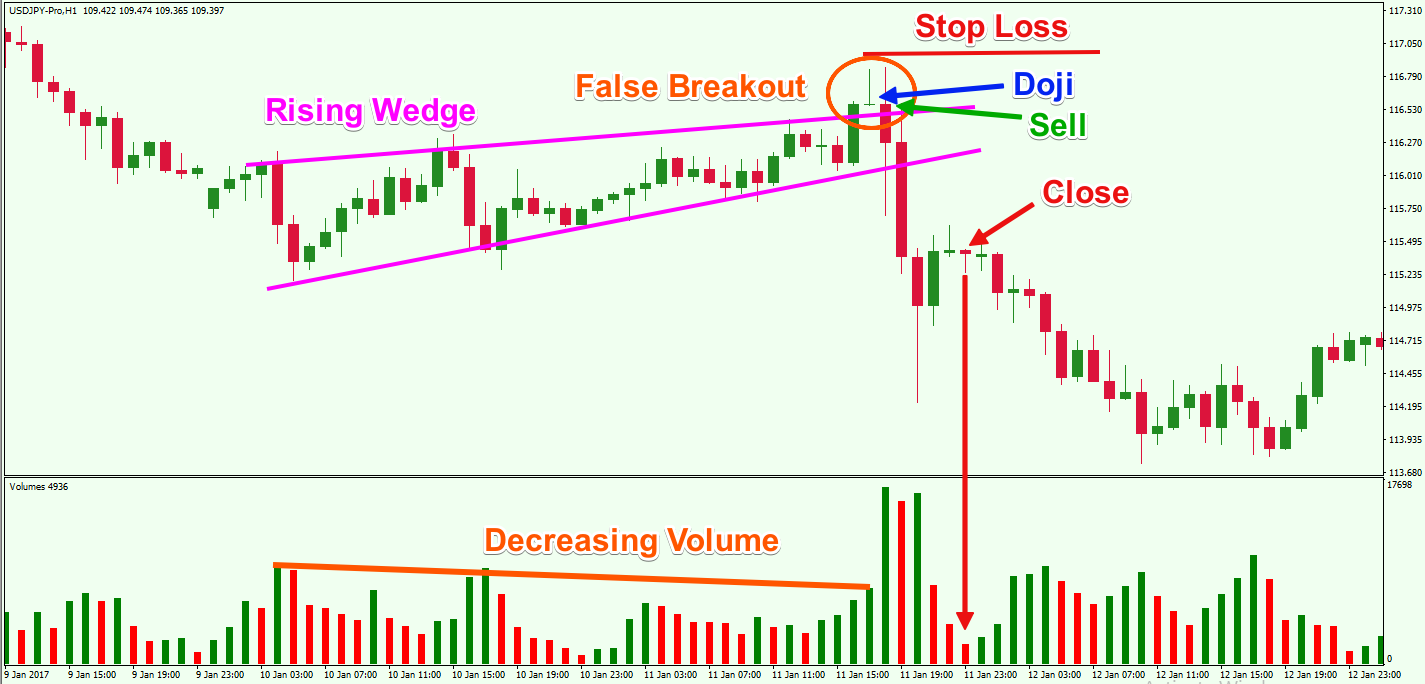
Here we are looking at the H1 chart of the USD/JPY Forex pair. This time the trading example involves a well-known chart pattern – a Rising Wedge that is marked with Magenta on the chart.
Notice that this Rising Wedge represents a correction that appears during a bearish trend. During the progression of the wedge, we can see that the trading volume is decreasing. This is because a wedge has a corrective or a consolidative character. The Rising Wedge pattern typically has a strong bearish potential when it is follows a down leg as in this case.
However, we see that price breaks the wedge through the upper level, which we should recognize as a potential false breakout. Let’s also check some other details on our chart as well.
In this case, we can see that there is an increase in volume during the upside break, but we also know that this pattern has a bearish potential and so we should be a bit skeptical about the volume reading here.
Furthermore, the candle that comes after the breaking candle is a bearish Doji, which is indicative of indecision or reversal. This increases the chance that this is actually a false breakout.
As a trader, we have to weigh the information that the market presents us and try to make the most informed decision that we can. In this case, we might consider an entry here at the close of the Doji formation. You can put your Stop Loss order above the high created by the potential false breakout. This way you will protect your trade in case the price moves in the bullish direction.
But, notice that the price actually creates a very sharp bearish move – the pullback. Also, the Volume indicator shows extremely high readings into the downside retest and bearish decline.
After several periods, the volume begins to decline, which is an indication that the price move might be getting exhausted. Nevertheless, it is better to wait a few more periods in order to confirm the market slowdown. A good exit point, in this case, is the period that is indicated by a dramatically low trading volume as shown by the red arrow.
Conclusion
- When a breakout through a key level is rejected, we consider that a false breakout or fakeout pattern.
- When the price peeks through an obvious level, and then moves sharply in the opposite direction, this causes many traders to get trapped on the wrong side of the market, and intensifies the move contrary to the initial breakout.
- The fakeout pattern can provide a very lucrative trading opportunity since the pullback is very likely to be sharp.
- One way to distinguish valid breakouts and fakeouts is by using the Volume indicator.
- Breaks on low or decreasing volume are likely to be fakeouts.
- Breaks on high or increasing volume are likely to be real.
- False Breakout Strategy using Volume:
- Open a trade contrary to the break if you spot that the volume level is low or decreasing during that break.
- Put a Stop Loss order beyond the created high or low.
- Stay in the trade as long as the Volume indicator continues to support your trade direction.
- Use price action clues in conjunction with Volume to time your entry and exit decisions.