 Perhaps the most important thing to keep in mind if you are serious about trading is that trading is a business. Like other businesses, successful trading is based on the analysis of market dynamics, financial projections and capital allocation.
Analyzing forex market dynamics to make informed trading decisions involves cultivating familiarity with each of the different currency pairs you intend to trade, as well as choosing an appropriate time frame in which to trade. In order to apply a consistent market analysis methodology to forex trading, a viable trading plan should be developed and followed.
Once a trading plan or forex system is developed, backtesting the plan using software like MetaTrader, as well as following it in a forex demo account should be the trader’s next steps. An appropriate time frame for fairly evaluating a trading system will probably depend on the trader, but many traders use a full three months to determine if the system will most likely be profitable in the long run.
Forex Trading Metrics or Trading Statistics Defined
While fortunes can sometimes be made overnight in forex trading, as with most businesses, they are usually made with time, patience, practice, strategic thought, and by following a viable trading plan. Once a trading plan is developed and implemented, the results will yield a series of statistics or metrics. This data will provide the trader with valuable information that can then be used to improve their trading system.
Basically, the definition of trading metrics is the statistical results generated from trading activities over a specific period which are used to assess the efficacy of a trading plan. One of the most important considerations when assessing trading metrics is the time frame evaluated, which can vary in terms of its duration, and the market conditions that prevailed during that period.
Choosing a consistent time frame for trading metric analysis allows for an accurate assessment of a trading plan, without the variance produced by using different time frames.
Profit and loss results for a trading plan can vary considerably when using different time frames and comparing strategies. For example, a short term range trading strategy would be significantly different than a longer term trend trading strategy when it comes to assessing and comparing trading metrics.
Why Operational and Trading Strategy Metrics are Useful
Trading metrics fall into two basic categories that have different uses for a forex trader wishing to measure the operational performance and overall success of their trading business.
The first category consists of operational metrics that measure the performance of the trader themselves and the operational functionality of their equipment. Several examples of this type of metric might include the number of trading errors made, the average trade identification and response time, and the number and duration of Internet outages during trading hours that might adversely impact trading activities. These metrics can be useful to determine what sort of operational changes need to be made by a trader.
The second category consists of trading strategy or trading system metrics that generally measure the financial success of the trading business and the strategy it employs. These might include such things as net profitability, number of winning trades, and how close the trading business is to meeting one’s financial goals. Assessing these metrics seems essential for a trader to determine whether a particular trading strategy should continue to be used.
Forex Metrics are Used by Many Different Types of Market Participants
Forex metrics play a significant role for traders that have developed a trading plan and use statistical analysis to determine how to improve their trading skills and practices. In addition to discretionary and systematic traders who trade for their own account, other financial professionals regularly use trading metrics to assess performance.
For example, a fund manager seeking a competent forex specialist may use a forex specialist’s trading metrics to assess their past performance and to get an idea of the amount of risk they assume in relation to size of their trading account. Social traders are another group that can really benefit from the use of trading metrics in analyzing a trader’s success, risk taking habits and responsible capital allocation. In this case, they would review the pertinent statistics of any trader that they are considering or presently copying the transactions of.
By analyzing the trading results of the copied trader, the social trader can get a better idea on the criteria used by a successful trader to determine entry and exit points in the market. This gives the social trader a better understanding of the successful trader’s standards, which can eventually be incorporated into their own trading plan.
Risk managers for large trading organizations are another group of financial professionals that employ metrics to assess the risk profiles of traders that they supervise. Large clearing companies and financial institutions with large dealing desks use risk managers to determine the level of risk taken by traders operating at their firms who are using its capital and credit lines with the goal of generating extra profits.
Top 12 Forex Trading Statistics
People generally focus on certain metrics more than others. For example, the all-important bottom line or net profit is generally the first statistic considered. Nevertheless, achieving the net profit requires the exercise of various trading practices, such as average time length of a trade, which constitutes another metric.
What follows is a bullet point list of twelve of the most popular forex stats, which are generally used for improving a strategy, assessing a trader’s success, or analyzing a trading account:
Net Profitability – the account’s bottom line is the most watched trading metric and basically states how much the trader or company has made after paying expenses. When considering net profitability, the time frame in which the net profit was made and the amount of capital used to make that profit are of considerable importance.
Percentage of Winning Trades – this metric is usually the first statistic considered after the net profit. The percentage win rate is derived by dividing the number of profitable trades by the total number of trades, which gives the win percentage.
Percentage of Losing Trades – much like percentage win trades, the percentage of trades showing a loss are the number of losing trades divided by the total amount of trades. The percentage of winning vs losing trades can be very important in assessing money management rules used in the account.
Largest Winning Trade – this refers to the biggest winner a trader had, which can carry a lot of weight for an account if the amount of the winning trade is a large percentage of the net profit.
Largest Losing Trade – this metric indicates the level of risk that the trader allowed the account to be exposed to. This metric is extremely important when considering a trader to copy, for a social trader, and for hiring a trader, in the case of a fund or bank.
Average Winning Trade – the average winning trade is derived by adding up the sum amount of all winning trades and dividing this number by the number of winning trades.
Average Losing Trade – the average losing trade is calculated by adding up the sum of all losses and dividing this amount by the number of losing trades.
Holding Time – the amount of time that a trader holds a position determines whether they are a short-term, medium-term or long term-trader. Depending on the type of trader, the time a trade is held can be an important metric. The average holding time for a scalper for example could be less than a minute, while a long-term trader might hold a position for several months. The average holding time is calculated by dividing the total holding time for all trades by the number of trades.
Winning Trade holding time versus Losing Trade holding time – this metric can indicate whether the trader is holding losing trades too long or cutting out profits by exiting winning trades too soon. Holding on to losing trades for long periods ties up capital that can be used better elsewhere.
Maximum Drawdown – this very important metric shows the reduction of capital in the account after a string of losing trades. For example, if the trader had a maximum losing streak of -$10,000 on a $100,000 account, then the maximum drawdown for the account is 10 percent.
This metric is generally derived from a peak in the account’s profitability, to a trough or the subsequent lowest amount after the peak.
Worst Losing Streak – this stat shows the most consecutive losing trades made in the account. This metric can be somewhat deceptive, in that if the losing streak was for many small monetary losses, it could indicate a sound money management strategy.
Trade Expectancy – this refers to the average amount expected to be made or lost on each trade. The trading expectancy is calculated by multiplying the loss percentage by the average loss and subtracting the amount from the win percentage multiplied by the average win.
Basically, interpreting forex metrics like those listed above can be the key to improving your trading skills. Once a trading system has been evaluated over a period of three months and then tested in a live account for a similar time frame, the trader then probably has enough statistical information to see where there can be room for improvement.
Of course, one of the main reasons for using forex metrics is to develop a sound trading plan. Without a trading plan, a forex trader can be compared to a traveler without a compass or a map. Knowing what to look for when analyzing forex metrics can considerably improve your own trading results, as well as your confidence in copying the trades of others whose metrics meet your standards.
MetaTrader and Report Analysis Tools to Compute Forex Metrics
 If a trader happens to be using MetaTrader 4 or 5 for their forex trading activities, then they will be able compute various metrics for their trading system from within the platform.
A trader or analyst will then need to access MetaTrader’s Strategy Tester function in order to backtest a particular trading strategy they are interested in testing. This process is described in detail in MetaTrader’s operational guide and, once suitable parameters are entered, it will automatically provide most of the useful forex metrics a trader will need to assess the historical performance of their system.
Another very useful feature that MetaTrader offers those interested in testing trading systems is the ability to optimize the parameters for a particular trading system based on what would have been the most profitable solution over a particular historical time frame.
After a potentially viable forex trading strategy has been identified by backtesting, another strategy testing option involves utilizing MetaTrader’s built in demo trading functionality that most online forex brokers support. This will help a trader get a more realistic sense of how the system will perform in the current trading environment where dealing spreads and response times are taken into account.
The final testing step for a strategy will usually involve trading it personally or automatically, as appropriate, in a funded account in small volumes. This helps the trader make sure that their live trading results are consistent with those obtained from backtesting and demo trading the system.
Once you have been trading a strategy for a while, you may then wish to compute your personal forex metrics to see how your performance has been. Earnforex has a tool which can compute these metrics from MetaTrader performance data
A screenshot of this forex report analysis tool appears below:
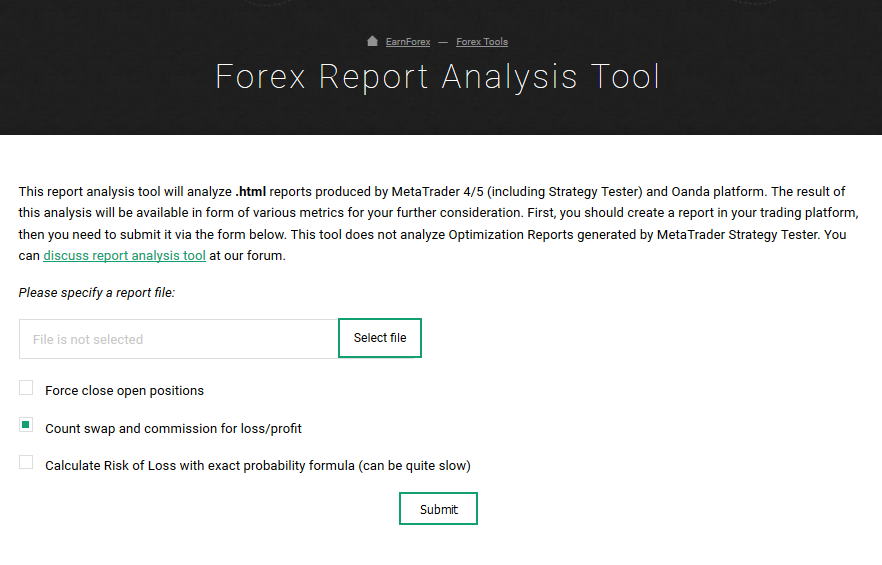
Figure 1 – Screenshot of forex report analysis tool by EarnForex.com
Reviewing and Analyzing Trading Performance Metrics
Now that you have obtained some trading performance metrics by going through any of the three main strategy testing options listed in the previous section, you will now want to know what to look for when reviewing the trading metrics of a particular forex strategy.
Virtually the same performance review process can be used to assess the success rate and risk in using a particular fund manager, signal provider, or other managed forex account program.
Before you start this analysis process, you will first want to prioritize the various trading performance metrics obtained from the raw trade data and determine your boundaries for acceptable performance. You will typically do this based on your personal risk tolerance and profit objectives. For example, you may want to set a maximum tolerable drawdown or a minimum net profitability target for a system or trader to meet in order to warrant further consideration.
Benefits of Static versus Real Time Trading Data
The first type of analysis that comes under this heading compares the performance of various trading systems based on a static set of historic exchange rate data that does not change. This sort of static historical analysis allows you to compare apples to apples when it comes to assessing the relative performance of a particular trading strategy or trader to others in the same category.
Remember that this form of static analysis will only generate performance results relevant to the type of trading conditions that existed during the chosen time frame for the particular currency pair or pairs that were assessed. Trading conditions do change over time, so you might want to select several different time frames that exemplify various types of trading conditions to run your tests over.
On the other hand, a case can certainly be made for using real time trading data to assess performance metrics on an ongoing basis. While this does not have to be performed each day, it may be a good idea to incorporate into your weekly or monthly trading plan assessment process.
The primary rationale for doing so is that, as mentioned before, market conditions can change, and this change can substantially impact the success of a particular trading strategy. Success rates can also change as traders can routinely go through winning and losing phases.
For example, a particular strategy may be very suitable for a range trading environment. As long as such range trading conditions continue to exist, such a strategy can show positive results. Nevertheless, when a breakout from the trading range occurs, and a trend becomes established, other trend following trading systems will probably outperform the original range trading system.
By performing real time trading analysis on a periodic basis, this sort of situation can readily be identified, and the strategy used can be changed in response to the new market conditions in order to maximize your overall profitability.