One of the main reasons why technical analysis continues to be such a popular method of forecasting and trading the markets is the wide range of different methods available to traders. Technical analysis encompasses such a diverse range of techniques and methods that there is truly something for everyone.
Whether you are a pure price action reader, studying candlesticks and patterns, or prefer to trade using levels and trend lines, technical analysis offers all traders the opportunity to explore and benefit from market study. Within technical analysis, however, there continues to be one specific area which remains the most popular method of all and that is the use of technical indicators.
What Are Technical Indicators?
Technical indicators are built-in tools on your trading platform that analyse price action based on a number of different variables including momentum, trend direction, volume, mean reversion, and so on. These tools display actionable readings based on their underlying measurements and as such can be incredibly useful for helping traders quickly analyse the market and form trading decisions.
Much like the broader world of technical analysis itself, within the sphere of technical indicators, there are a wide range of different tools available from classic indicators which have stood the test of time and are available on all trading platforms, through to specially built custom indicators.
However, no matter which indicator you prefer, there are a certain core group of indicators which are widely agreed to be among the most reliable and effective when it comes to trading. In this article, we are going to focus on one of these indicators in particular, the price percentage oscillator (or price percent oscillator). We’ll walk through exactly what the indicator is, what it tells us about the underlying price action and order flow in the market and we’ll look at some different trading strategies using the indicator.
What is the Percentage Price Oscillator?
The price percent oscillator (ppo from now on) is a fantastic tool that can really help give traders an edge when analysing and trading the markets. The ppo indicator essentially is a momentum indicator which measures the difference between two moving averages to give an indication of how firmly price is moving and in which direction.
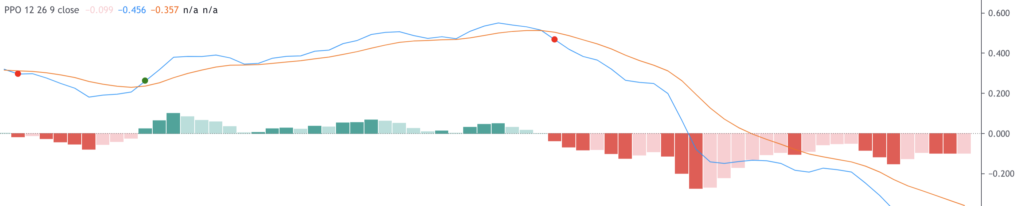
The indicator, shown above, is similar to the MACD in that it measures the difference between two moving averages, the 12 period and the 26 period. When the difference between the two averages is negative, the indicator paints a red histogram, showing us that the market is bearish. This is because the faster-moving average has crossed under the slower moving average. On the other hand, when the faster moving average is above the slower moving average, the indicator paints a green histogram telling us the market is bullish.
So, as you can see it is a very simple, straight forward indicator giving us easily digestible visual cues about the market. As mentioned earlier, the indicator is very similar to the MACD. The only difference is that the ppo oscillator is measuring difference between the two moving averages in percentage terms whereas the MACD measures the difference in dollar terms (or whatever the base currency is).
This is a key reason why many people view the percentage price oscillator as superior, especially when it comes to comparing indicator readings across different assets and instruments. Along with giving us bullish and bearish signals when the moving averages cross over you can also see that the indicator is very useful for showing us when price moves are slowing down.
When the distance between the two averages starts to narrow the histogram bars will weaken, this alerts us to waning momentum and, as we will discuss shortly, can be very useful for helping us stay alert to potential reversals ahead of time.
So, now we know what the ppo oscillator is and understand what it is telling us about the underlying order flow in the market, it’s now time to think about trading the price percent oscillator.
How to Trade the Price Percent Oscillator?
Given the information discussed above, the first and most common price oscillator trading strategy we will look at is trading bullish and bearish signals on the indicator.
Bullish PPO Example
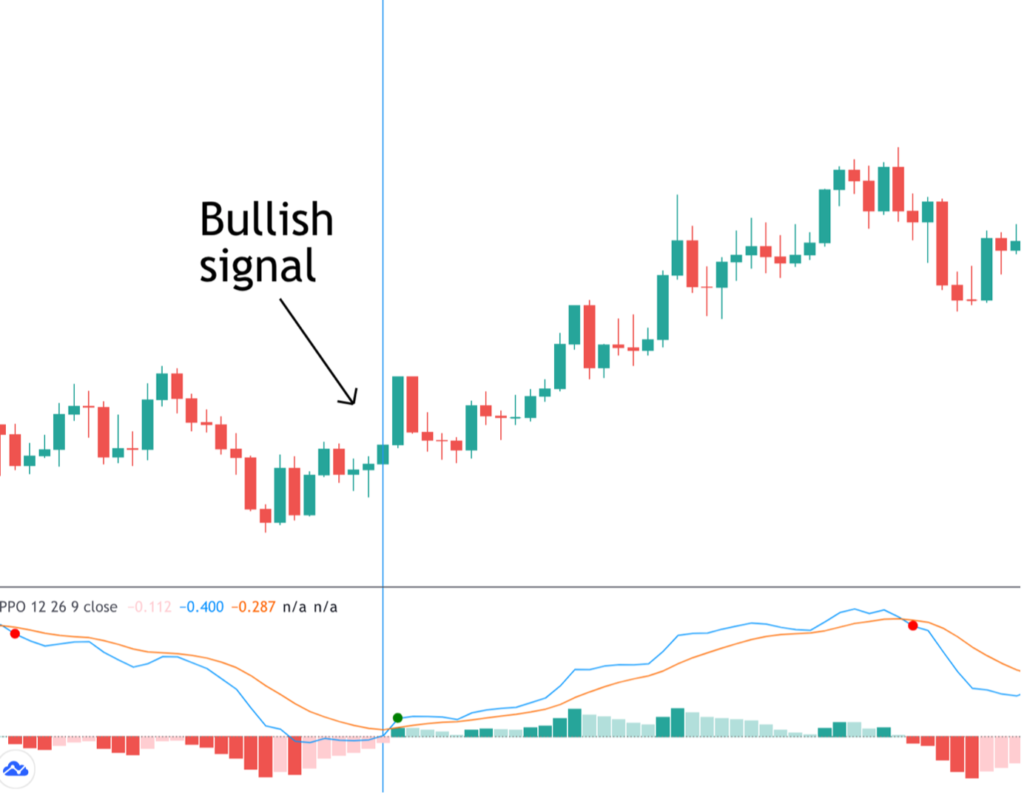
So, in the chart above you can see a great example of how we can use the histogram crossover to give us trading signals. So, to begin with, we see price trading in a block of price action with the PPO indicator telling us the short-term moving average is below the long-term moving average, and therefore the market is in a bearish mode. However, at the vertical line highlighted you can see the indicator (as seen on the histogram) flips from red to green (from bearish to bullish) telling us that the short-term moving average is now above the longer-term moving average and therefore the market has entered a bullish phase.
So, one strategy is simply to enter a buy trade as we see this crossover take place. We can enter long on the candle that closes as the indicator gives the signal and we can put our stop below the price low which was formed ahead of the reversal. Once we have our stop in place and we know what our risk is, we can then set a target of a minimum of twice our risk. Doing this ensures that we achieve a positive risk-reward ratio on our trade and is a crucial aspect of achieving and maintaining success in trading.
Managing The Trade
Now, given what we know about the indicator reading, another way of managing this trade is to simply stay in the trade until the indicator gives us an opposing signal. So, if we got long (set a buy trade) at the point when the indicator crossed bullish, we could look to keep the trade open until the indicator crosses bearish, telling us that the short term average has crossed below the long term average and the market is in bearish mode.
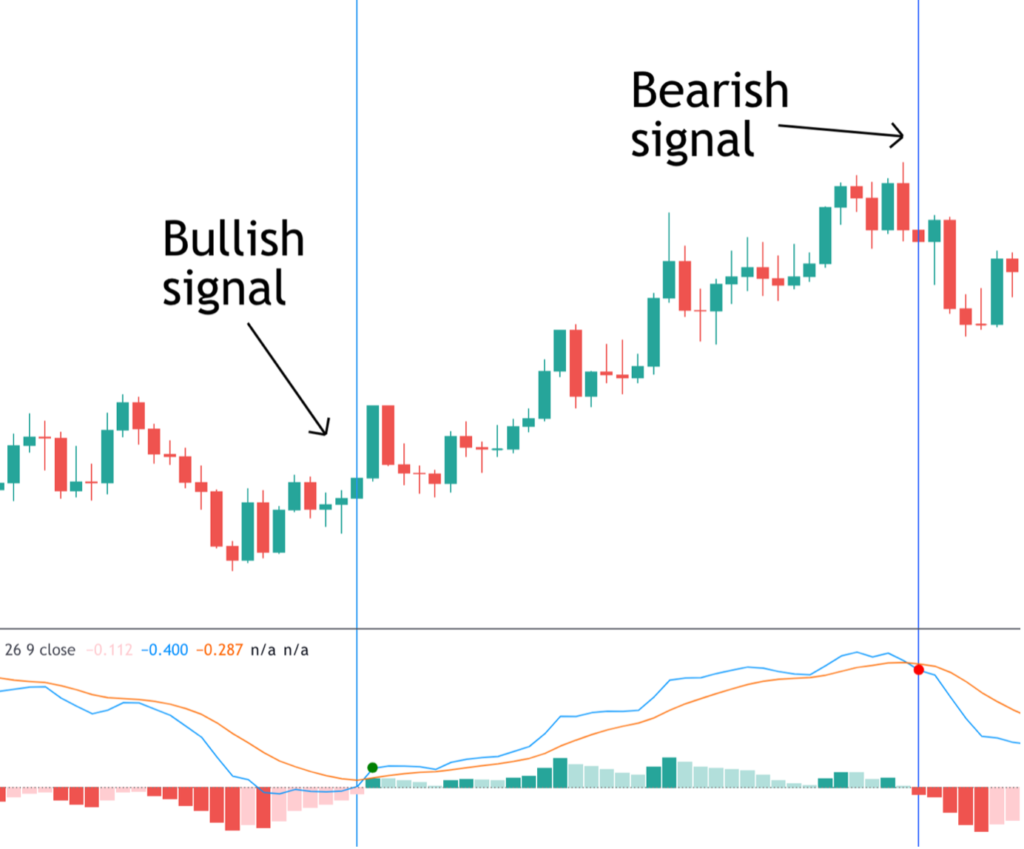
As you can see, in this example, doing that would have meant that we stayed in the trade for much longer and caught a much bigger trade. However, this won’t always be the case and it is important to test out different trade management ideas to see which suit you best and which give the best results.
Alternative PPO Trading Strategy
Now, along with simply entering a trade as the indicator gives us a signal, there are other ways to use this indicator. One of the most effective methods is to use the indicator signal as a guide, telling us which direction to trade in, and then utilise a specific entry method to place a trade.
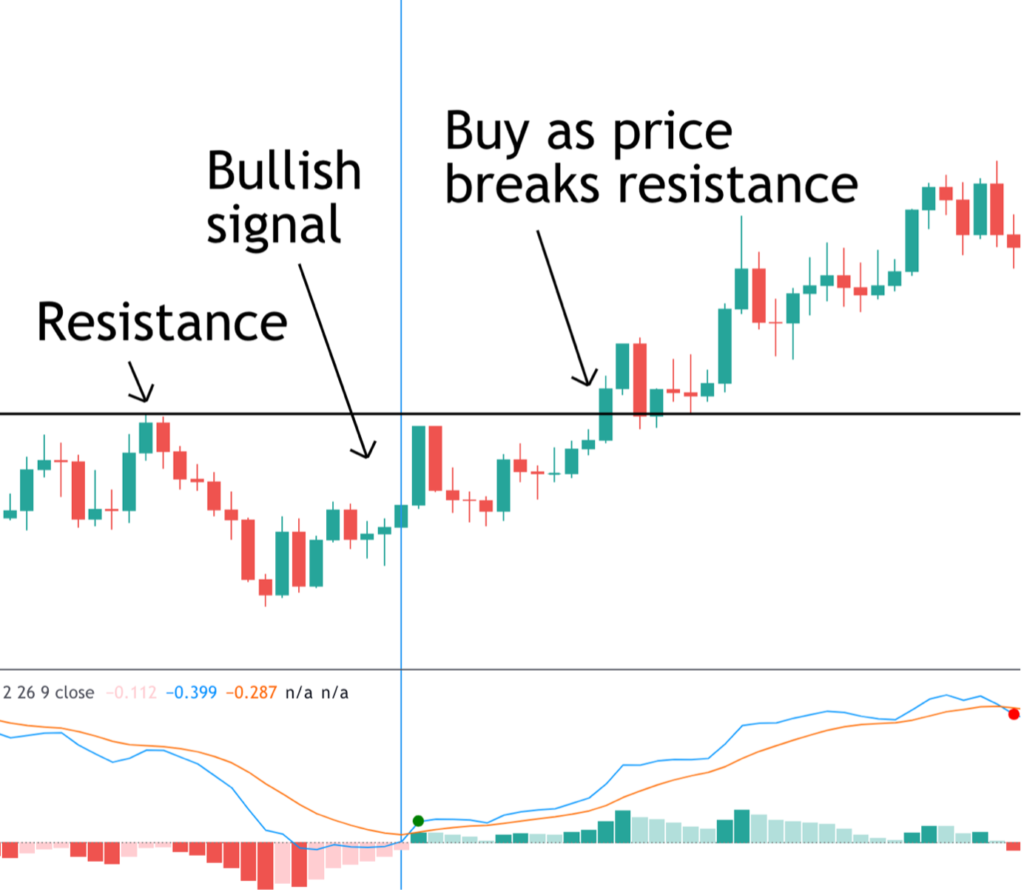
So, in the example here we have a bullish signal telling us that the short-term moving average has crossed above the slower moving average. And so, we can say that the market is gaining bullish momentum. One very popular and effective way of trading an emerging bullish trend is to trade breakouts, where price breaks above resistance. So, looking at the example again we can see that if we mark the price high posted ahead of the bullish ppo signal, we have a clear resistance level in the market.
So, once we get our signal on the ppo technical indicator, we know we are looking to buy and we know that if a bull trend is going to develop properly, price will need to break out above the resistance level marked there. So, one other way to trade this scenerio is to wait for price to break above the resistance level and then place a buy trade, capturing the expansion in momentum as price breaks out.
The beauty of trading in this manner is that we are relying on another technical element besides just the indicator. So, we wait for the indicator to give us our directional signal and then wait for price to break the resistance level to give us our entry point. This can be a really useful way to trade as it means that we can avoid taking some weaker trades if the signal is bad.
For example, in choppy market conditions, we might get a buy signal, but price fails to break out above resistance, so waiting to trade in this manner means that we would avoid taking trades that will likely be losers. This is just one example of how we can combine the indicator with other technical elements to start to build a fuller trading strategy.
Bearish PPO Trade
Now, when we want to use the ppo oscillator to take a bearish trade (a sell trade, or short) we apply the same logic but simply in reverse. So, this time we want to see the indicator switching from green to red. This tell us that the shorter-term average has crossed below the longer-term average, telling us the market is now in bearish mode.
Bearish PPO Example
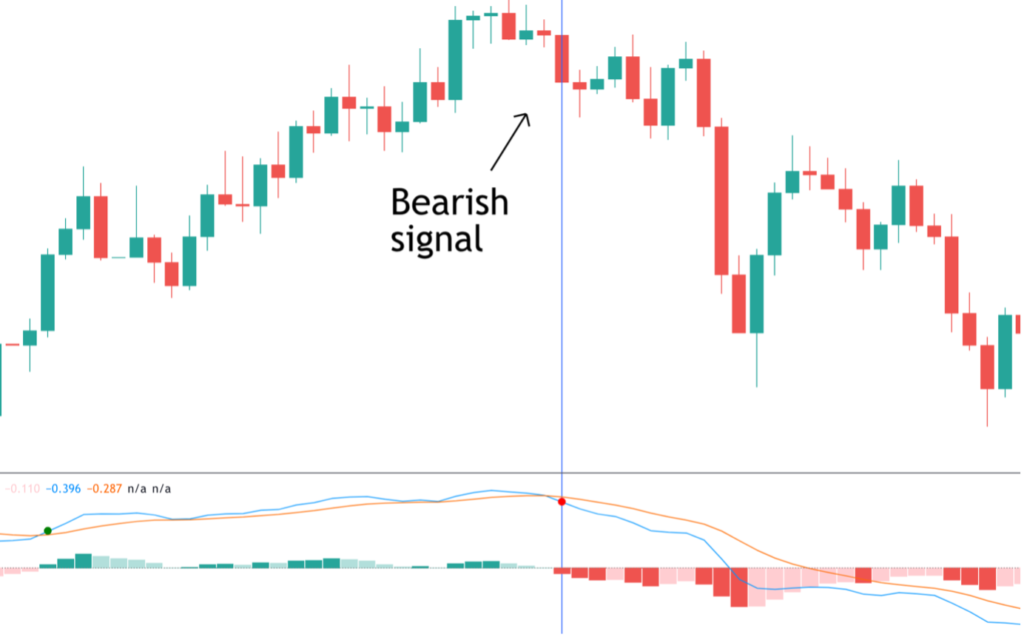
So, in the chart above you can see a great example of a bearish signal in play. The market is in a bullish trend to start with. Price is moving higher and the indicator is moving higher. However, once price reverses from the highs, soon we see the indicator cross from green to red. So, this tells us there has been a momentum shift in the market from buying to selling. Sellers are now in control and this gives us the directional guide we need to form a trading idea.
So, as with the bullish signal, the first way in which we can trade the indicator reading is simply to go ahead and place a sell trade as the indicator crosses to bearish. We enter on the candle that closes as the indicator gives the reading and place our stop above the high that was formed ahead of the bearish signal. From there we then set a target of at least twice our risk focusing as always on achieving positive risk-reward.
Now, another way of taking this trade is to once again look to use market structure. So, we know that price is reversing lower from a bearish trend and once we identify our bearish signal on the ppo we know that we are looking for selling opportunities.
So, in this scenario, we would look to identify the last support level within the bullish trend that formed ahead of the bearish ppo signal. We then want to see price breaking below that support level, confirming the bearish ppo reading and the bearish reversal and giving us the opportunity to set a sell trade as price breaks down.
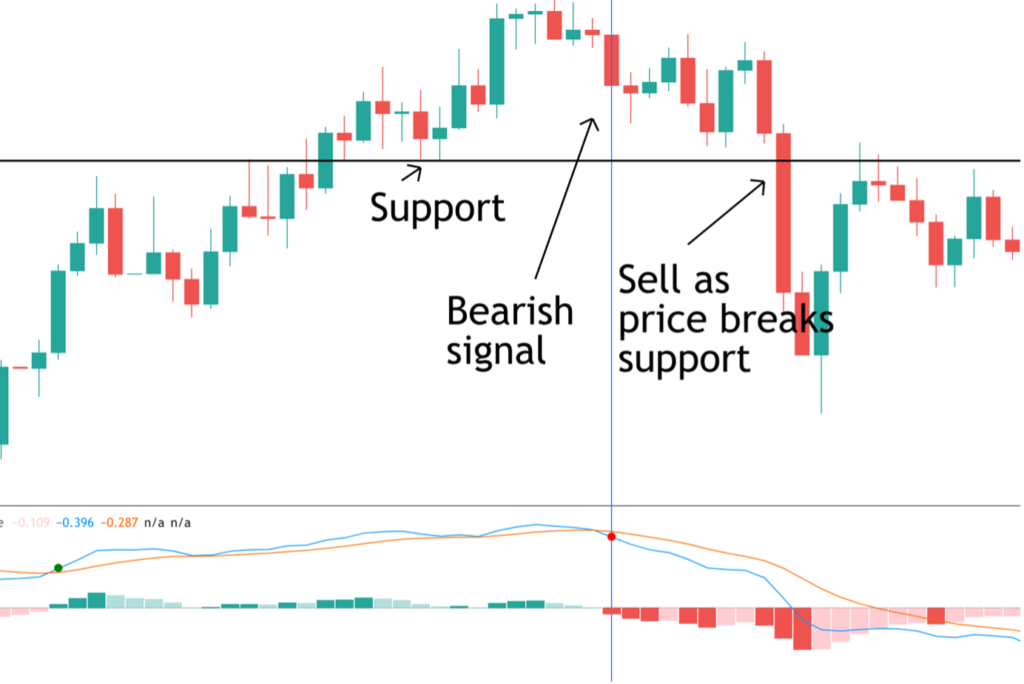
So, looking at the example again, this time you can see we have marked in our support level which is the last swing low formed in the bullish trend ahead of the bear reversal taking place. So, once again we can see this is a much more strategic way of taking these ppo trades because we are waiting for the market structure to confirm the moves suggested by the indicator.
The confluence between these two elements greatly increases our chance of having a successful trade and gives a glimpse of how this indicator can be combined with other technical elements to build a trading strategy and improve our profit potential.
Trading PPO Divergence
Now, the example above actually gives us another very important example of another way in which we can use the ppo indicator. Now, if you are familiar with technical indicators you might have picked up on it. So, another way in which we can use the indicator is to trade divergence. This is another really effective price oscillator trading strategy.
What is Divergence?
Divergence refers to a situation where the moves taking place on the price chart are not supported by the moves taking place on the indicator. So, for example, if price is moving lower within a bearish trend but the ppo indicator is starting to move higher, this tells us the distance between the two averages is contracting. This tells us that although price is moving lower, selling pressure is actually starting to weaken and alerts us to a potential reversal.
Bearish PPO Divergence Example
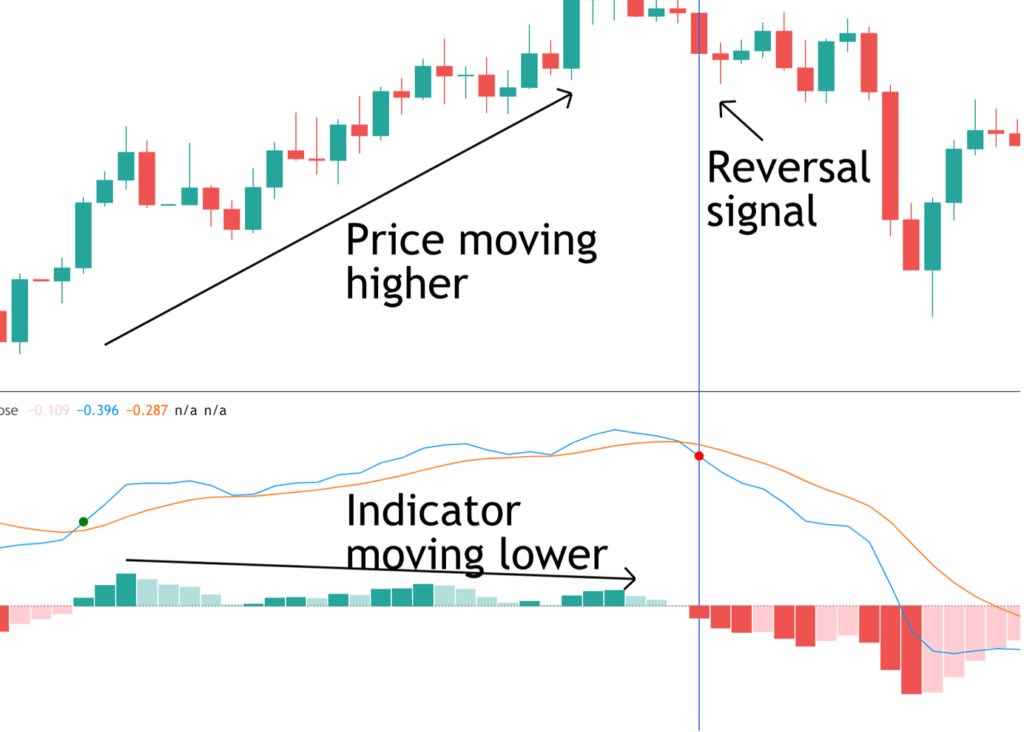
So, looking at the chart above again, this time you can see we have highlighted bearish divergence. While price is moving higher within a bullish trend, the indicator is actually starting to move lower. Each new price peak is accompanied by a lower peak on the indicator. This tells us that although price is moving higher, the distance between the shorter term and longer-term moving average is starting to shrink, telling us that buying pressure is weakening.
So, once we identify divergence like this within a bullish trend, this is a good early warning sign that we should be on the lookout for a bearish reversal. So, if we are not in a trade this means that we monitor the market waiting for a bearish reversal signal, which you can see we got shortly after the third price peak (and third lower ppo peak).
Alternatively, if we are in a bullish trade and we see bearish divergence like this happening, we know that we need to watch our risk. This means moving our stop to break even, and possibly even using a trailing stop if price hasn’t hit our target yet, to protect against any reversal lower. This is another really useful ppo indicator strategy to include in our trading arsenal.
Divergence is an incredibly useful aspect of the ppo indicator which can give us a great early warning signal for potential trend reversals. This is helpful not only in identifying trading opportunities but also in managing existing trades.
Final Thoughts on The PPO Indicator
Hopefully by now, you can see just how effective the ppo indicator is in helping us analyse and trade the markets. The beauty of the indicator lies not just in its simplicity but also in the fact that because of the indicator’s design (measuring difference between moving averages), it can be used on all timeframes and all instruments. This means it can be used as a ppo stock indicator or a ppo forex indicator with equal power.
When looking to get the most out of your ppo trade it is important to keep an eye on the indicator readings as the trade develops. As we discussed above, monitoring divergence is really important when in a trade with the ppo indicator. As with all trading setups and trading strategies, the best thing to do is to spend time practicing using the various strategies and methods discussed here to get a feel for how the market reacts to the different ppo technical indicator signals and find the best way to trade them for yourself.