The Aroon indicator is a technical study that is included within most charting packages today. Even though this is the case, many traders are still unfamiliar with the proper application of the Aroon indicator. As such, we will take this time to explain everything that you need to know about the Aroon indicator.
Aroon Indicator Explained
The Aroon indicator is a technical indicator used to identify price trends within a specified trading instrument. The Aroon indicator, which is also commonly referred to as the Aroon up down indicator was developed by Tushar Chande in the mid-1990s. The indicator is comprised of two lines. The first, is the up line, which displays the number of periods since a high, and the second, is the down line, which measures the number of periods since a low.
The Aroon indicator can be applied to any number of periods, however, the default is 25 periods. In other words, if you were looking at a daily chart, the 25 periods would represent 25 days of data, and if you are looking at a weekly chart, the 25 periods would represent 25 weeks of data.
As a general rule, when the up line is above the down line, prices are said to be moving higher in a bullish manner. And conversely, when the down line is above the up line, prices are said to be moving lower in a bearish manner.
The Aroon indicator oscillates between the 0 reading and the 100 reading. As you might expect, when the up line value that is at or near the 100 level, it represents a strong bullish sentiment and an extremely strong uptrend.
And similarly, when the down line value is at or near the 100 level it represents a strong bearish sentiment and an extremely strong downtrend. In addition to providing clues on the trend direction and trend strength, the Aroon oscillator can also be useful in identifying markets that are trendless, or trading within a consolidation phase.
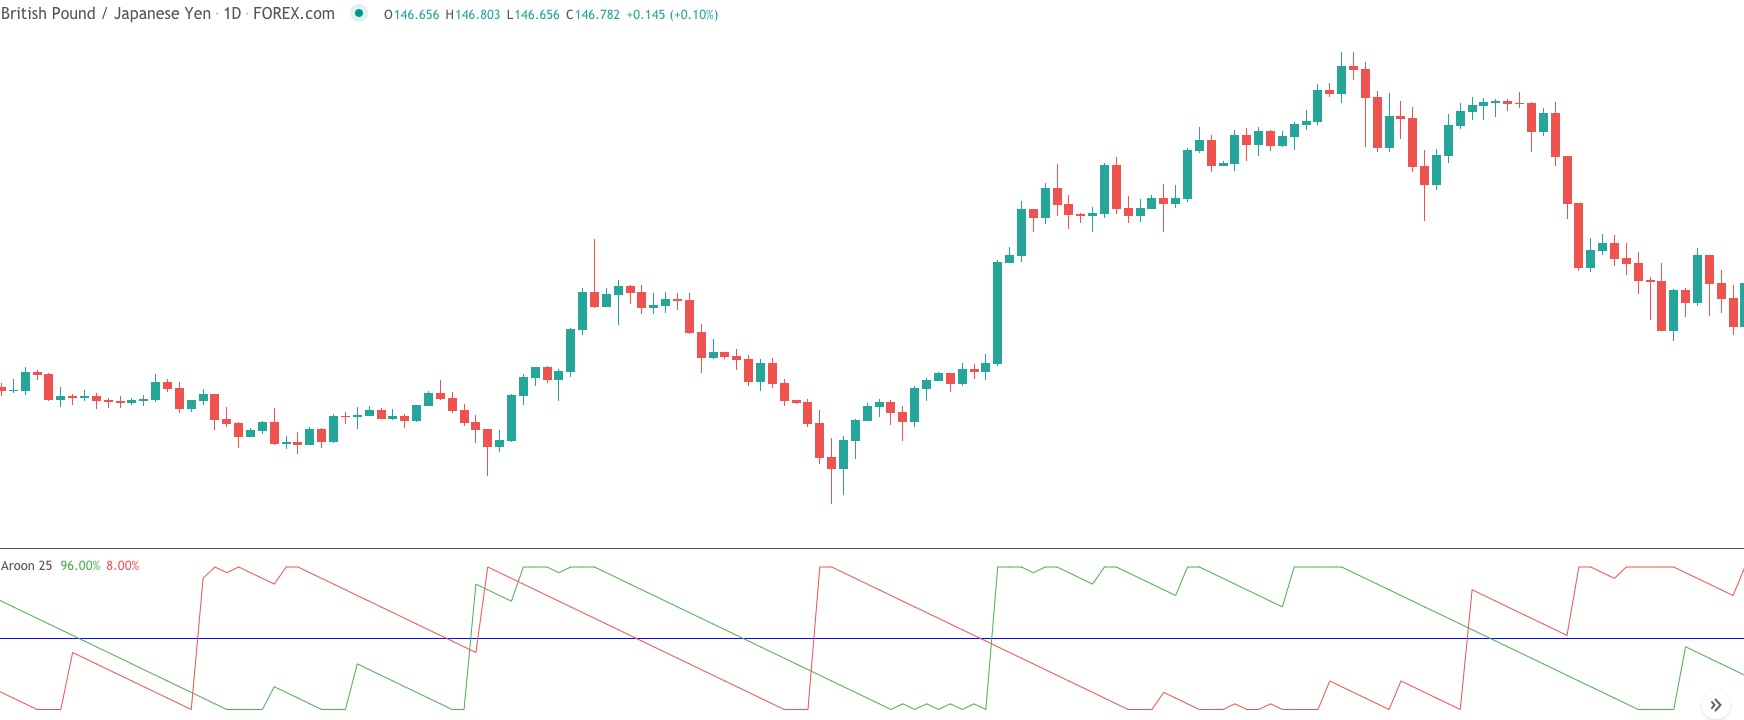
Below you can see an example of the Aroon indicator plotted below the price chart. The green line represents the up line, the red line represents the down line, and the blue horizonal line represents the 50 threshold level.
Aroon Indicator Formula
Let’s now turn our attention to the Aroon indicator formula. The Aroon indicator is calculated based on the following formula.
Aroon-Up = (25 – Days Since 25-day High / 25) x 100
Aroon-Down = (25 – Days Since 25-day Low / 25) x 100
Essentially, the Aroon up line is based on the price highs, with a default look back period of 25 days, and the Aroon down line is based on the price lows, with a default look back of 25 days as well. This tends to be the best setting for the Aroon indicator based on a range of market conditions.
Practically speaking, when the up line of the Aroon indicator is above the central 50 reading, while the down line is below the 50 reading, the market can be seen as displaying bullish price behavior. When the down line of the Aroon indicator is above the central 50 reading, while the up line is below the 50 reading, the market can be seen as displaying bearish price behavior.
Along the same lines, the Aroon indicator can sometimes be used as an overbought and oversold oscillator. More specifically, when the up line reading surges to extremely high levels, such as 100, the prices can be seen as being overbought, which can often lead to a price reversal to the downside. Similarly, when the down line reading surges to extremely high levels, such as 100, the prices can be seen as being oversold, which can often lead to a price reversal to the upside.
However, it’s also important to utilize other technical methods in conjunction with the Aroon indicator when using it as a countertrend signal. This is because, an Aroon indicator line can remain at very high levels for relatively long periods of times in certain cases, particularly in fast-moving markets.
Aroon Technical Indicator Signals
There are four primary ways that we can analyze the Aroon oscillator. Let’s take a look at each below.
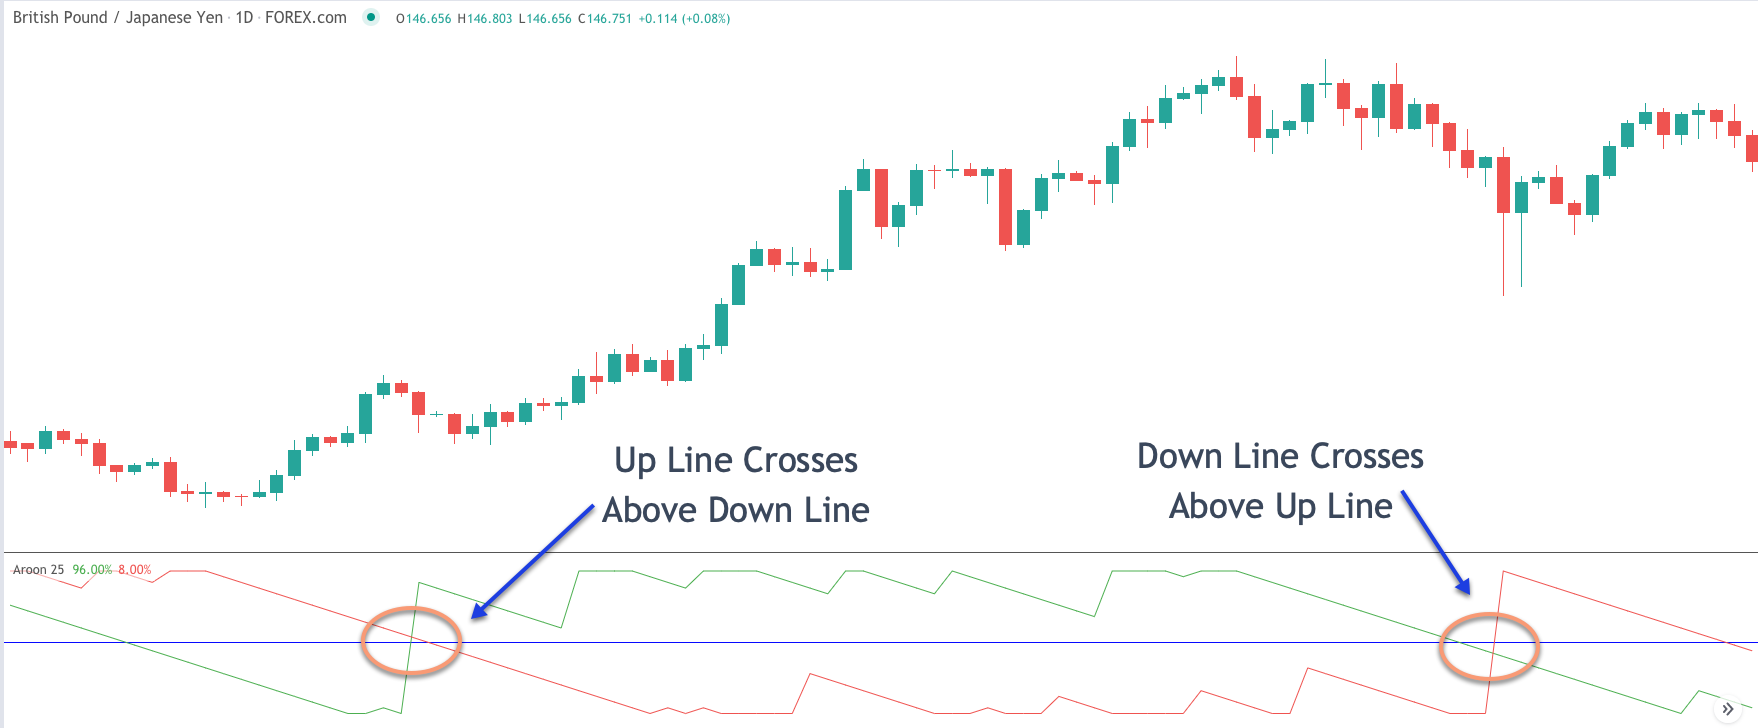
Cross above the 50 threshold – When the Aroon up line crosses above the 50 threshold from below, this is an important event and suggests that the market is transitioning from a state of bearishness to a state of bullishness. The opposite is true when the Aroon down line crosses above the 50 threshold from below. This occurrence suggests that the markets are moving from a state of bullishness to a state of bearishness.
Crossover between the Aroon up and down lines – When the Aroon up line crosses above the Aroon down line, it suggests that the new highs are becoming more recent within the price action than the new lows. And as such, this would mean that there is more bullish sentiment in the price action.
Conversely when the Aroon down line crosses above the Aroon up line, it suggests that the new lows are becoming more recent within the price action than the new highs. And as such, we can infer that there is more bearish sentiment being built into the price action.
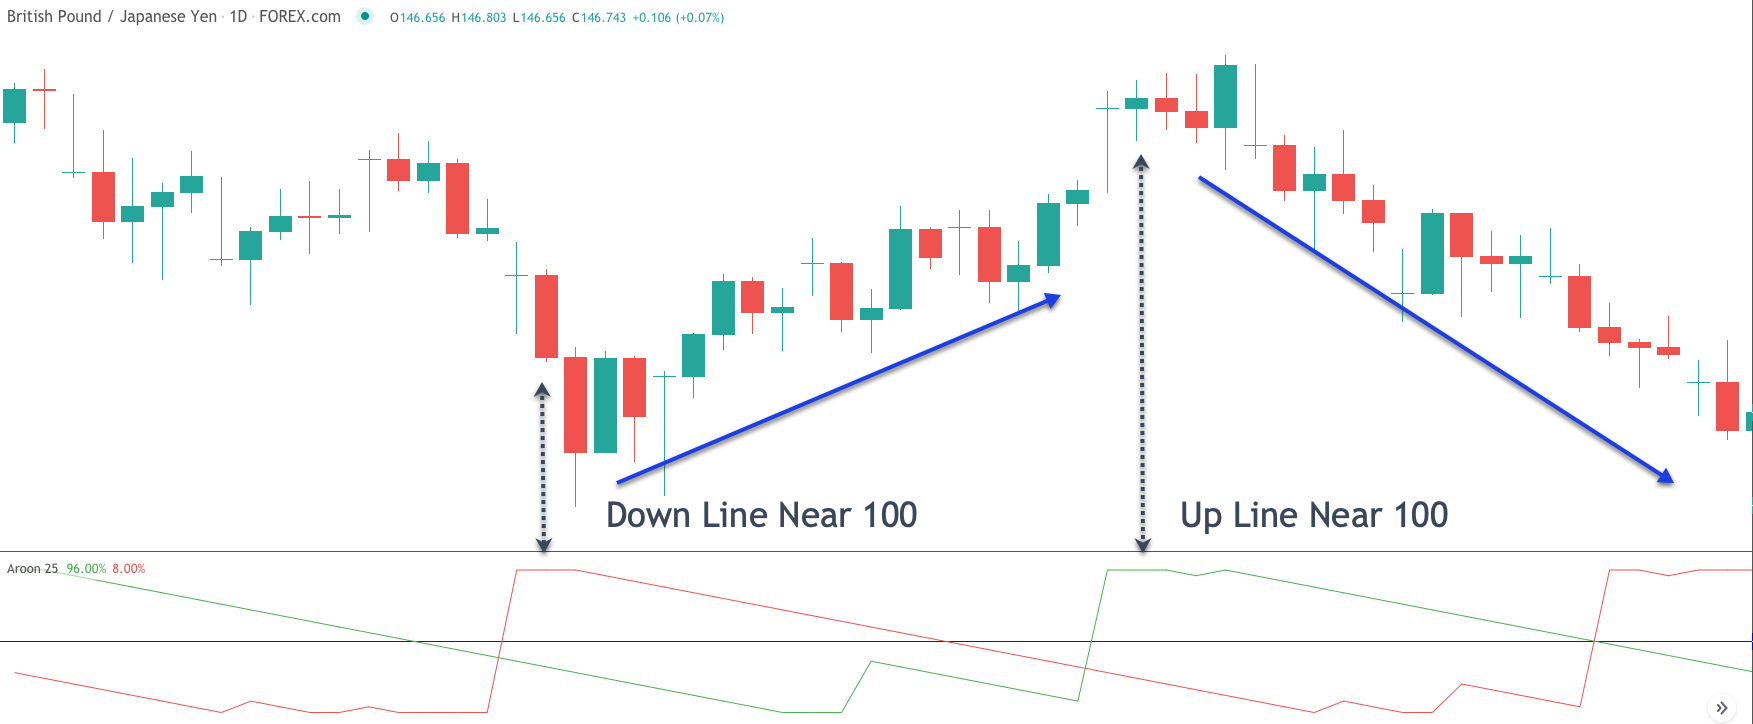
Cross above the 90 threshold. – When the up line within the Aroon indicator moves above the 90 threshold, that suggests that the market is in a strong up trending condition. Conversely, when they down line within the indicator moves above the 90 threshold, that suggests that the market is in a strong down trending market environment. And when these levels get closer to the 100 threshold, it can provide an opportunity for a mean reversion trade set up.
Traders need to be very careful in utilizing the Aroon up down indicator exclusively for overbought or oversold signals. As noted earlier, the Aroon indicator can remain at extremely high levels for relatively long periods of time. And so, you should complement this reversal technique with another confirming technical indicator such as RSI, or Williams %R.
Crisscrossing of the Aroon up and down lines – The Aroon oscillator often forms a very specific type of pattern within a trading range market environment. More specifically, when both the up and down lines are registering below the 50 threshold and are either crisscrossing each other below this area, or moving in a downward parallel fashion, we can take that phenomena to suggest that the market is trading within a range bound consolidation.
As such, we should be careful in initiating any new positions as it can lead to a higher chance of false breakouts or continued directionless price action.
Aroon Oscillator vs ADX
The Aroon oscillator indicator is often confused with the ADX indicator, Average Directional Index. Although both of these studies tend to have some similarity, they are to completely different technical studies.
The Aroon oscillator is a more simpler trading indicator with just one parameter, the look back period. And as we have noted, the default look back period within the Aroon oscillator is 25. The Aroon oscillator’s two lines, the up and down line, tell us the direction of the market trend, along with the intensity of the market trend.
The ADX indicator only consists of a single line, and it helps measure the strength of a market trend. The default look back for the ADX indicator is 14.. The formula for the construction of the ADX line is more complex than that of the Aroon oscillator.
Although it is beyond the scope of this article to get into all the details of the ADX indicator, it’s important to note that when the price crosses the 20 threshold within the ADX indicator, it suggests that the market is beginning to trend. Traders can add the +DI, and -DI lines to the ADX indicator to gauge the direction of the specific trend.
Sometimes traders utilize both the Aroon oscillator, and the ADX indicator to get a better sense of market direction. This is certainly a viable analysis technique. But it should be noted that the Aroon oscillator will tend to be more reactive to price changes then the Average Directional Index. This is due to the raw nature of the lines within the Aroon oscillator compared to the smoothing effect that is inherent within the ADX line.
Aroon Oscillator Strategy
Let’s now build upon our knowledge by creating a trading strategy that incorporates the Aroon oscillator. We will try to keep it as simple as possible. Many times, the most robust trading strategies only have a handful of variables. This is particularly true of trend following systems. The Aroon strategy that we will detail is also based on a trend following methodology, and will seek to take advantage of emerging price trends. Our strategy will incorporate two technical studies. The first will obviously be the Aroon oscillator, with the default setting of 25. The second study we will utilize a 200 period Exponential moving average, 200 EMA, as our trend filter.
So here are the rules for entering and managing a long position.
- The up line within the Aroon indicator must cross above the 50 threshold.
- They up line within the Aroon indicator must cross above the down line of the Aroon indicator.
- Price should be above the 200 EMA.
- Upon the above conditions being met, enter a buy order at the market.
- Enter a stop loss order below an important swing low prior to the buy entry.
- Exit and close out the position upon the down line of the Aroon indicator crossing above the up line of the Aroon indicator.
So here are the rules for entering and managing a short position.
- The down line within the Aroon indicator must cross above the 50 threshold.
- The down line within the Aroon indicator must cross above the up line of the Aroon indicator.
- Price should be below the 200 EMA.
- Upon the above conditions being met, enter a sell order at the market.
- Enter a stop loss order above an important swing high prior to the sell entry.
- Exit and close out the position upon the up line of the Aroon indicator crossing above the down line of the Aroon indicator.
Aroon Trading Strategy Example 1
We will now look at a practical example of our Aroon oscillator trading strategy outlined earlier. On the price chart below you will find the price action for the US dollar to Canadian dollar currency pair plotted on the daily timeframe.
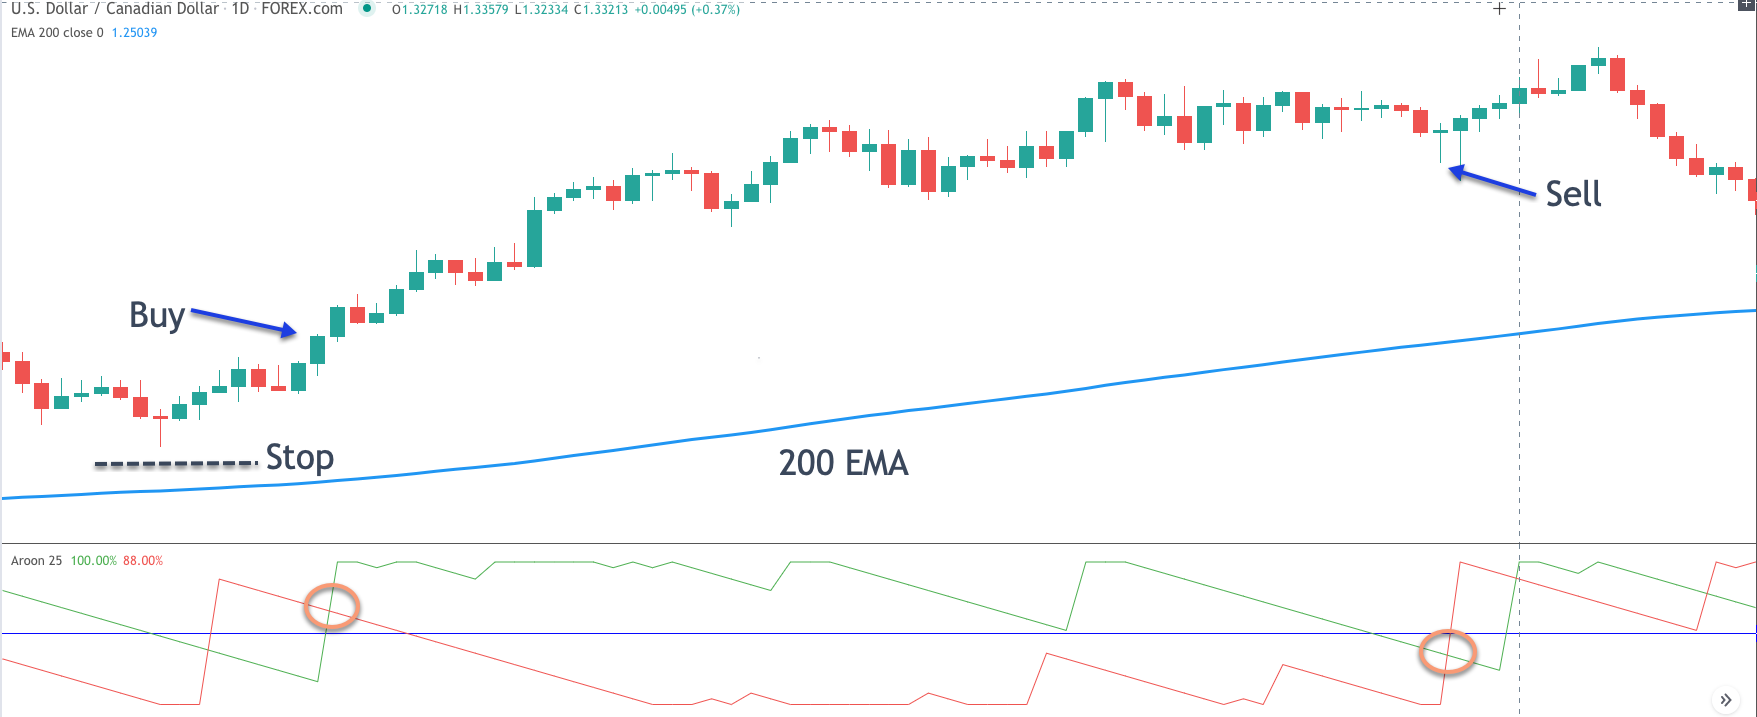
On the price chart, you can see that we have plotted the 200 exponential moving average line shown by the blue line. Additionally, on the lower pane, you will find the 25 period Aroon oscillator plotted. The green line within the Aroon oscillator represents the up line, the red line within the Aroon oscillator represents the down line, and the blue horizontal line represents the 50 threshold level.
We can see that at the beginning of this price chart, both the up and down lines of the Aroon oscillator were moving lower. Sometime afterwards, we can see that the green line, the up line of the Aroon oscillator crosses above the 50 threshold. Shortly after that, it continues to move upward, and eventually crosses the down line of the Aroon oscillator. And when this occurs, we can see that the price is trading above the 200 EMA. As such, all the conditions for a long trade set up using this strategy have been met.
As such, we would place a market order to buy. In addition, we would want to place a stop loss order to protect the position in case of an adverse move. The stop loss would be placed below an important swing prior to the buy entry signal. You can see that stoploss level marked on the price chart with the black dashed line. The exit for this position would occur upon the down line of the Aroon oscillator crossing above the up line.
Now that we are long this market, we would sit tight until either the stop loss order gets hit or our exit order gets triggered. Thankfully for us, prices began to move higher steadily following our buy entry. You can see where the down line of the Aroon indicator crosses above the up line. This would have taken us out of this position, resulting in a profitable trade.
Aroon Indicator Trading Strategy Example 2
Let’s look at one more example of this Aroon indicator strategy. In this case, we will look at a bearish scenario. On the price chart below you will find the US dollar to Canadian dollar forex pair shown on the daily chart once again. But this chart displays a downward trending market condition.
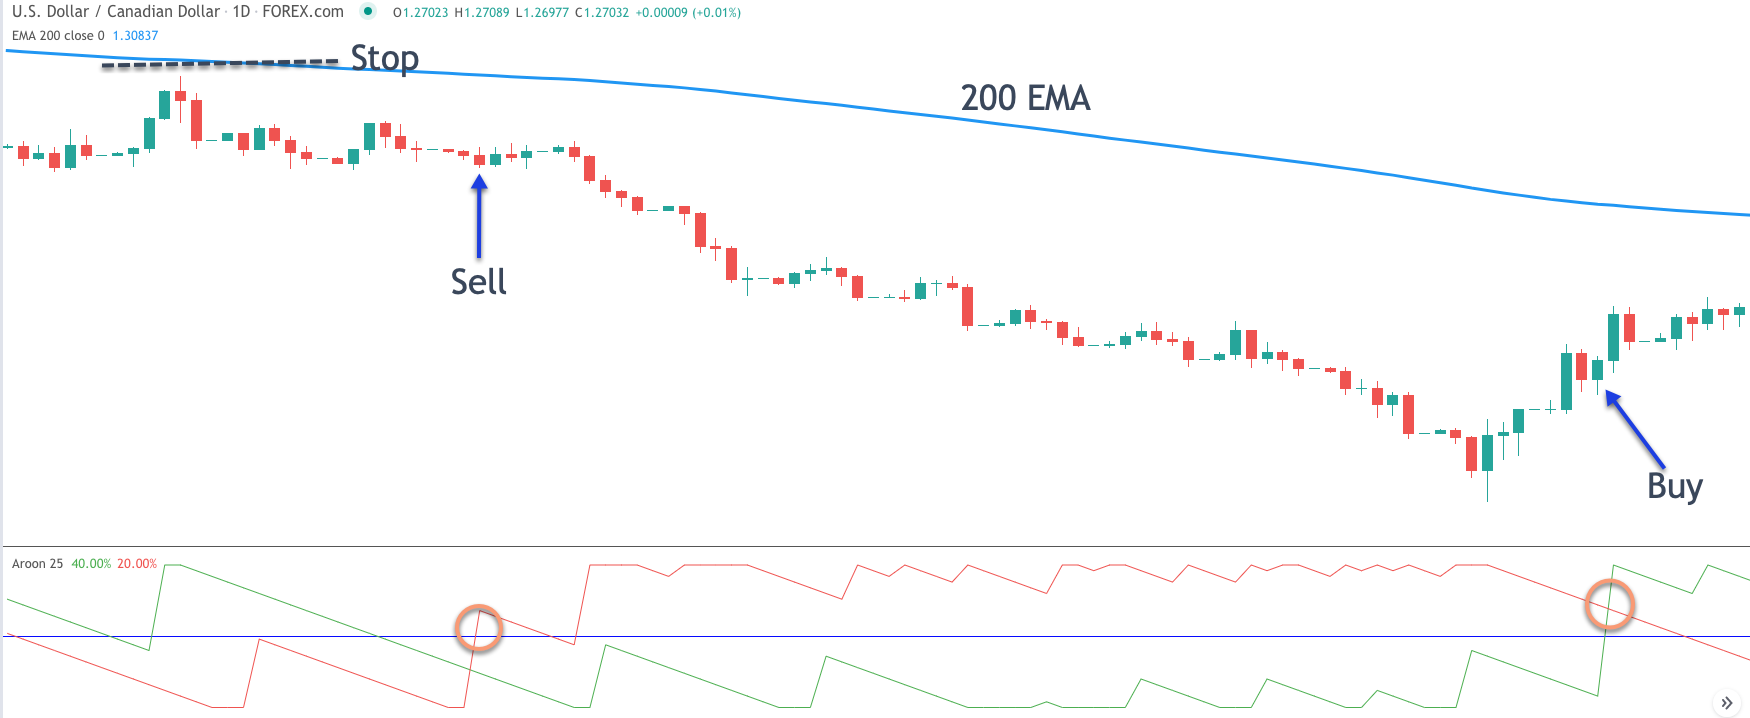
As we can see at the far left of this price chart, the price was consolidating a bit, and the down line within the Aroon oscillator was trading below the 50 threshold. After a period of time, we can see that the down line of the Aroon oscillator crosses above the green up line of the Aroon oscillator. Sometime afterwards, the red down line of the Aroon oscillator continues to move higher and crosses above the 50 threshold level as well.
You may have noticed that in this example the cross above the 50 threshold occurs after the cross of the opposite Aroon line. Either scenario is acceptable, and the most important criteria is that both of these conditions must be met prior to an entry execution. That is to say that both of these events must occur, regardless of which comes first or second, in order for us to take a trade.
Upon the cross above the blue horizontal line within the Aroon oscillator, which represents the 50 threshold, we can see that the 200 period Exponential moving average shown on the price chart is positioned above the current price. In other words, the price is trading below the 200 EMA at the time of the upper cross in the Aroon indicator. As a result, all of the requirements for a short entry have been met. And as such, we can place a market order to sell.
The sell entry is noted on the price chart. The stop loss should be placed just above an important swing high as shown by the black dashed line noted as, Stop. The exit order would occur upon the up line of the Aroon oscillator, the green line, crossing above the down line of the Aroon oscillator, the red line. You can see where this event occurs by referring to the closing buy order noted on the far right of the chart.
Summary
As we have learned from this lesson, the Aroon up and down indicator has many functional uses for the technical trader. It can help us in determining the trendiness of the market, and the strength of that trend. Keep in mind that the Aroon indicator should be used in conjunction with other complementary trading tools to a add a layer of confirmation for a trade.