One of the most interesting and alluring aspects of Forex trading is that there are so many different approaches. Some traders prefer to focus on fundamentals, making trading decisions based on their economic assessments and in reaction to news releases and or political events. Other traders prefer to focus on technicals, studying the charts to gain a better understanding of how markets move and the different elements they can use to measure and interact with these reactions.
Even within the realm of technical trading there is a diverse range of different areas to focus on. Technical elements such as support and resistance, Fibonacci trading methods, trend lines and channels, price action reading and harmonics, are all popular forms of technical analysis. However, perhaps the most popular form of technical trading is the use of technical indicators.
Now, if you aren’t familiar with technical indicators what we are referring to are built in tools on your trading platform that help traders analyse price movements. There is a wide list of traditional technical indicators measuring aspects such as volume, trend direction, momentum and so on.
Indicators such as RSI, MACD, Stochastics and Moving averages are all popular technical indicators used by amateurs and pros alike. If technical indicators aren’t an area you are familiar with, then I certainly suggest doing some extra research as they can be an incredibly effective way of analysing and trading the markets.
Now, while a lot of traders will tend to focus on just one technical indicator, typically traders will get the best results by merging different indicators. Combining trading indicators is a straightforward way of creating an effective trading system. The great news is that there is a diverse combination of technical indicators to choose from.
In this article we are going to focus on some of these combinations and show you how to get the best from trading using multiple technical indicators. Before we dive in, however, let’s just quickly walk through why we should use an indicator combination and what the benefits are of multiple trading indicators.
Why You Should be Combining Trading Indicators?
When it comes to technical trading, it is the job of the trader to seek out high probability entries. One of the best ways of doing this is through establishing confluence. Trade confluence simply refers to the overlapping of two technical elements at the same price and time point, giving the same signal. For example, a bearish pin bar at a resistance point would be confluence.
When it comes to combining trading indicators, we establish confluence through identifying two or more technical indicators giving the same signal. Now, the benefit here is that we can increase our conviction for taking a trade. If we have two or more non-correlated technical indicators or studies giving us a trading signal, the chances of it working are increased.
Additionally, in terms of creating a trading system, the use of two or more indicators gives us an enhanced set of criteria to satisfy before taking a trade. For example, if we are waiting to sell and one indicator says sell but the other doesn’t, then we don’t have confluence and therefore have no trade to take. This is really useful for avoiding taking bad trades and learning to stick to a strategy.
So, now we’ve explored the benefits of combing indicators, let’s take a look at some of the best combination of indicators.
The first one we are going to kick off with is a moving average combination. Moving averages are a fantastic technical indicator, very simple to use and very effective. The line plotted on the chart simply displays the average price over the last X periods or sessions. It updates automatically as each new session unfolds, hence the name “moving average. While moving averages are very good on their own, they are excellent when you combine moving averages of different length.
On the daily chart, some classic combinations are 9 & 21, 50 & 100, 100 & 200, 50 & 200. The way these combinations work is that when the shorter moving average crosses above the longer moving average, this is a bullish signal for the trader to buy. Similarly, when the shorter moving average crosses below the longer moving average, this is bearish signal for the trader to sell.
Of these combinations perhaps the most famous is the 50 & 200 moving averages. When the 50 MA crosses above the 200 MA, this is known as a Golden Cross and is a strong bullish signal. When the 50 MA crosses below the 200 MA, this is known as a Death Cross and is a strong bearish signal.
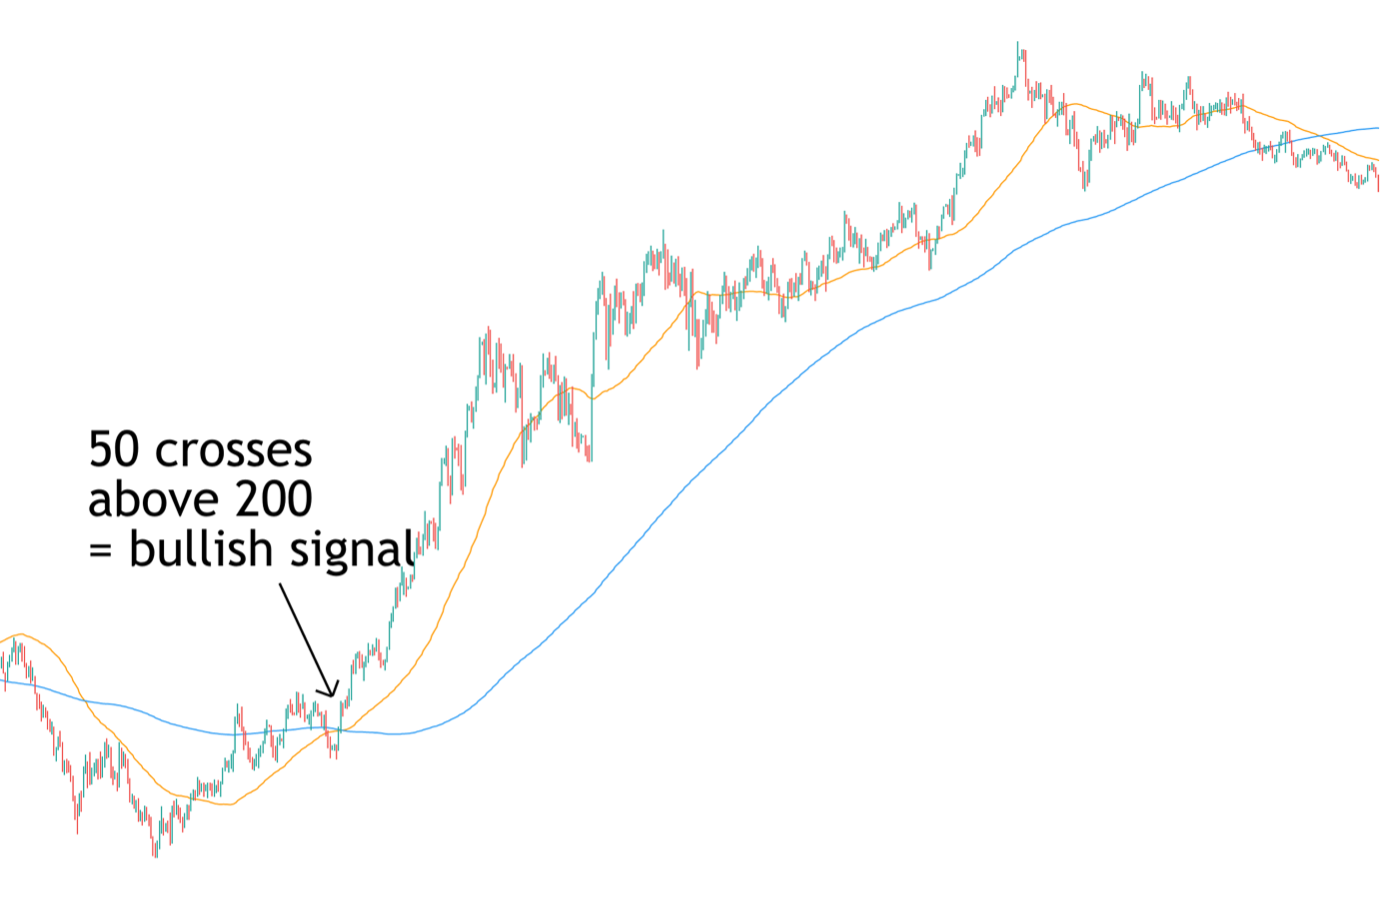
In the chart above you can see a great example of a Golden Cross. Price is trading below the moving averages to start with and then trades higher. As it does so, the 50 moving average crosses above the 200 moving average, giving us a our bullish Golden Cross, and as you can see, price trades firmly higher from there. This is a great example of how to use the moving average combination.
Now, when it comes to trading the cross you have two choices. You can either enter as the cross happens, or you can use the cross as a bullish guide to then look to buy based on other signals.
If simply entering a buy trade at the crossover, the typical way to manage the trade is to place your stop below the last swing low that occurred before the crossover. You can then either look to target 2 or 3 x your stop loss (so if your stop is 100 pips, target 200 or 300 pips) or you can look to stay in the trade until the 50 crosses back below the 200. Looking at the chart you can see that had you stayed in the trade until the 50 crosses back below the 200 you would have caught a very large trending move.
It is important to note the trades don’t always play out in such a fashion and so it is important to practice with the system and work out which methods suits you best. Another option is to close out a portion of the trade at a target level (such as 2 or 3 x your stop) and then hold the remainder until the exit crossover occurs, which allows you to still take advantage of a big trending move, in case it happens.
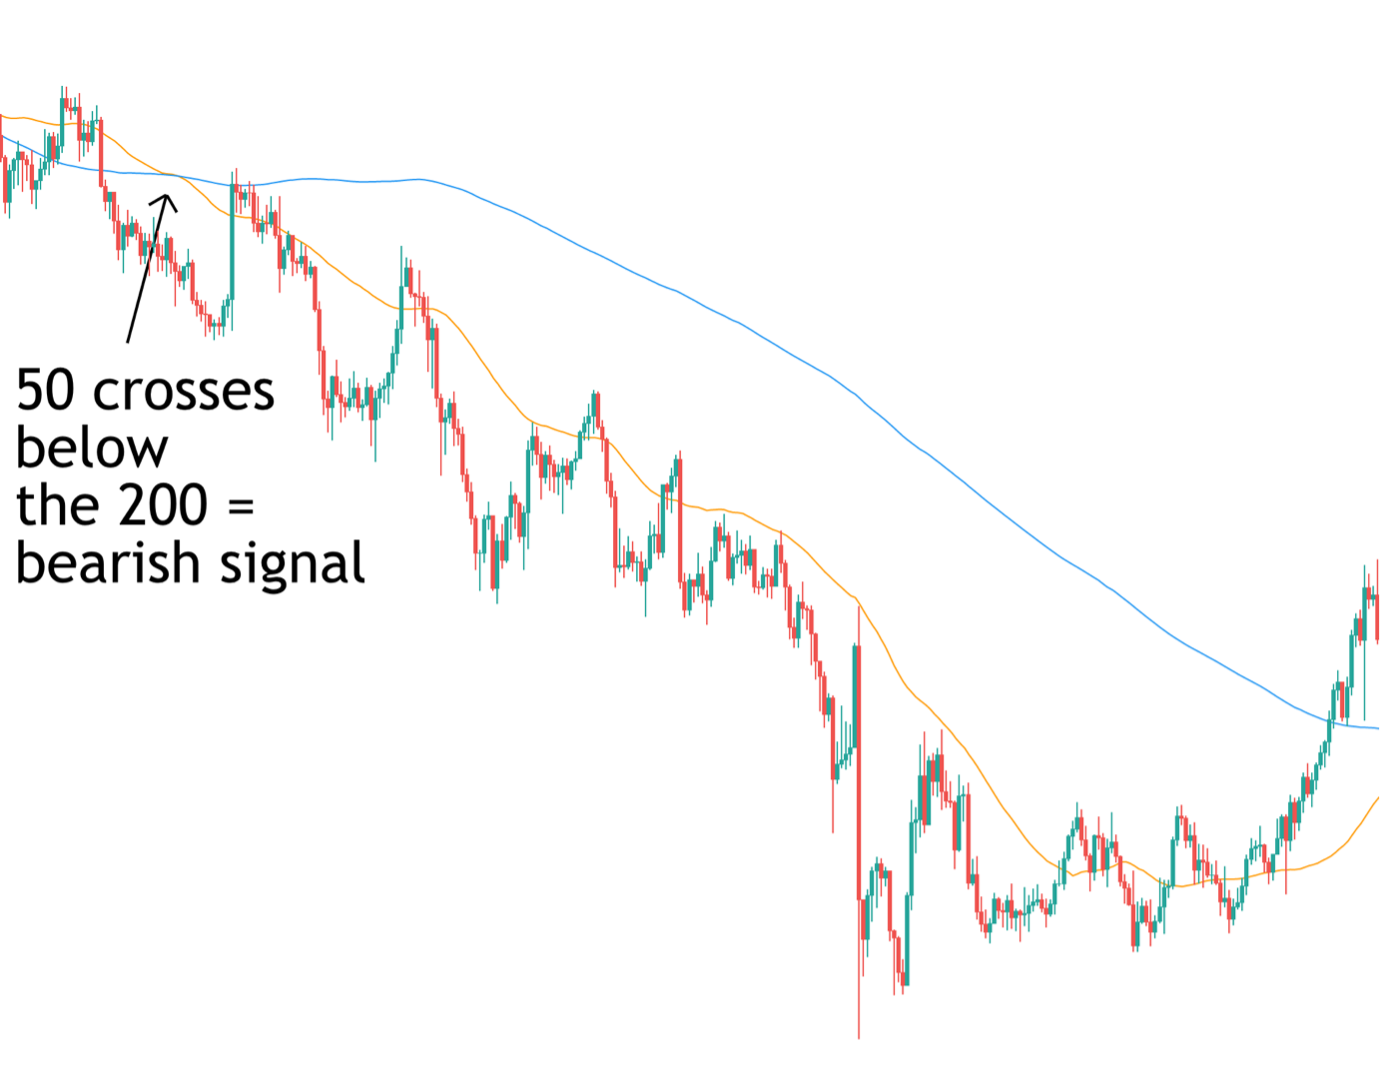
In the chart above you can see an example of the bearish Death Cross. As you can see price is trading above the moving averages to begin with and then trades lower. As it does so, the 50 moving average cross below the 200 moving average giving us our bearish signal.
Now, as with the bullish crossover, when it comes to trading this, we can either use it as a bearish guide to take other sell signals or we can simply enter a sell trade as the crossover occurs. If we enter as the crossover occurs, we place a stop above the last high that occurred before the crossover and then look to target either 2 or 3 x our risk or hold the trade until the moving averages crossover again.
So, as you can see, combining moving averages is a really great way to identify powerful trading opportunities. The beauty of the method is that it is incredibly simple to use and the indicators essentially tell you when it is time to trade.
Now, we mentioned earlier that you can use the moving average crossover to act as a guide, telling you whether you should be looking for bullish signals or bearish signals. In this instance we would establish a signal via the moving average crossover and then look to use another technical indicator for our entry point.
MACD and Stochastics Indicator Combo
When we’re looking to combine the moving average crossover with another technical indicator there is actually a better indicator we can use; the MACD.
The moving average convergence divergence indicator basically tracks two moving averages but displays them in a different format. The indicator shows you whether there has been a bullish crossover or a bearish crossover and whether the crossover is expanding (trend is growing) or contracting (trend is weakening). The MACD is a great indicator because not only does it show us the trend direction but it also shows us the strength of the trend.
So, let’s take a look at another combination of indicators that we can use if we go down this route.
So, this time around we are going to use the MACD with another great indicator, the Stochastics indicator. The stochastics indictor is a technical indicator which measures momentum in the market. It tells us whether momentum is heading downward or upwards but just as important it tells us when this momentum is overstretched and at risk of a reversal.
For example, once the stochastics indicator moves above the upper threshold, the bullish momentum in the market is overstretched and at risk of a reversal lower. Similarly, if the stochastics indicator crossed below the lower threshold, this tell us that bearish momentum is overstretched and vulnerable to a reversal higher.
So, the premise of this strategy is that we first of all look to identify a directional signal on the MACD and then an entry signal on the stochastics indicator. So, for a bullish trade we look to see the MACD turning bullish (histogram bars switching from red to green), this tells us the 50 moving average is now above the 200 moving average, telling us to look for buy entries.
At this point we then look to our stochastics indicator. So, because we know we are looking to buy, we want to identify periods when the stochastics indicator crossed below the lower threshold, telling us that bearish momentum is overstretched and likely to reverse higher. We can then place our buy trade as the indicator moves back above the lower threshold.
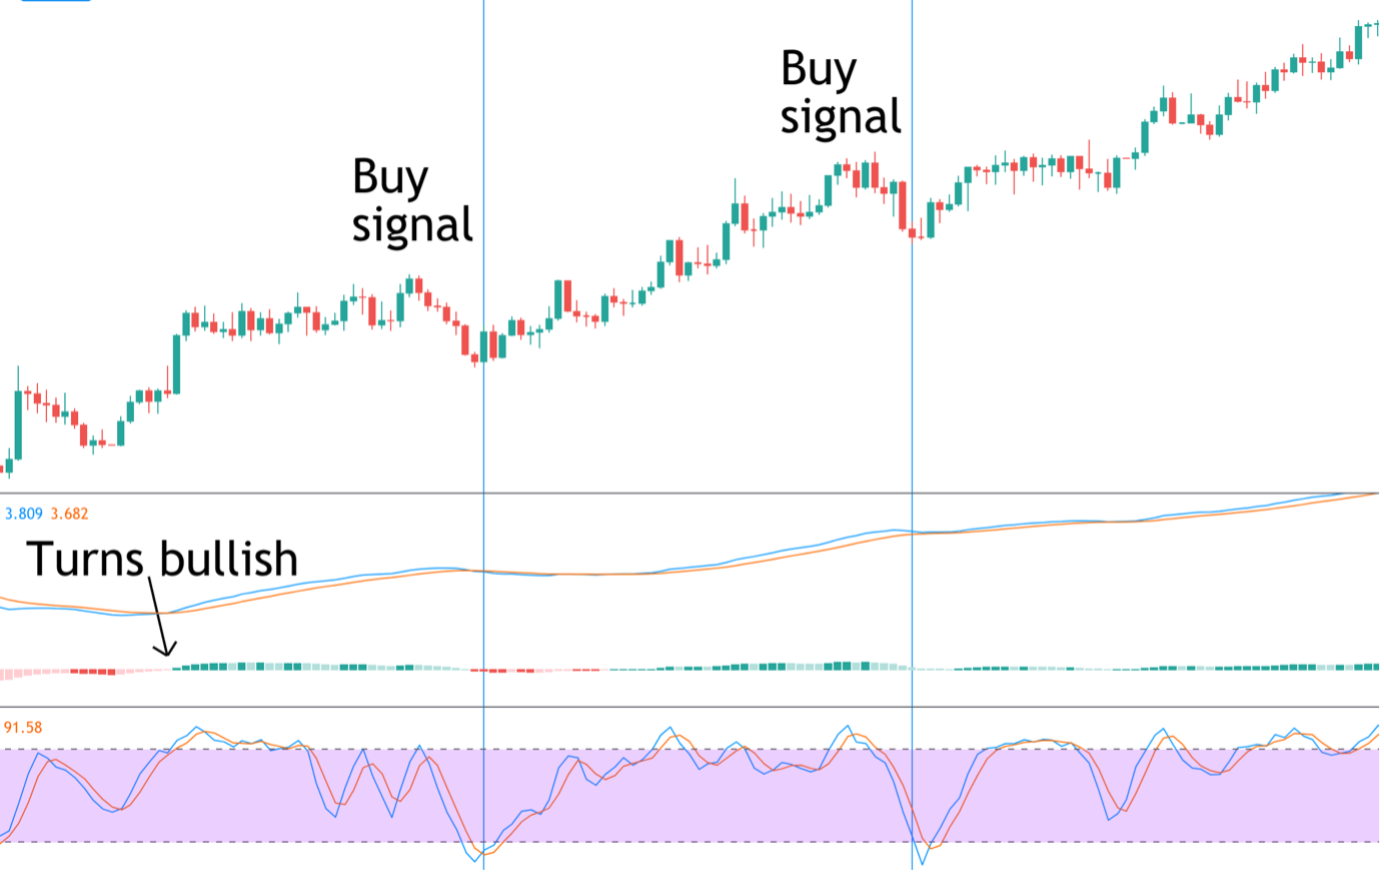
So, looking at the chart above you can see a great example of this indicator combination in action. To begin with, we can see that the MACD crossed bullish which tells us to be on the lookout for buy entries. So, looking at the stochastics indicator then, you can see there are two instances where the indicators cross below the lower threshold and then crosses back above, giving us our buy entry.
So, essentially what you can see here is the MACD indicator telling us we have a bullish trend. We then look for periods within the trend where price corrects lower and we use the stochastics indicator to time the point at which the correction is exhausted and likely to fail and the resume the bull trend.
In terms of how to manage the trade, given that we are entering a bullish trend, the best approach is to place our stop below the last low that occurred before the entry point. We can then look to target a minimum of two or three x our risk. Alternatively, we can hold the trade until the MACD turns bearish.
Once again, the beauty of this strategy is that it is very straightforward and is based on sound logic. Looking for with-trend entries is a great way to trade and can be applied on any timeframe. This is a great indicator combination for intraday trades and works just as well on the higher timeframes. It is also highly effective in different asset classes. Moreover, it is a great forex indicator combination but also works just as well in equities or commodities.
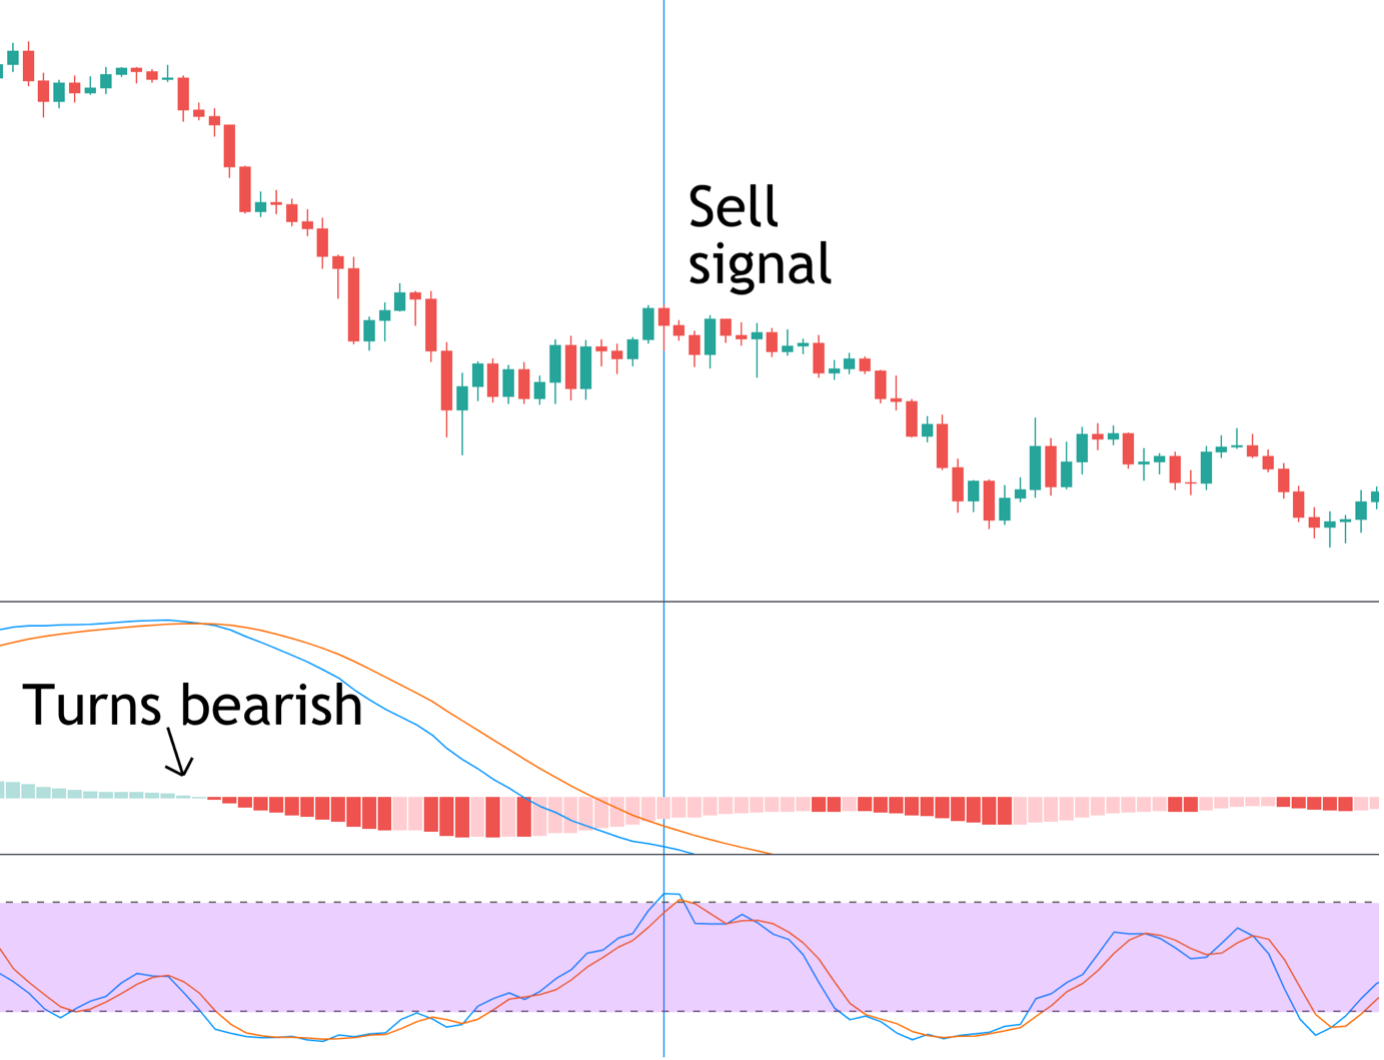
In the chart above you can see a great example of a bearish version of this strategy. So, this time around we can see first of all that the MACD indicator has crossed to red from green, telling us that the 50 moving average has crossed below the 200 moving average and the market is now in a bearish trend and we should be on the lookout for sell trades.
So, then looking at our stochastics indicator we know that we need to wait for a point where the market is correcting higher and the stochastics indicator crosses above the upper threshold. Looking at the chart you can see the point at which this occurs. The indicator crosses above the upper threshold and then moves down beneath it, giving us our sell entry and from there you can see the correction ends and the bear trend resumes.
In terms of managing this trade then, because we are entering a bearish trend this time we want to place our stop above the last high that occurred before our entry point at the crossover.
As with the bullish trade, we want to target at least 2 or 3 x our risk. Alternatively, we can look to hold the trade until the MACD turns bullish.
Final Words
So, hopefully by now you are feeling excited to get onto the charts and test out some of these strategies. As with all trading methods and setups, practice makes perfect so make sure to spend a good amount of time studying these indictors on the charts and practicing these techniques.
The beauty of using these strategies is that because the setups work on all asset classes and timeframes, there is a wealth of opportunities with these trades. This means that you don’t have to force a trade. If you open a chart and you can’t find a setup, you simply wait for the setup to occur and in the meantime you can look elsewhere.
This is incredibly useful because it prevents you from taking any unnecessary trades and ultimately should reduce the number of bad trades you take. The strategies outlined here rely on two layers of confirmation, which is very useful for keeping you out of choppy market conditions. Then once a chart starts to trend, it can help you find a great entry point.
Feel free to try out your own combination of technical indicators to see what the best combination of indicators is for you. Merging different indicators is much more robust way of approaching the market and is a great way to become disciplined in your trading, which should ultimately aid in your success.