Charts are essential in Forex trading. Nowadays you cannot trade Forex effectively without a chart. The most popular Forex charting style is the Japanese candlestick chart. Some other types of charts that are regularly used by traders include the line chart and the bar chart.
Today, however, we will discuss another charting alternative – the Renko chart. In this lesson, we will illustrate what a Renko chart is and provide some additional trading tips and strategies for incorporating it into your trading.
What is a Forex Renko Chart ?
A Renko chart is a specific type of graph for displaying price movements of a financial instrument. The chart consists of blocks (a.k.a. bricks) which are the same size. These blocks can be bearish and bullish as in a standard bar or candlestick chart.
The reason that a Renko chart has individual blocks of the same size is because a Renko chart does not take time into consideration. The Renko chart has a setting parameter, which specifies the pips taken into consideration for each block.
This parameter usually comes with the default value of 10 pips on the Metatrader platform. So, if the Renko chart is set to (10), this means that the next block would not be formed until the price action creates an increase or a decrease of at least ten pips.
In this manner, the creation of the next brick on a Renko chart takes an indefinite period of time. The block could be formed in a second, a minute, a day or a week for example. Nobody knows for sure. What we do know, though, is that it will be exactly the number of pips specified within the Renko parameter that you set.
Below you will see the difference between a standard Japanese candlestick chart and a Renko chart:
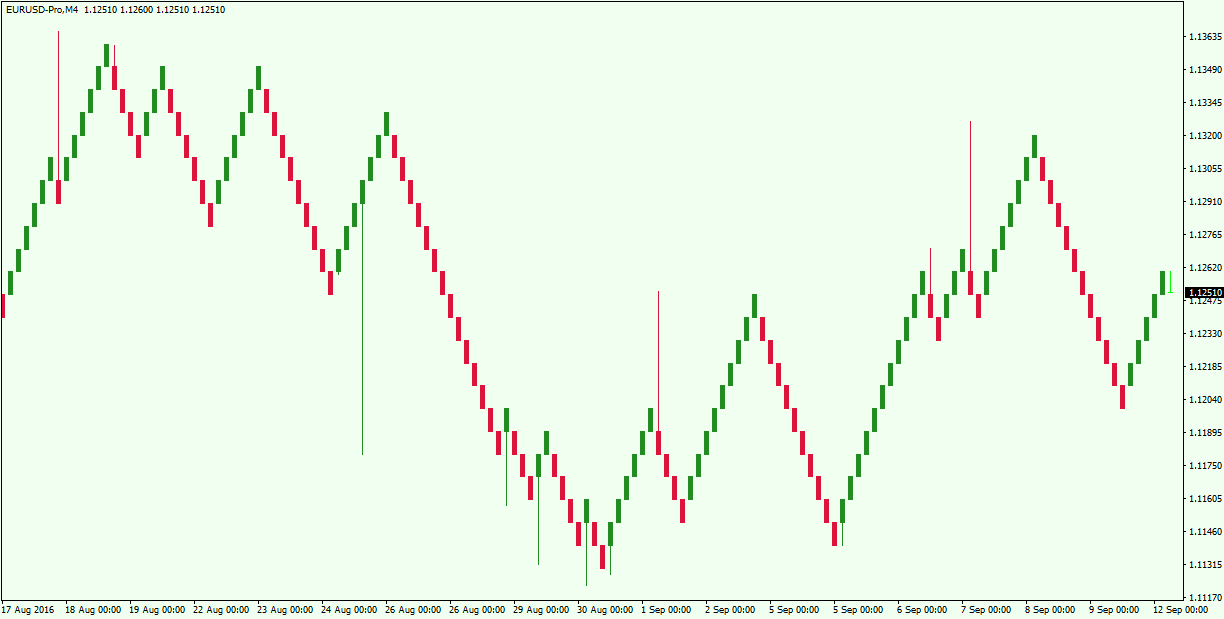
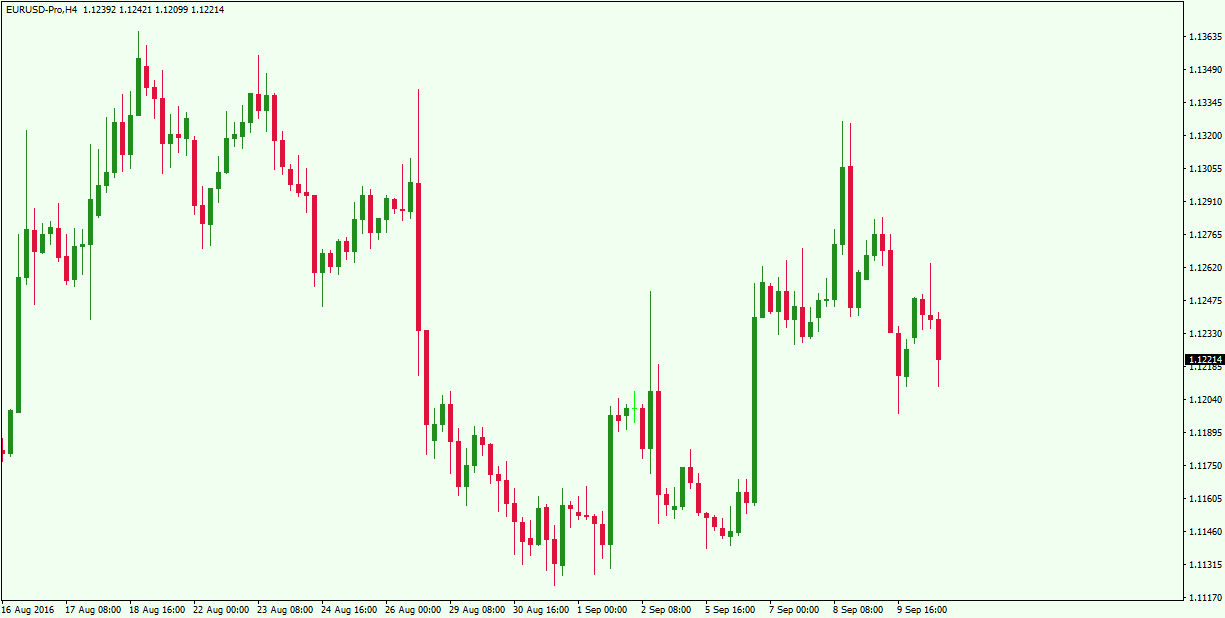
The first graph is a Renko chart that illustrates the price action of the second graph, which is a Japanese candlestick chart. See that the Renko chart smoothes the general price action. This way all the activity on the chart is presented with a more trending inclination.
Types of Renko Charts
There are two types of Renko charts based on the calculation used for the indicator:
High/Low Renko Chart
The first Renko chart we will discuss is the High/Low type. This type of Renko chart takes into consideration every price action behavior. As the High/Low name suggests, it includes the price action between the highest and the lowest point on the chart.
Open/Close Renko Charts
The second kind of Renko chart is the Open/Close type. This Renko style takes into consideration only the price moves which are included within the Open/Close range of the price action.
Have you noticed that the Renko image example we showed above includes a few big candlewicks? This is so, because the chart only takes into consideration the Open and the Close of the different periods. In this manner, some of the price action is not included in the Renko blocks. Therefore, the ticks outside the Renko blocks are displayed with these candlewicks.
Opening a Renko Chart in Metatrader
It might be a bit tricky in the beginning to open a Metatrader Renko chart. So, I wanted to take a moment to discuss how to do so. First, you should download the MQL4 file of the Renko chart indicator. Then you should put the downloaded file into the “Expert” folder of your MT4 platform. To do this, you would simply click on “File” in your MT4 terminal. Then you should choose “Open Data Folder”. This will prompt a pop up folder on your screen. Then go to the following directory: “MQL4 -> Expert”. You would simply drop the file there. Then you would restart the MT4 terminal.
When you restart and open the MT4 platform you should make sure that you have the “Navigator” panel open on the left side of the terminal. Then expand the “Expert Advisor” section in the “Navigator” panel. When you do this, you should see your Renko file there.
Before adding the file to your chart, you should make sure that you have started the “Expert Advisor” or “Auto Trading” button on the top of your MT4 terminal. If you have switched this ON, you can simply drag and drop the Renko file from the “Navigator” panel onto the chart you want to modify.
After you do this, another window will pop up on the chart. This is the settings window of the Renko indicator you have just dropped on the chart. Go to the “Common” panel and put checkmarks on these lines:
- “Allow live trading”
- “Allow DLL imports”
- “Allow import of external experts”
Then click “OK”. You may be thinking that nothing has changed, but on the top right corner of your chart you will see a text which gives you the Renko version you are using and a smiley face. Also, you will see in the upper left corner a text which tells you that you need to open a MT4 chart offline to make the tool work. This is what we will be doing now. Click on “File” again and choose “Open Offline”. A window will pop up, which contains different offline chart options. You should scroll and find the time frames listed in the upper left corner on the MT4 terminal. Voila! You now have an open Renko chart on your Metatrader 4 platform.
Advantages of the Renko Chart in MT4
Any trader that has used Renko charting knows that it is very effective for gauging the price action of the instrument that you are watching. Let’s take a deeper look into some of the advantages of the Renko chart in MT4.
Ability to Spot Trends Quickly
The Renko chart can clearly show the direction of the market. Since the chart basically smoothes the price action, we almost always have a present trend in front of us.
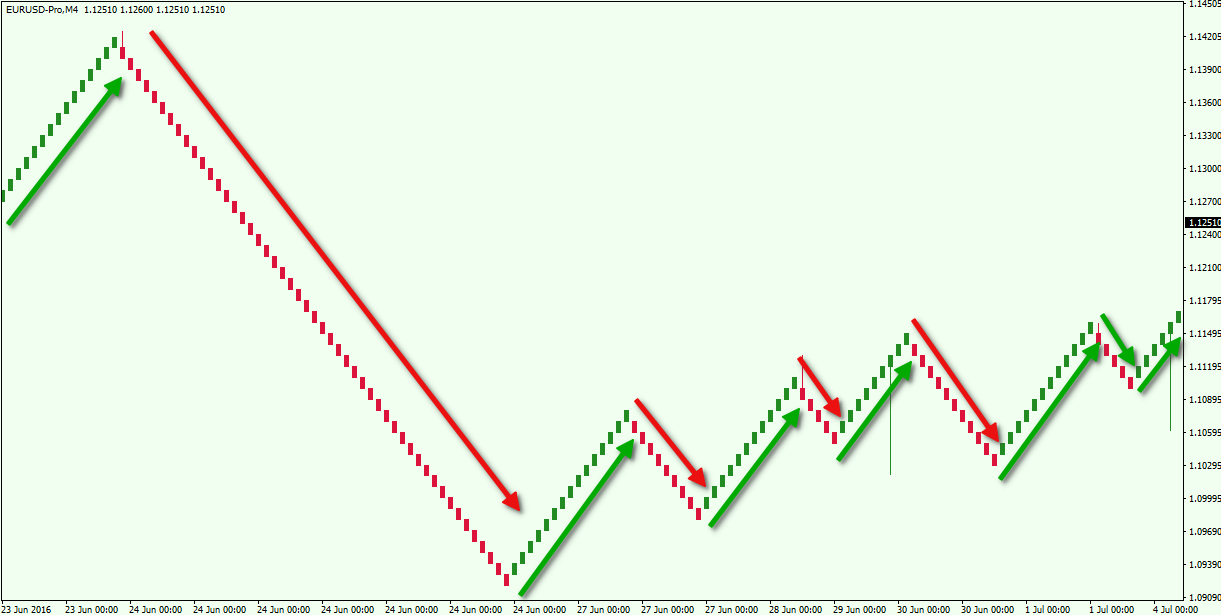
On the image above you see the different price swings on the Renko chart. Notice that there are no consolidations. There are smaller and bigger trends, but there are no overlapping ranges.
Ideal for Support and Resistance Trading
The Renko chart is very effective for identifying support and resistance levels correctly. Since the price action of the Renko chart contains the price action of a pre-specified pip movement, support and resistance levels can be very clearly displayed. Below you will see an image which shows four levels on the chart. Notice that after the price interacts with each of them, we see the creation of a new directional move.

The red circles on the chart show the moments when the Renko bars break an important level. As you see, each of these breakouts leads to the creation of a new trend. Opposite to this, the support, which is illustrated at the bottom of the chart is the beginning of a new upwards movement. After the price bounces twice from it, we see the creation of a new bullish trend.
Easy-to-Find Chart Patterns
As with support and resistance identification, chart patterns are also much easier to recognize on a Renko chart. Let’s take a look below:
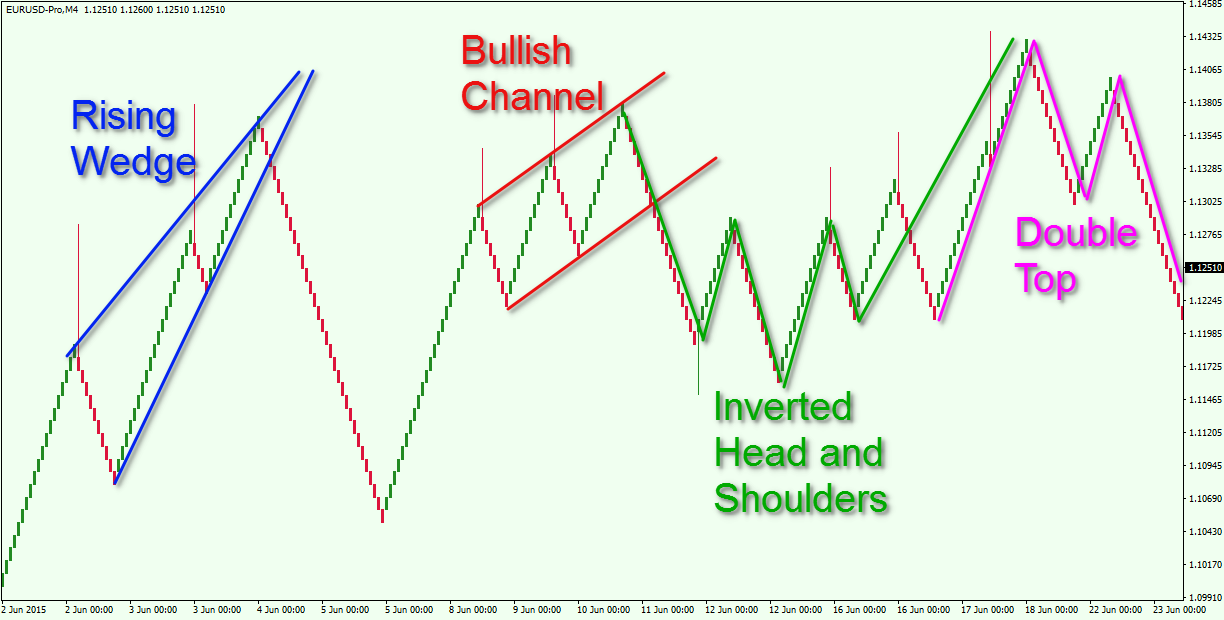
The Renko chart above shows four classical chart patterns.
The blue lines illustrate a Rising Wedge pattern. As you can see, the price drops after breaking the lower wedge line.
Then comes a bullish channel, which is illustrated with the red lines. Notice that the price action creates swings in the frames of the channel. After the bearish breakout, the price decreases.
The next pattern is shown in green, and it is an Inverted Head and Shoulders pattern. After the creation of the second shoulder, the price increases again.
The magenta figure is a Double Top pattern. The decrease which comes at the end proves the validity of the figure.
Breakout Confirmation on Renko Charts
The basic function of the Renko chart is to provide a clearer level of price action analysis.
One of the most popular methods of using the Renko chart is to trade breakouts. Though this is a valid method, I would suggest that you confirm breakout signals on the Renko chart. Try to confirm a breakout with a second candle. If a Renko candle goes beyond a trend line make sure you see another candle, which extends beyond the breaking candle.
Forex Trading with Renko Charts
Let’s now discuss a couple of trading strategies using Renko charts:
Trend Line Breakout Renko Trading Strategy
As we have touched on a bit earlier, an effective way to trade with Renko charts is by spotting breakouts in trends. The Renko chart structure is very precise in building trends. As such, trend lines on a Renko chart are relatively accurate.
So, a valid trendline breakout confirmed by a second Renko block should give us a reasonable amount of confidence for predicting the beginning of the trend reversal.
Typically, you would wait to open a position until after a Renko bar breaks beyond a trend line and a second Renko bar extends beyond the breaking bar.
Once this occurs, you should put a stop loss beyond the most recent or high or low swing point created prior the breakout. You can use price action based clues to hold onto the position until such time as the weight of evidence shifts in favor of the opposite direction.
See the example below of how a trend breakout using the Renko chart would appear:
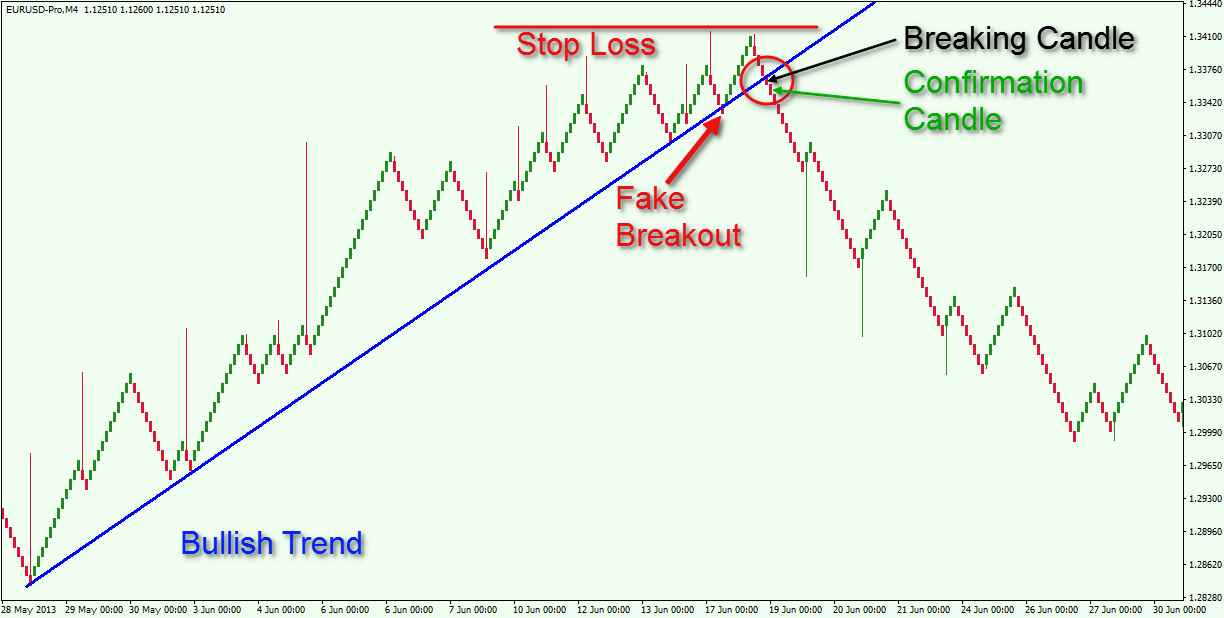
Above you see the Renko chart of the EUR/USD, which contains the period between May 28, 2013 and June 31, 2013. The image illustrates a strong bullish trend which eventually gets broken to the downside.
Notice that the trend line is very well positioned – one of the positives of Renko based trading systems. A fake breakout appears first, which is referenced by the red arrow. Shortly after that, on the subsequent test, you will see that a Renko block closes below the trend. A Renko candle goes beyond the trend line, and the next candle extends even lower. This would be an opportune place to sell the EUR/USD Forex pair.
You should place your stop loss order right above the highest swing point before the breakout. This is shown by the red horizontal line on the image above.
As you see, the price action begins a to fall afterward. Let’s now shift into trade management mode:
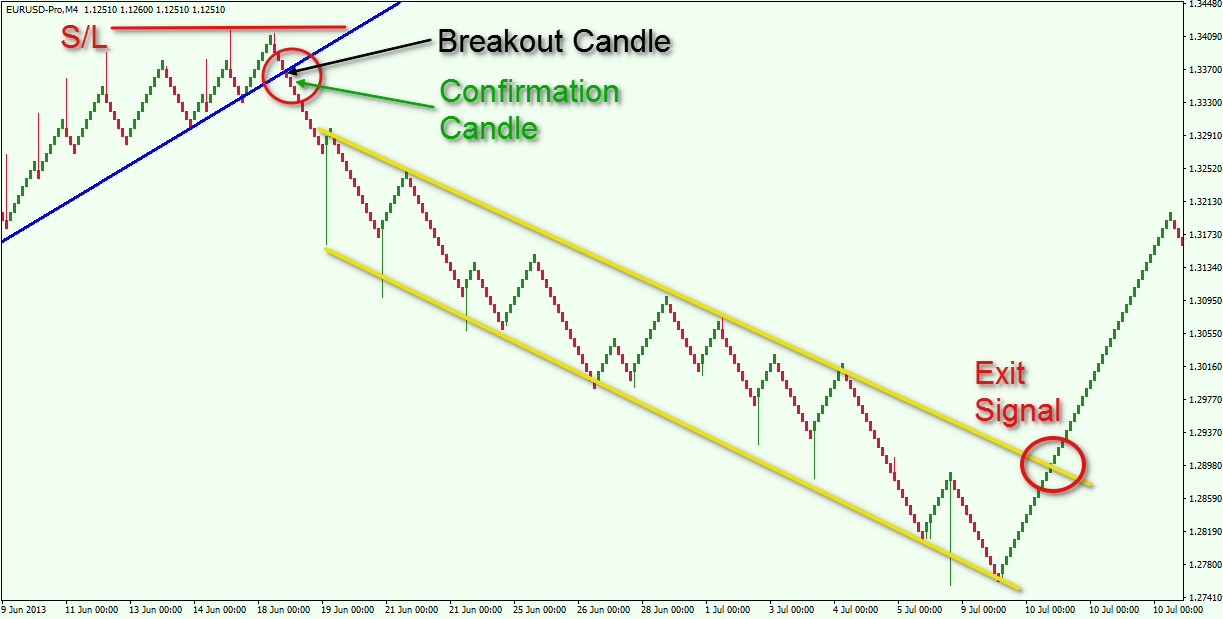
This illustration is the continuation of the price action after the trend breakout. The yellow lines on the image above show that the EUR/USD enters a bearish channel corridor. The trade should be held as long as the Renko price action is located below the upper yellow bearish channel. Of course, the breakout in the yellow channel should also be confirmed by a further block in the direction of the break.
As you see, we did have an upside breakout of the channel, and the price action after this bullish breakout represented a strong reversal of the bearish trend. Fortunately, per our rules, the breakout of the upper line of the yellow bearish channel would have gotten us out of the trade at the right time.
Support and Resistance Renko Strategy
This Renko strategy involves entering trades after the price action breaks an important horizontal support or resistance on the chart. If a support is broken downwards, you would be looking to short the Forex pair. If a resistance is broken upwards, you would want to buy the Forex pair. Don’t forget to confirm the breakout with the second Renko block.
If you trade a support breakout, you would typically put a stop loss above a top, created prior the breakout. If you trade a resistance, you would typically put a stop below a bottom, created prior the breakout.
Then the trade would be managed using simple price action based clues.
So, let’s see how a trade using Support and Resistance breakouts with a Renko chart looks:
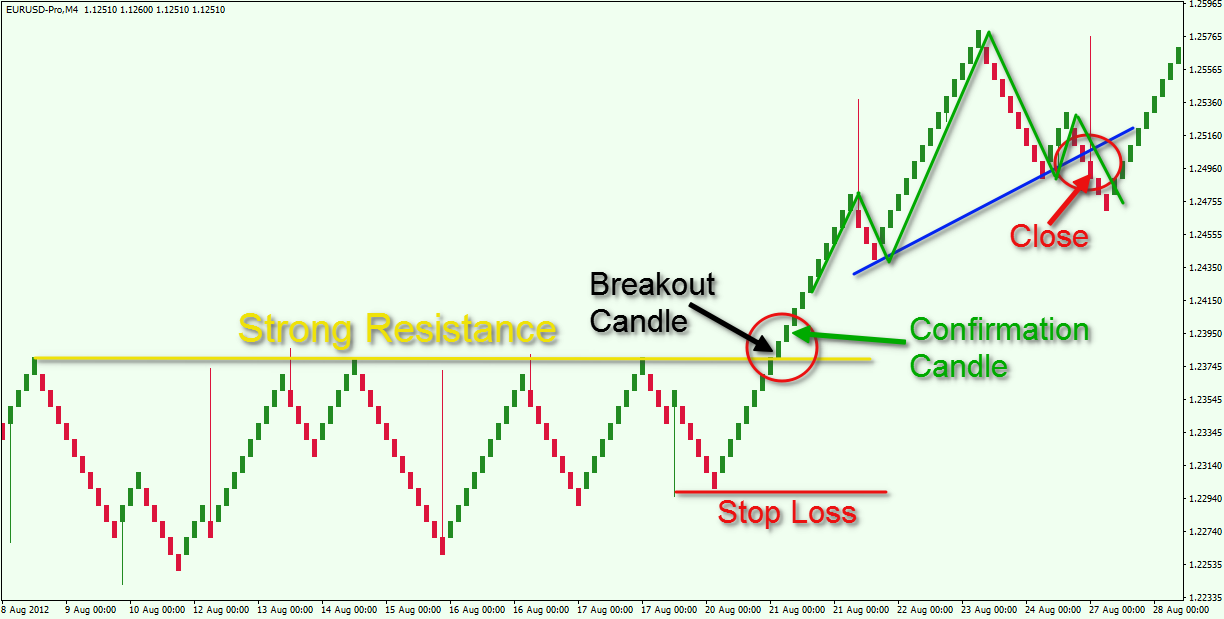
Again, we have built the Renko chart on the EUR/USD Forex pair. The image shows a resistance breakout.
The yellow horizontal line is a strong resistance level. When the price meets the yellow resistance for the 7th time, we see a breakout. First, comes the breakout bar and then the confirmation. You can buy the EUR/USD when the confirmation block is completed.
Then you would want to place a stop loss order below the bottom prior the breakout. The red horizontal line shows this on our Renko chart.
The price breaks the resistance and increases further. On the way up the price action creates a Head and Shoulders chart pattern. As you know, this pattern has a strong bearish potential. However, we need confirmation that the pattern is valid. In this manner, the trade should be closed when the Renko price action breaks the blue neck line on the chart. Again, you don’t close the trade when a block breaks the blue neck line, but when a second block finishes below the breaking block. This is all shown in the red circle pointed with the red arrow and the “Close” text next to it.
Take note that the yellow resistance is extremely accurate on the image. The level is very easy to recognize using this Renko chart structure. Also, the Head and Shoulders pattern we used to close the trade was also relatively clean on the chart.
Conclusion
- The Renko chart displays price action disregarding the time factor.
- The chart consists of blocks, which are also called bricks, or candles.
- The default parameter of the Renko chart is 10, which means that a block is formed only after the price moves 10 pips upwards or downwards. This setting can be changed per your preference.
- There are two types of Renko charts based on their calculation:
- High/Low Renko Charts – takes into consideration the highs and the lows on the chart
- Open/Close Renko Charts – takes into consideration the open and the close on the chart
- Some of the positive attributes of the Renko chart are:
- Very handy for spotting trends.
- Provides accurate support and resistance areas.
- Chart patterns are easy to recognize
- You should always confirm breakouts with a second Renko block – it needs to close beyond the breaking block.
- A couple of the approaches for trading with Renko Bars are:
- Trend Line Breakout Renko Trading Strategy
- Enter a trade when the price action breaks a trend and a second block breaks the breaking candle.
- Put a stop beyond the last swing prior the breakout.
- Stay in the trade as long as the price is trending in your favor using simple price action rules.
- Support and Resistance Renko Strategy
- Enter a trade when the price action breaks a horizontal support/resistance level and a second block breaks the breaking candle.
- Put a stop loss beyond the last top/bottom created prior the breakout through the support/resistance.
- Stay in the trade as long as the price is trending in your favor using simple price action rules.
- Trend Line Breakout Renko Trading Strategy