There are several different class of indicators that a trader can utilize. And based on the specific goal, such indicators can help in the overall decision-making process. Most traders are familiar with momentum based indicators such as RSI and Stochastics.
But there are also other types of indicators that are based on volume, volatility, cycles, or some other measure. In this lesson, we will discuss a specific trading indicator that measures the volatility of a currency pair. It is called the Average True Range indicator, commonly referred to as ATR.
What is the ATR Volatility Indicator?
The Average True Range is a single line indicator that measures volatility. The indicator was originally developed by J. Welles Wilder to measure the volatility of commodities within the futures market. ATR does not measure price trends or price direction like other common indicators like the MACD or the Momentum indicator. Instead, the ATR indicator simply shows when volatility is high and when it is low.
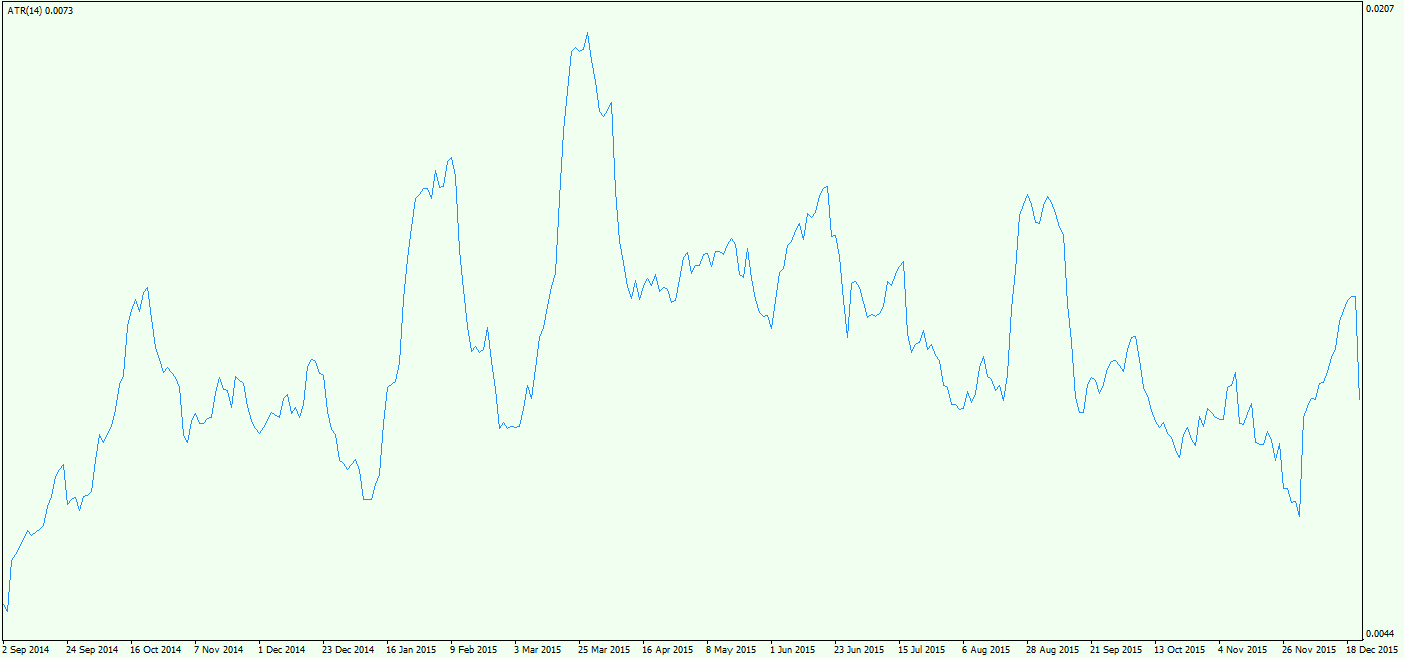
This is an enlarged view of the ATR Indicator, which is usually attached in a separate window to the bottom of your chart. The single line of the ATR indicator fluctuates within a range. High prints of the ATR line indicate that the market is experiencing high price volatility. On the other hand, depressed ATR levels imply that the price volatility within the market is relatively low.
Traders can use the prints of the ATR line to consider entry and exit points based on price volatility. When volatility is high, Forex pairs are likely to be dynamic and faster moving. In contrast, low volatility is associated with a quiet market or consolidation period.
Although the ATR indicator is not as widely used by retail traders as some other momentum based indicators, it serves an important purpose for volatility conscious traders who are interested in gauging the current level of volatility or trying to anticipate potential price breakouts. Experienced traders are aware that markets move from periods of low volatility to high volatility and back again constantly. As such, the ATR is an invaluable trading tool for those that can appreciate this ebb and flow within the market.
Average True Range Calculation
To calculate the Average True Range, you will first need to identify the True Range of the period on the chart.
To discover the True Range on the chart, you should do three calculations and take the one that gives the highest value:
(High of the Current Period) – (Low of the Current Period)
(Current Period High Absolute Value) – (Close of Previous Period)
(Current Period Low Absolute Value) – (Close of Previous Period)
The highest result from these three formulas gives you the actual True Range on the chart. When you get the True Range, you should simply average the values for the period on the chart. The average calculation is done using an Exponential Moving Average on the values.
Fortunately, most trading platforms offer the ATR indicator as a tool and will calculate these values automatically. So, it is not necessary to do all these calculations yourself, however, it is important to understand how the indicator is composed so you can use it most effectively. The default Average True Range formula uses a 14-period EMA indicator. However, you can manually adjust the period taken into consideration. The indicator then recalculates based on the new input.
ATR Volatility Analysis
As we touched upon earlier, the ATR indicator can be used to perform volatility analysis on the chart. The Average True Range tells you when volatility is high and when it is low. One of the best applications of the ATR volatility indicator is that it can help you to place your stop loss order in a manner which is consistent with current market conditions. Basically, it will help you to avoid placing stops too tight during high volatility periods and placing stops to wide in low volatility periods.
In addition, it can assist you in setting higher probability take profit points. For example, If the ATR has a relatively high reading, you might consider staying in the trade for a bigger target on the expectation that the increased volatility can lead to a larger favorable price move.
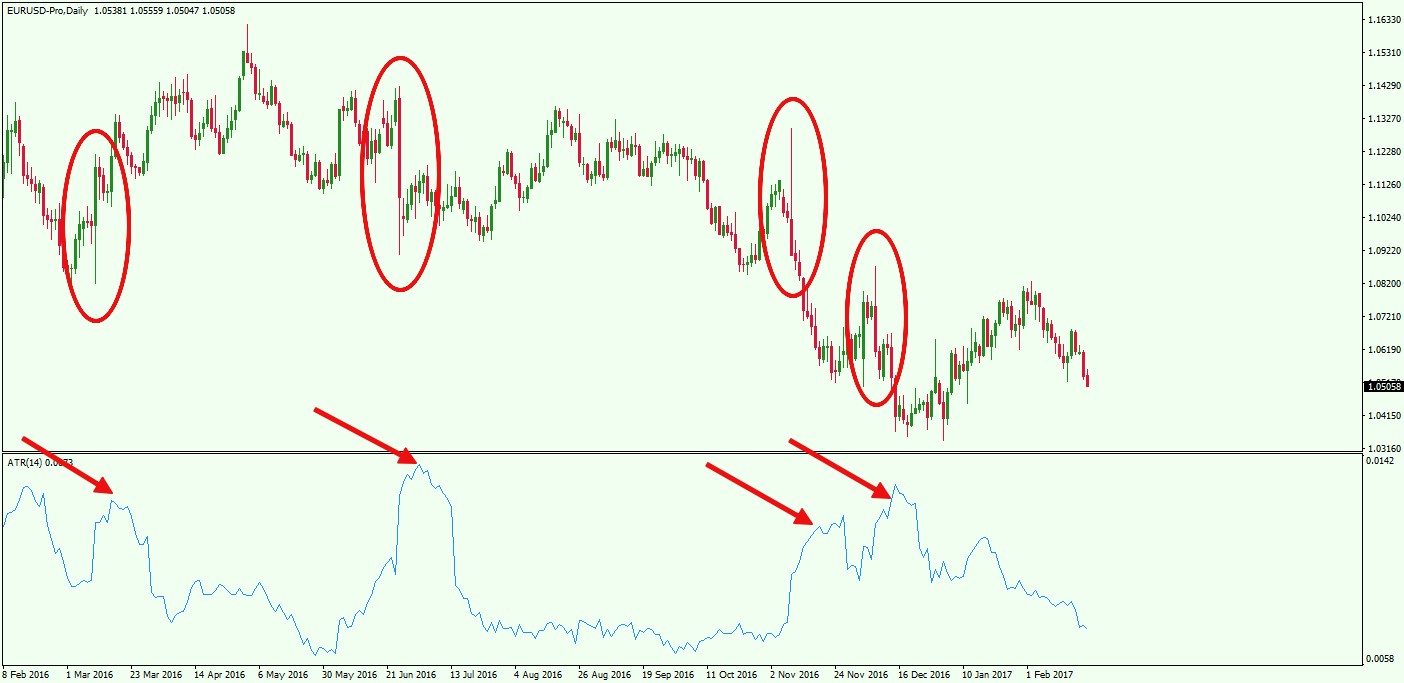
In the example above you see the EUR/USD chart for February 2016 – February 2017 with an ATR indicator attached at the bottom. The red arrows on the ATR indicator point to times when the values are relatively high, which is associated with high price volatility. Notice, the large volatile candles on the upper price chart at these corresponding times.
Contrary to this, when the ATR readings are low, the market is relatively quiet as it has entered a period of low volatility. Candles are small, price action is calm, and the EUR/USD is consolidating rather than moving directionally. When the volatility is low, you can adjust your Stop Loss orders tighter. At the same time, your targets should be smaller as well, since the price is not expected to move much.
The ATR indicator can also be used to project future tendencies. If you notice that the ATR line is steadily trending upwards, then you can assume that volatility is likely to remain high. And for a steady down sloping ATR, we can expect continued range-bound type environment in the near future. At the same time, you should be on the lookout for a transition from low to high volatility or high to low volatility to prepare you for a change in market condition.
MT4 ATR Indicator
The ATR indicator is built into the MetaTrader 4 trading platform – the most commonly used Forex trading terminal. To activate the MT4 ATR indicator you should simply go to Insert > Indicators and choose Average True Range. The indicator then attaches to your chart with its default average setting – 14-period Exponential Moving Average.
If you want to change this setting, you should simply drag the mouse cursor to the indicator at the bottom of your chart and click the right mouse button. Then you would choose “ATR(14) Properties…”, which will bring up the following pop-up window:
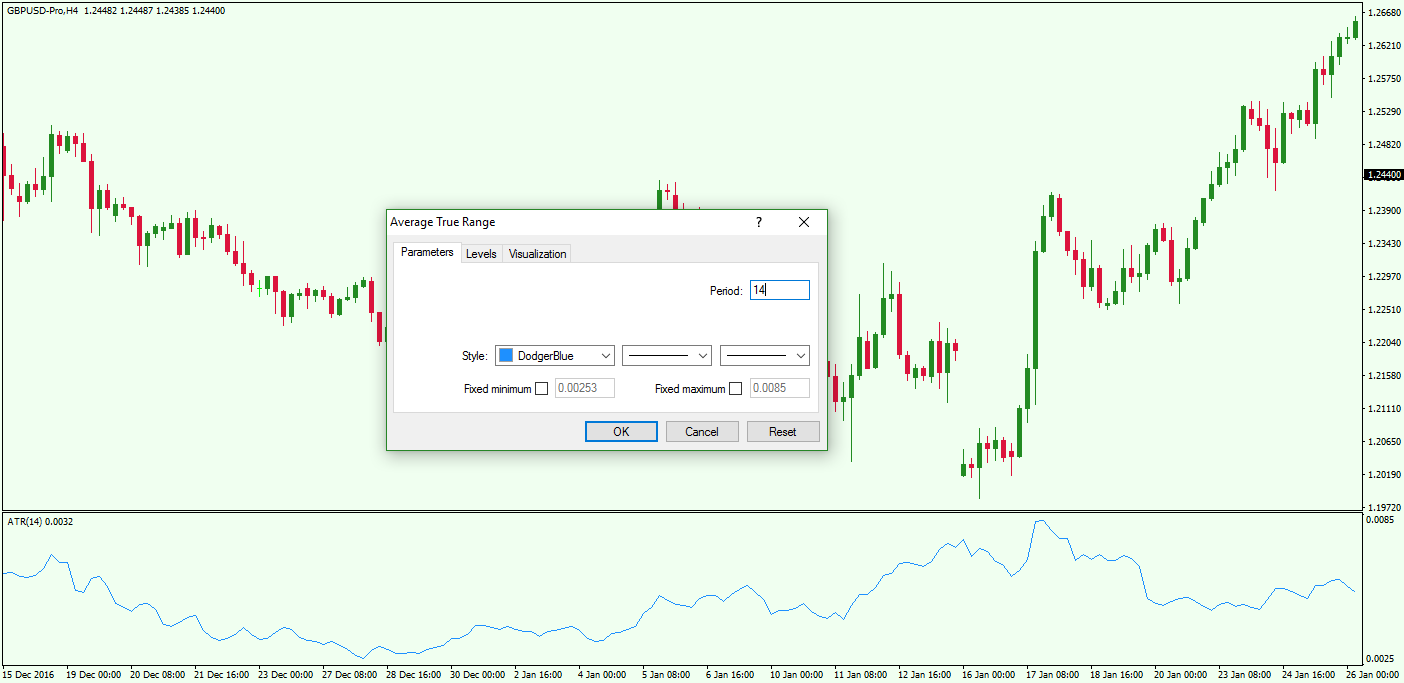
Then under the “Parameters” tab, you will see a field named “Period.” Simply change the default “14” value to your preferred setting. The new settings of the MT4 ATR indicator will be applied automatically.
Practical Application of Average True Range
Since ATR is primarily a price volatility study, it cannot be used as a standalone tool for trading the market. You will use it in combination with your trading methodology to fine tune your entry, stop loss placement, and profit target.
One of the most effective ATR strategies is one that includes price action analysis and a Trailing Stop Loss order based on an ATR value. You can use price action patterns as entry signals on the chart. These could be chart patterns, candle patterns, trend lines, trend channels, etc.
Stop Loss Placement
One you have entered into a trade, you can use an ATR based trailing stop. The point is to use the value from the Average True Range indicator to determine the distance you want to trail the price. When the price action moves in your favor afterward, the stop loss will also move along with price taking into account the distance you have set from the current price.
But, if the price action moves contrary to your trade, the ATR Trailing Stop will stay still. As such, an ATR trailing stop will help provide for a looser stop as prices moves in the direction of your trade, allowing you to extract the maximum amount from the market when there is a persistent trend.
There is a simple rule to determine a Stop Loss within an ATR trade management approach. If the ATR indicator line is in the upper half of the area, you can consider the currency pair as relatively volatile, putting a looser Stop Loss order in the market. If the ATR is giving a value that is located in the lower half of the indicator, then you can use a tighter Stop Loss order, since the price is relatively less volatile than normal.
Setting a Target
Now we will discuss some simple guidelines for managing your exit using the ATR indictor. If the ATR line is in the upper half of the indicator during your trade, you can consider multiplying the minimum potential of your pattern by 2. This means that you can try and hit a target twice the usual for the pattern. You may want to use a scale out method when doing this or decide to exit the full position at the bigger target.
On the other hand, if the ATR line is in the lower half of the indicator, then you may want to only target the minimum potential of the pattern. The same idea is in force if the ATR line is steadily trending upward or downward. If you enter a trade where the ATR is in the lower half, but the line is trending upward, you can still consider the double target option on the chart.
Let’s say the price breaks a triangle pattern in the bullish direction. As a result, you decide to buy the respective Forex pair on the assumption that the price is increasing. The triangle pattern rules state that you should stay in the market for a minimum price move equal to the size of the pattern. However, if the ATR is giving you high values at this time, you may consider staying in the trade for a price move equal to twice the size of the triangle target. As an option you could exit half your position on the original target and close the other half at the second target.
In some cases, the patterns or trade setups may not have a calculated target. This is when the ATR Trailing Stop comes into play. With this, you would simply hold the trade as the price is trending in your favor and exit when the Trailing Stop Loss order gets hit.
Example of Trading with ATR and Price Action
Now let’s take a look at an ATR based trade management strategy in action.
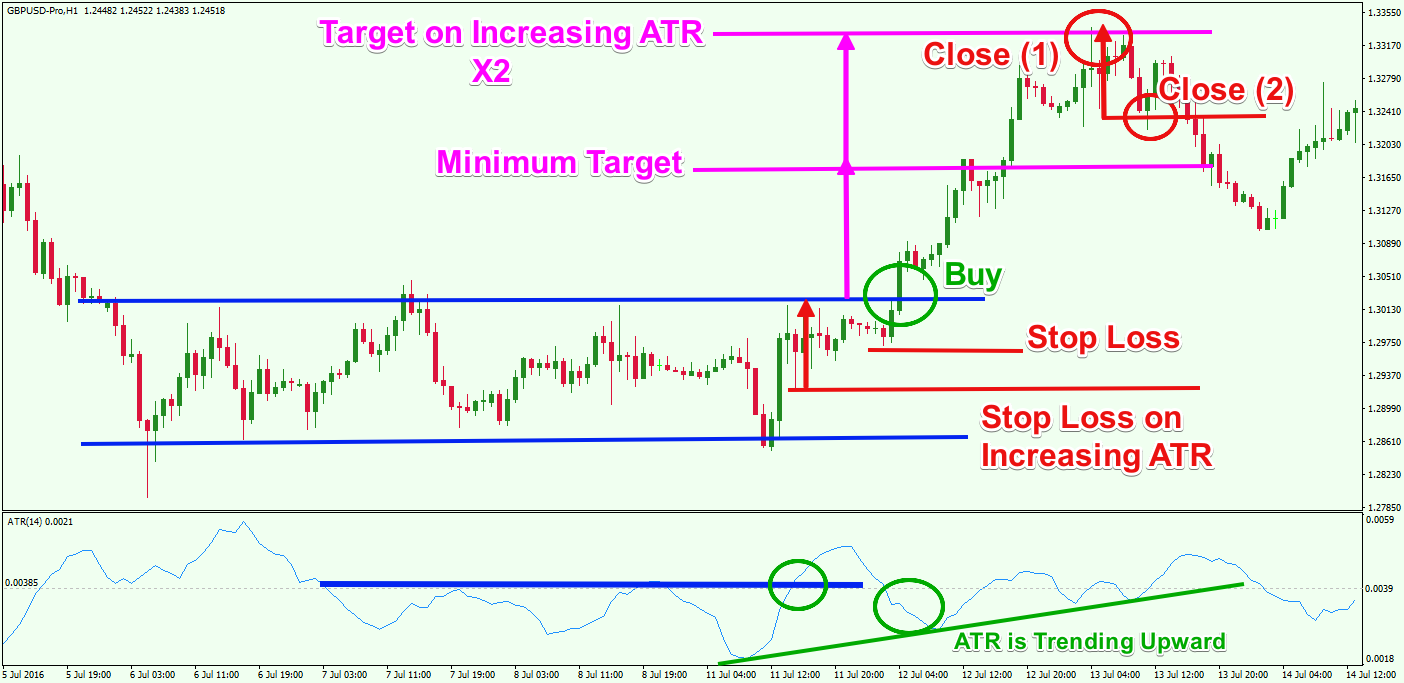
We are now looking at the H1 chart of the GBP/USD Forex pair for July 5-14, 2016. The image shows an example of an ATR trading strategy where a long trade is opened when a bullish breakout occurs through the upper level of a range. Notice that we have marked the middle level of the ATR indicator at 0.0039 in order to bisect the upper and the lower part of the indicator.
The blue horizontal lines on the price chart mark the range of the GBP/USD. The blue horizontal line in the ATR area shows the ATR line at the middle level.
Notice that the ATR line breaks the middle level and shifts into the upper half of the indicator. However, the price is still located in the horizontal channel. Later, the price breaks the range through the upper level, giving us a long signal. The ATR line is in the lower half of the indicator at this moment. Therefore, you could buy the GBP/USD with the initial idea that you will pursue the minimum target of the pattern equal to the size of the range.
But on the way up we see that the ATR line starts trending upward. At the same time, we see that the line moves in the upper half of the indicator a few times. This gives sufficient reason to believe that the GBP/USD volatility is increasing. Therefore, you have the option to extend your target by using the x2 rule. You should also adjust your ATR Trailing Stop Loss as shown on the image.
Then you could hold the trade until the price reaches 2x the size of the range, shown with the two magenta lines.
The first red arrow indicates the distance between the adjusted Trailing Stop and the entry price. The GBP/USD price decreases by this level right after the 2x target is reached on the chart. The second arrow you see at the end of the chart shows the moment when the price would have hit the ATR Trailing Stop if you had not already closed the trade.
Let’s see the power of the ATR Trailing Stop with another example.
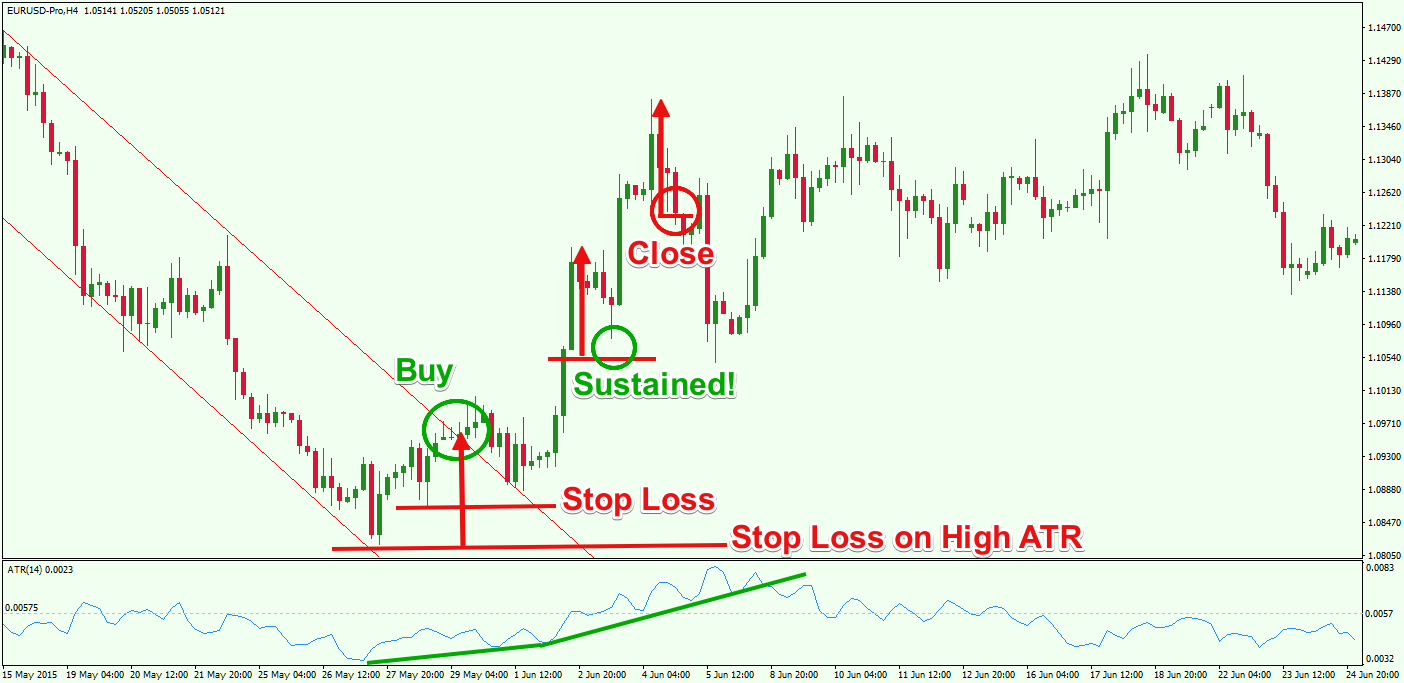
This time we have the H4 chart of the EUR/USD for May – June 2015 where we give an example of a closed trade using the ATR Trailing Stop.
The chart begins with a bearish channel. Suddenly, the price of the EUR/USD breaks the bearish channel through the upper level during relatively low ATR prints. You could buy the EUR/USD at this moment, placing a Trailing Stop Loss order under the previous bottom on the chart as shown on the image – about 90 pips distance.
The price tests the already broken upper channel level and bounces upward on sharply increasing ATR values. As such you could adjust the distance of your Trailing Stop to contain the volatile price action in a better way. You could measure the distance between the breakout point and the low of the previous bearish channel and apply the parameter as a new pip distance for your Trailing Stop Loss – about 140 pips.
The price action creates a couple of strong bullish impulses before hitting the Trailing Stop. See that after the first impulse the price creates a correction that nearly hits the Trailing Stop (red arrows). However, the Stop Loss order is well positioned, and it sustains the pressure. If you haven’t adjusted the distance of the Trailing Stop on the volatility increase, the Stop would have been hit, putting you in a position to likely miss the next sharp impulse. After the second impulse, the price action starts a general consolidation where the Trailing Stop eventually gets hit.
This is a channel breakout trade which has no specific target rules. This is when the Trailing Stop comes in most handy. Also, there are cases when you want to scale out rather than go for the full target, which is another case when the Trailing Stop can be useful. Just don’t forget to loosen and tighten the ATR Trailing Stop based on values shown on the ATR indicator.
Conclusion
- ATR stands for Average True Range. It was developed by a famous technical analyst named J. Welles Wilder
- The ATR is an indicator that measures price volatility, originally designed for commodity trading.
- High ATR values indicate high volatility. Low ATR values imply that volatility is relatively low.
- The indicator consists of a single line that fluctuates around a range.
- The ATR Calculation is as follows:
- The Average True Range formula involves the initial calculation of the True Range on the chart, where you should take the highest value of these three formulas:
- (High of the Current Period) – (Low of the Current Period)
- (Current Period High Absolute Value) – (Close of Previous Period)
- (Current Period Low Absolute Value) – (Close of Previous Period)
- Then you plot an Exponential Moving Average to get the Average True Range.
- The Average True Range formula involves the initial calculation of the True Range on the chart, where you should take the highest value of these three formulas:
- Using ATR in trade management allows you to set better Stop Loss orders and targets:
- When ATR indicator is high, volatility is high:
- Set looser Stop Loss orders.
- Set bigger targets.
- When ATR indicator is low, volatility is low:
- Set tighter Stop Loss orders.
- Set smaller targets.
- When ATR indicator is high, volatility is high:
- You can find a built in ATR indicator in the MetaTrader4 platform: Insert>Indicators>Average True Range
- The default ATR value takes into consideration a 14 period EMA. To change the value of the MT4 ATR indicator you should:
- Right-click the indicator at the bottom of your chart.
- Choose “ATR(14) Properties…”
- Click on “”
- In the “Period” field replace the default “14” by the period you want to include.
- The default ATR value takes into consideration a 14 period EMA. To change the value of the MT4 ATR indicator you should:
- An ATR strategy could combine price action analysis and a Trailing Stop:
- Open trades based on price action events or patterns.
- Set a tight Trailing Stop if the ATR shows lower values. Set a loose Trailing Stop if the ATR shows higher values.
- If a chart pattern has a certain target:
- On lower ATR values hold the trade until the minimum pattern potential is acheived.
- On higher ATR values hold the trade for 2x the minimum pattern potential and consider scaling out half at 1X target and half at 2X target.
- If the pattern has no specific target rules:
- Hold the trade until the Trailing Stop is hit.
- Note that the Trailing Stop based on an ATR value could be adjusted periodically as needed based on market conditions.