Breakout trading is a time tested strategy that has been used by some of the largest traders and hedge funds in the industry. There are a multitude of ways that a retail trader can incorporate a breakout style into their trading plan.
One of the oldest and simplest technical indicators used to trade breakouts is the Donchian Channel. In this lesson, we will learn the nuts and bolts of the Donchian Channel indicator, and then construct some trading strategies around it.
Introduction to the Donchian Channel
The creator of the Donchian channel was a renown trader named Richard Donchian. During his trading career in the mid 1900’s, he was seeking ways to capture large price movements in the market and in fact, the Donchian channel technique is considered to be one of the earliest forms of trend following systems.
The Donchian indicator plots two primary lines which are based on the high and low price over a specified period of time. You can also add a middle line which is the average of the upper resistance line and the lower support line of the Donchian Channel. It is perhaps one of the simplest channel indicators to understand. Think of it as a simple N bar breakout.
Donchian analysis can be applied to any liquid market including forex, futures, and stocks. And it is versatile enough to trade across many different timeframes. The simplicity of this indicator contributes to its robustness across many different instruments and trading timeframes.
One of the earliest adopters of the Donchian technical trading concept were a famous group of traders called “The Turtles”. The Turtle trading strategy used two variations of the Donchian channel breakout- the 20 day breakout, and the 55 day breakout. Today, many traders that utilize the Donchian price channel tend to use the 20 period as the look back period.
You may be wondering if the Donchian channel is similar to the Bollinger band, since both tend to have a setting of 20 periods, and both are channel bands. Although they appear to be similar, they are quite different. Keep in mind that the Donchian channel indicator’s only variable input is the look back period. It does not take in a user input for volatility like the Bollinger Bands do.
That being said a trader can still gauge the volatility of a currency pair or financial instrument using the Donchian channel method. Generally, the wider the width of the Donchian channel, the more volatile the market, while the narrower the Donchian channel, the less volatile the market. Also, price action can pierce the Bollinger Bands, but you will not see that type of characteristic with the Donchian channel, as its bands are measuring the high and low of the specified period.
The Donchian channel is primarily a breakout type trend following indicator that provides two different types of breakout signals. We will be discussing this in more depth in the following sections.
Take a look at the image below which shows the Donchian channel plotted on a price chart.
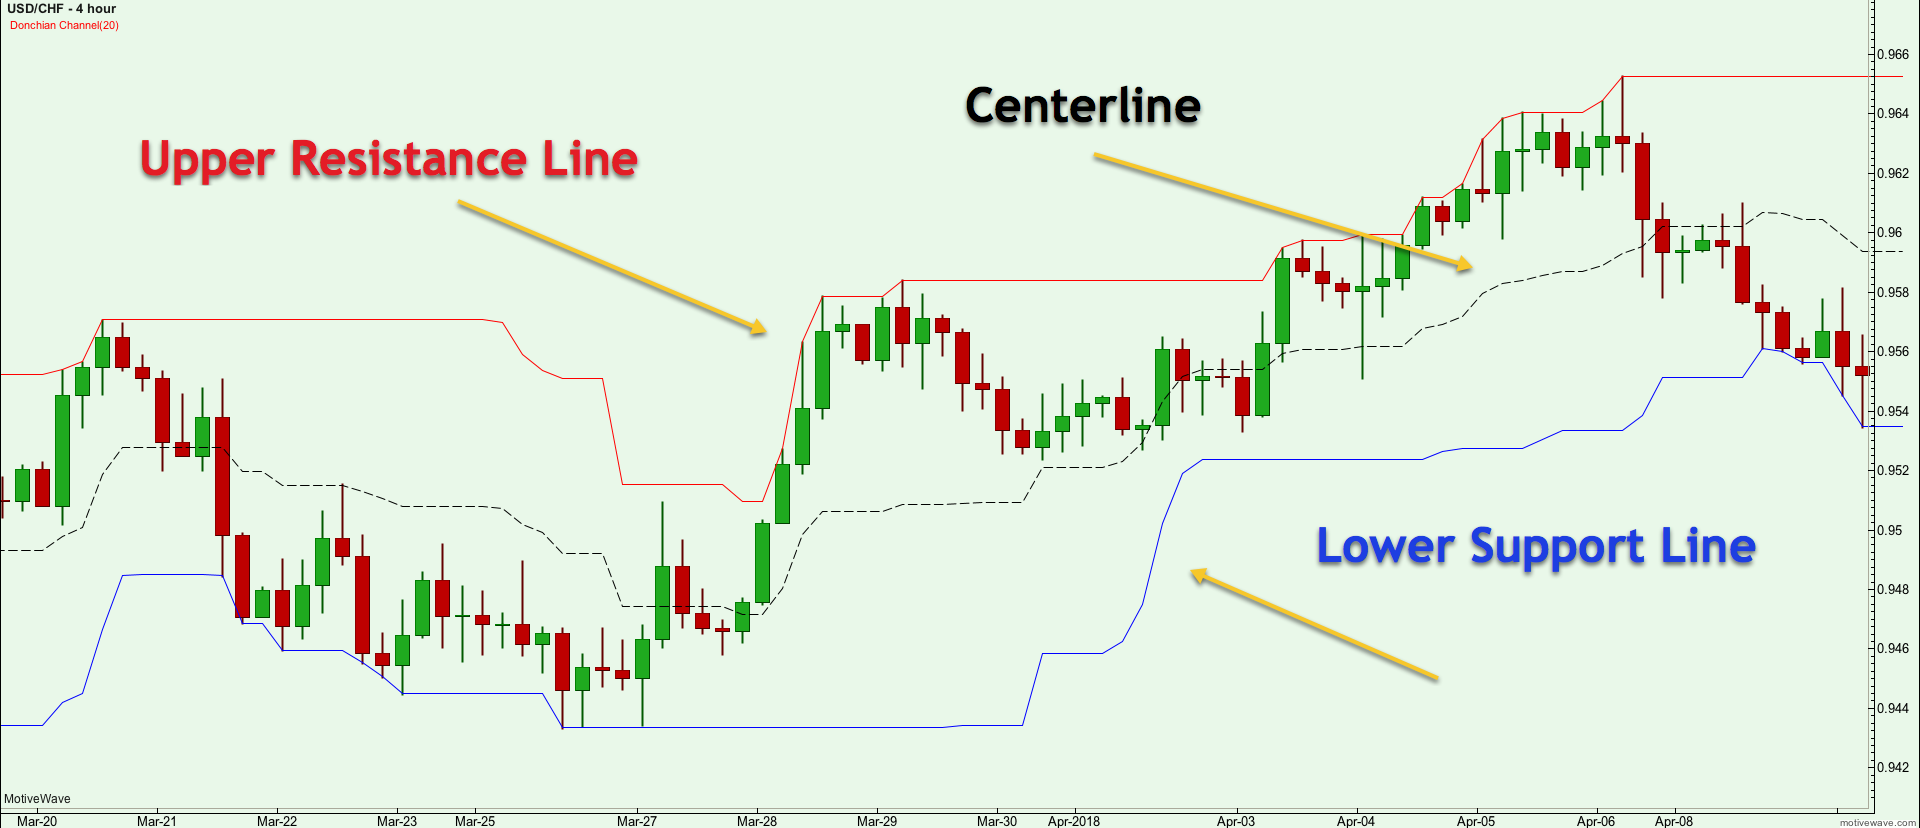
You will notice there are three lines that comprise the Donchian Channel – the Upper Resistance Line, the Lower Support Line and the Centerline.
How to Calculate Donchian Channels
As we have touched on earlier, the Donchian Channel only requires the look back period for the input. The indicator then takes the user defined look back period and calculates the upper resistance line and the lower support line. These two lines are then plotted on the price chart. As an option, a trader can add a third line, the centerline. The centerline is calculated and plotted as the average of the upper and lower band. Generally, the default value of the look back is 20 periods.
So, to summarize the Donchian Indictor calculation:
Upper Line of Donchian – Highest price for the last N bars.
Lower Line of Donchian – Lowest price for the last N bars.
Centerline – (N period High + N period Low) / 2
For example, let’s assume we are looking at the hourly chart of the EURUSD currency pair and were using a look back of 20 periods for our Donchian indicator setting. Say that the 20 hour high was 1.3210 and the 20 hour low was 1.3150. Based on this, the Donchian indicator would plot an upper resistance line at 1.3210 and a lower support line at 1.3150. The centerline would be drawn at 1.3180.
As you can see, the Donchian indicator is very straight forward and easy to comprehend. But as simple as it is, you should not underestimate its effectiveness in finding good trading opportunities in the market.
Donchian Channel Signals
The Donchian Channel is typically used as a breakout indicator. There are essentially two main types of breakout signals that the Donchian Band provides. One is the break of the Upper Resistance line or the Lower Support line. The second type of breakout signal that you can utilize is the Centerline cross. The Donchian channel strategy was primarily created to take advantage of potential trends, so when you enter the market using any of these two breakout signals, you can be sure that you will catch almost every emerging trend in the currency pair.
Donchian Band S/R Breakout Signal
Trend traders typically enter in the direction of a breakout expecting a strong follow through which would lead to a trending price move. Using the Donchian Band, a buy signal occurs when prices hit the upper band, and a sell signal occurs when prices hit the lower band.
You should keep in mind that the Donchian channel reprints on the chart and as such you need to keep a careful eye out so that you can act quickly when the price has breached a Donchian S/R level. If your charting software allows it, it would be best to set price alerts so that you do not miss the breakout opportunity.
Some traders prefer to enter every breakout, while other traders prefer only to trade breakouts that occur on high volume or high momentum. The reason for this is that there is a higher likelihood of price follow-through if the breakout occurs on high volume and/or with high momentum. Essentially, it would be confirming that there is some real strength behind the breakout that would help propel prices in the direction of the breakout. Filtering trades based on high volume or momentum will lead to less whipsawing and higher win rates, however, the downside is that you may miss some strong moves due to the additional filtering process.
You will have to decide which method is more suitable for your temperament. When trading the FX markets, where volume data is not readily available, you may want to use a momentum based filter such as RSI or MACD. When trading currencies in the futures market, where volume data is available, you can consider either filtering with Volume or Momentum. Let’s take a look at an example below that shows the Donchian Channel S/R breakout signal on the price chart.
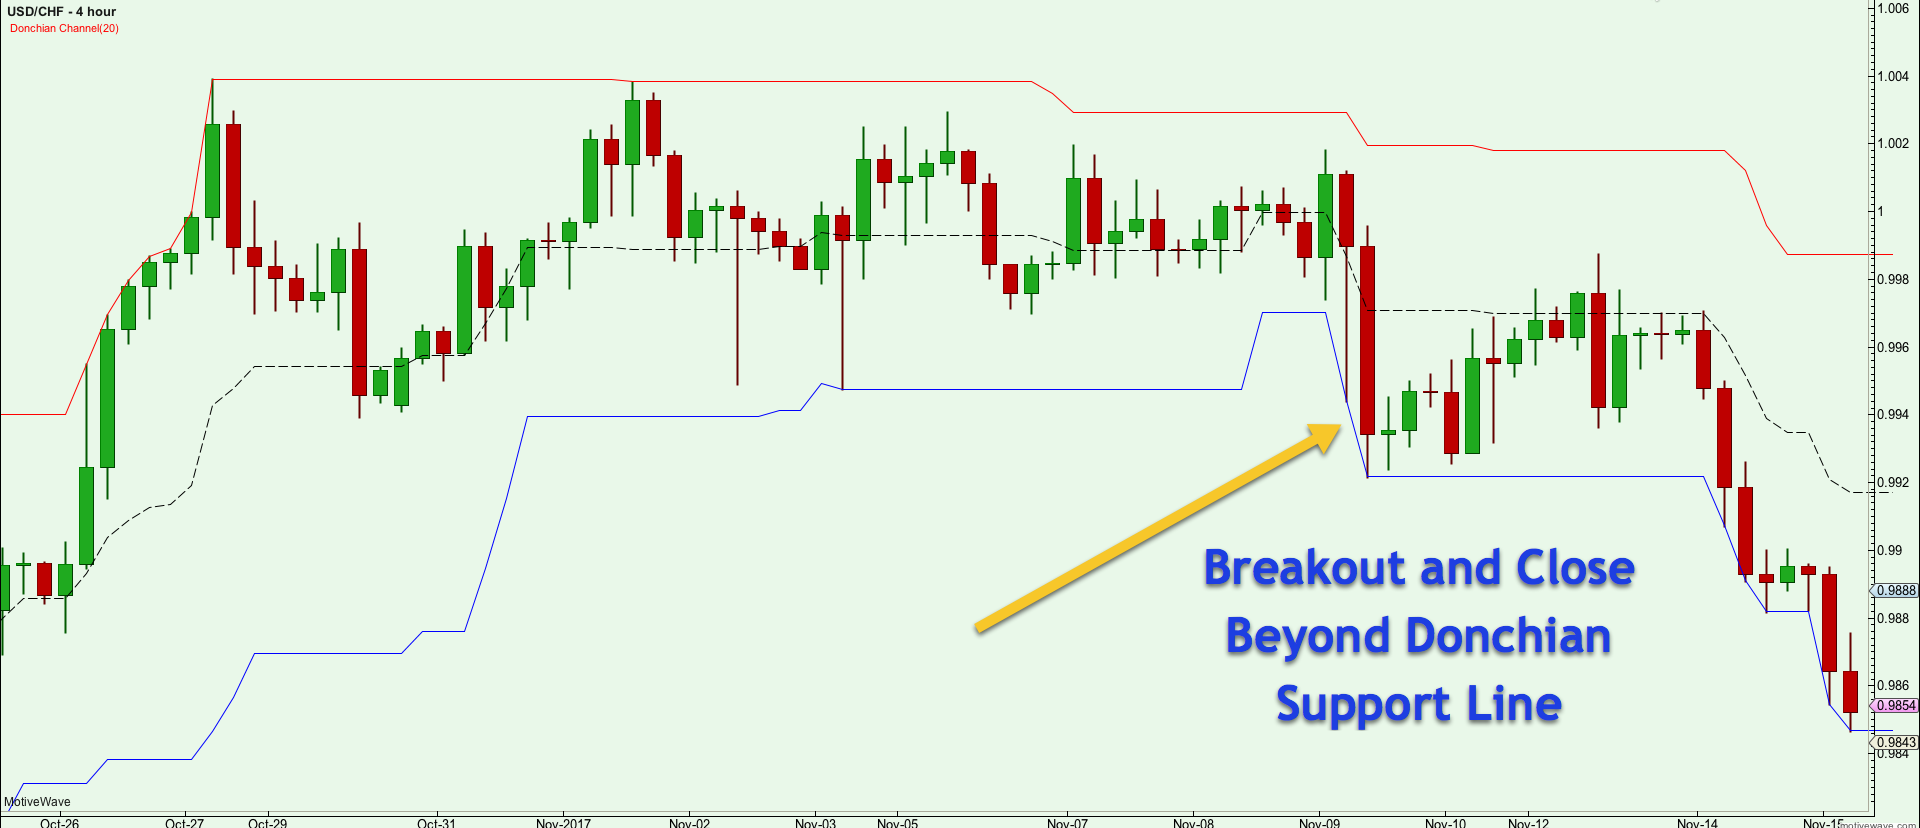
Notice on the chart that prices were trading in a range, and then there was a breakout bar that closed below the lower Donchian channel line. This would be considered a Donchian support line breakout.
Donchian Centerline Breakout Signal
As we have touched on earlier, the Donchian channel is comprised of two primary lines, the upper resistance line and the lower support line. The user has the option to add an additional third line. This is the centerline, and is the average of the upper and lower line.
The centerline has several useful applications. Firstly, it can be used as a breakout signal to enter a new position. When prices cross over the centerline to the upside, you could buy and when prices cross the centerline to the downside, then you could sell. Aggressive traders would enter at the centerline to initiate a new position rather than wait for the S/R line to be breached.
In addition to using the centerline to get into a new position, traders can also utilize the centerline as a means of adding to positions. Usually this type of scenario plays out after a minor retracement within a trend is followed by a resumption of price in the direction of the prevailing trend. This allows a trader to add positions as price is moving in the intended direction.
Another useful way to incorporate the Donchian centerline is use it as an exit strategy. So, if you are in a long trade, you would wait for prices to cross below the Donchian centerline and then you would exit the trade and vice versa for a short position. This method will allow you to capture a large portion of a trend move while keeping your open profit protected against a significant adverse price move.
It is an excellent way to protect your profits and keeps the trader disciplined in their trade management. It will help you to stay with the trend and avoid getting out too early. At the same time, it will help you to lock in profits when you are feeling overconfident in your winning position.
Let’s take a look at the Donchian Centerline Breakout:
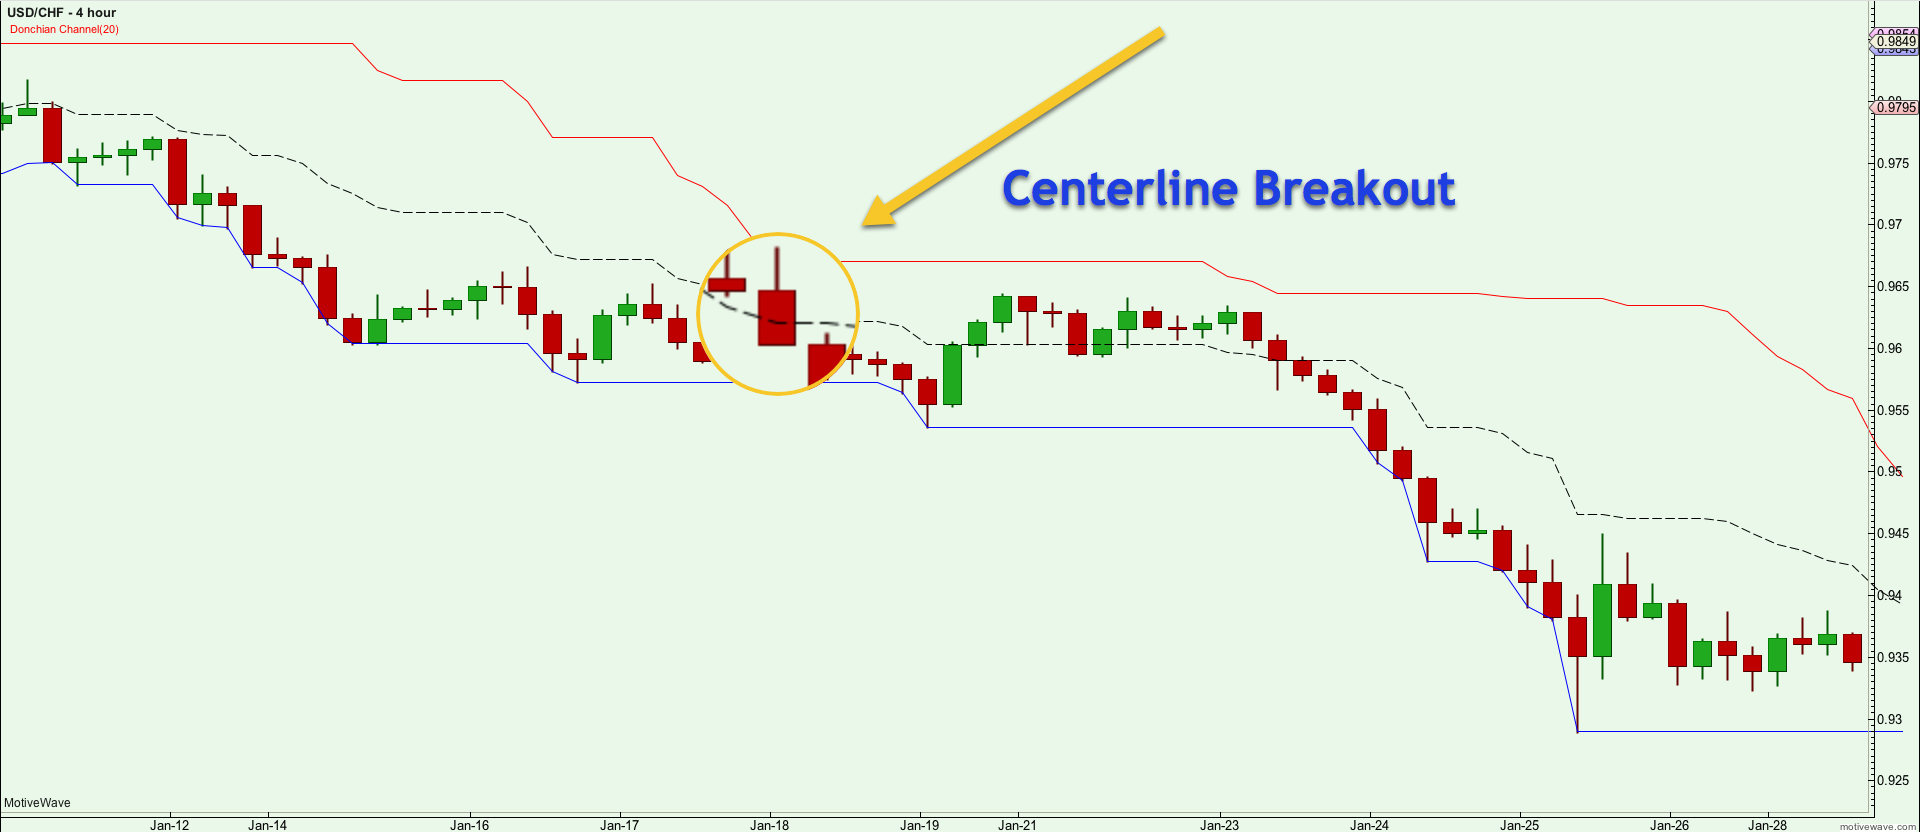
The price action has been trending downward and then retraced to the upside, crossing the Donchian centerline. Then price quickly fell and closed below the centerline. The breakout bar has been magnified on the chart. This is considered a Donchian Centerline Breakout signal.
Donchian Channel Trading Strategies
By now you should have a good understanding of Donchian bands, and it relevance to trend trading. Now we will dig a little deeper and construct a few trading strategies using the Donchian channel in forex. These strategies should provide some insights on how to best trade with the Donchian indicator, and should inspire you to come up with some unique ideas of your own that you can run a backtest for and validate.
Donchian Centerline with 200 Period SMA
The first strategy that we will describe combines the Donchian centerline with the 200 Period SMA ( Simple Moving Average). The idea behind this trading system is to try to capture moves in the direction of the longer term trend. The 200 SMA is used to indicate the longer term directional bias on the trade.
So, if price is currently below the 200 period SMA, we will only be looking to take short trades. And similarly, if price is currently above the 200 period SMA, we will only be looking to take long trades. This will help keep us on the right side of the market for the most part.
Our trade entry signal will be based on the Donchian centerline. Assuming that the 200 Period SMA filter has been met, a long trade will be initiated when price crosses and closes above the 20 Period Donchian Centerline.
And on the flip side, assuming that the 200 period SMA filter has been met, a short trade will be initiated when price crosses and closes below the 20 Period Donchian Centerline. This is a simple, yet robust entry technique.
Now for the stop loss placement, we will place a stop at the most recent swing just before the Donchian centerline cross. And for the take profit target, we will close and exit the trade when prices cross over the Donchian centerline in the opposite direction.
Let’s now turn our attention to the currency price chart below which illustrates this strategy in more detail:
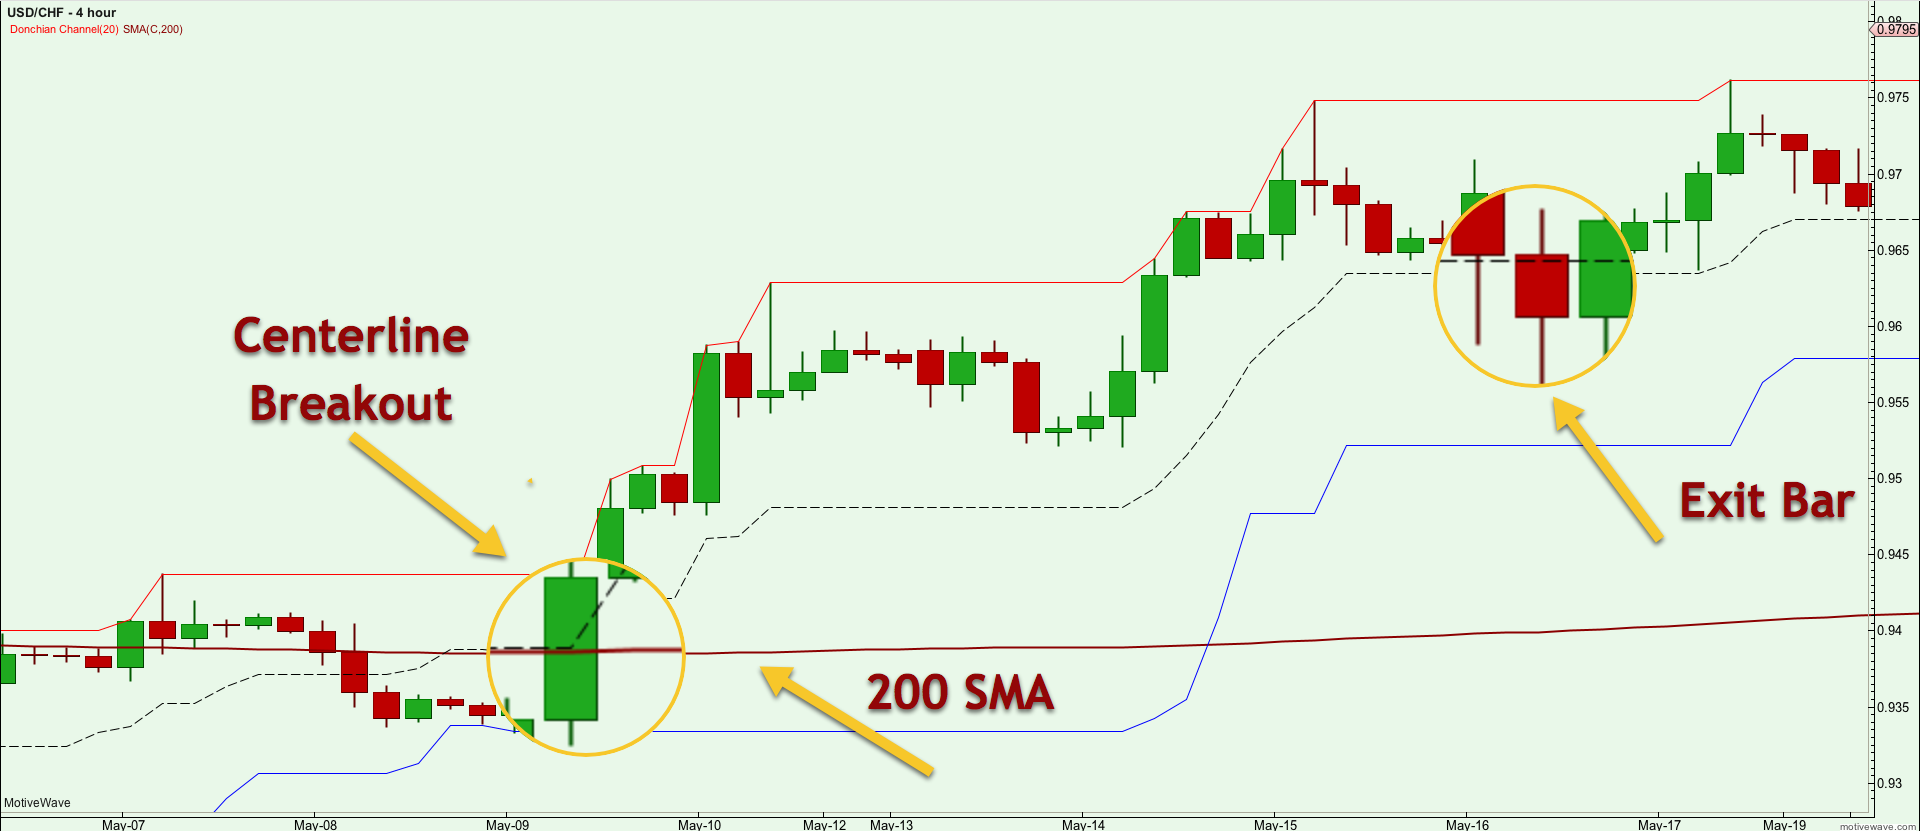
Above is the 4 hour chart of the USDCHF currency pair. Prices were trading in a tight consolidation range around the 200 Period SMA. Then there was a strong upside bar that broke through the Centerline. The same bar also closed above the 200 SMA. This breakout bar has been noted and magnified on the chart. So, the signal to enter would occur at the close of this bar. Our stop would be placed just below this bar.
From there prices quickly moved higher. Six bars after the entry signal, a shooting star pattern appeared on the chart. which would have warned us that an impending price decline was possible. Afterwards, prices started to consolidate a bit but then moved higher breaking above the shooting star formation. Shortly thereafter, a second shooting star pattern appeared, which would again be a warning that a retracement or reversal was likely imminent. Price started to fall after this second shooting star pattern was seen. Eventually price crossed the Donchian centerline and closed below it. You can see the Exit Bar has been noted and magnified on the chart. This would have served as our exit signal on the trade.
Donchian Bollinger Band Squeeze
This next setup that we will discuss is one that I really like and refer to often in low volatility environments. It is called the Donchian Bollinger Band Squeeze strategy. This setup combines the Donchian Channel and the Bollinger Bands. It is a great combination to find low volatility markets where prices are likely to breakout soon. The logic behind this Donchian trading system lyes in the premise that markets are cyclical by nature. There will be periods of low volatility followed by high volatility and back again. This is how the market breathes and is the natural ebb and flow of most currency pairs and other financial instruments.
The setup occurs when both the Upper and Lower Bollinger band lines are contained within the Donchian Channel. The setting used for the Donchian bands is the default 20 period look back. And for the Bollinger Bands, we will also use the default setting of 20 periods, however for that standard deviation, we will use 2.5 rather that 2. This tends to work better in locating lower volatility conditions that are poised to make a move.
The entry signal will be based on the Donchian Upper and Lower lines. So, the trading system will look to enter long when the Bollinger bands have been recently contained within the Donchian Channel and price breaks and closes above the upper resistance of the Donchian band. And conversely, the trading system will look to enter short when the Bollinger bands have been recently contained within the Donchian Channel and price breaks and closes below the lower support of the Donchian band. It is important to keep in mind that the Bollinger bands do not necessarily need to be within the Donchian channel at the time of the breakout.
For the stop loss placement, we will put in the stop at the most recent swing just before the breakout. And for the take profit target, we will close and exit the trade based on a 1.5 : 1 RVR (reward to risk ratio).
You can refer to the trading example below which details the Donchian Bollinger Band Squeeze setup:
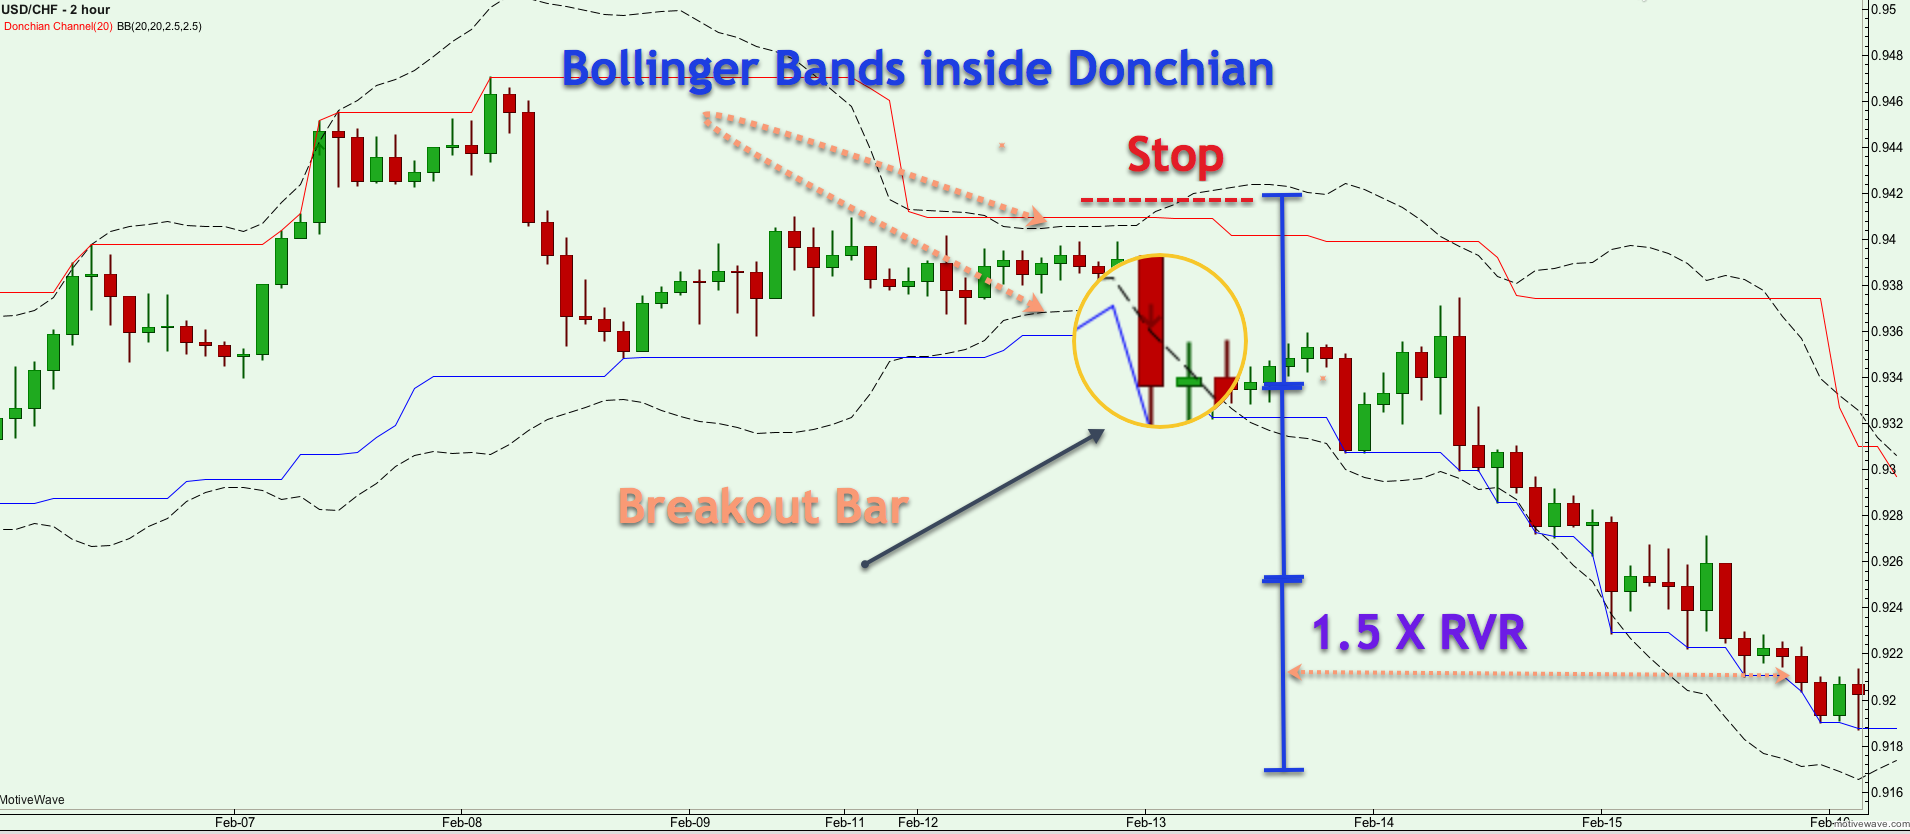
In the above chart, we have the price action for the USDCHF pair using the 240 minute timeframe. Starting with the left side of the chart, we can see that prices were heading higher and made three minor tops prior to a swift price drop. After the price decline, prices began to consolidate and trade in a tight narrow range for several days. Towards the latter part of this low volatility market condition, the Bollinger Bands entered inside the Donchian channel.
This scenario confirms the trade setup, and we would be preparing for a breakout of either the lower Donchian support line or the upper Donchian resistance line. In this case, prices broke to the downside with a high momentum bar that closed beyond the Donchian Support line. The breakout bar that serves as the entry signal has been noted on the chart.
The stop loss would be place above the recent swing level and the upper wicks within the consolidation range. After the entry, prices traded sideways for a few days before moving sharply lower and hitting our take profit target. The take profit target, which is based on the 1:5 : 1 Reward to Risk ratio has been marked on the chart.
Conclusion
As we have learned in this article, Donchian channels are a simple yet effective tool for trading breakouts. The general principles behind the indicator have been an inspiration to many traders around the world, particularly to trend following system traders. In fact, many of the greatest traders in the world including the famous “Turtles” used a variation of the Donchian channel to build their trend following system models.
The true power of the Donchian indicator is realized when you are able to combine it with other technical studies such as Moving Averages, Momentum, or Bollinger Bands to create a robust trading methodology. Now it’s your turn to take what you have learned and start applying it in the markets or even better to start building upon these concepts to improve on the ideas presented so that you can carve out your own variation of a Donchian channel trading system.