When it comes to technical trading setups there are many different formations which traders monitor the markets for. Some of these can be short term situations which unfold on the lower timeframes and offer scalping opportunities. Others can be broader technical events which take place on the higher timeframes and offer swing trading opportunities.
However, some of the most popular and effective technical setups to trade are those that take place across all time-frames and are driven by the same order flow reasons. Of these, one of the most popular setups is the short squeeze.
What is A Short Squeeze?
Now, if you are already fairly familiar with technical trading, you will likely know what the term ‘short squeeze’ means. If not, let’s just make sure we are all on the same page and define short squeeze for you.
The definition of a short squeeze is essentially a rally (an increase in price) which takes place on the back of a decline, where short positions are basically “squeezed” out – hence the name. Short squeezes reflect an unwinding of short positions in the market and can occur on a varying scale from sharp sudden increases in price, to more subtle and sustained rallies as positions are unwound.
What Causes Them?
The reasons behind a short selling squeeze can vary from traders taking profit on positions as targets are hit, covering positions ahead of a major news release or in response to a news release, closing positions out ahead of a weekend, month end or a holiday period. Short squeeze can also occur as a result of a sharp shift in sentiment, perhaps in response to a geopolitical event or comments made by a central bank governor or policy maker.
The reasons behind a short squeeze are varied, but the outcome is always the same. Price breaking higher on the back of a decline. Some short squeezes may simply be blips within a trend, a short term correction higher before the trend resumes, whereas others might lead to a broader reversal in the trend.
Ways To Identify & Trade Short Squeezes
Now, when it comes to trading short squeezes, the opportunities are quite diverse and very exciting. If we think about the nature of what is taking place as a short squeeze happens we can see the opportunities ahead of us. Net-selling positions are being closed out quickly, as the market shifts from selling into buying, price starts jumping higher as demand increases.
The most interesting thing about a short squeeze is when the closing out of selling positions is also accompanied by a spike in speculative buying. This can lead to very large increases in momentum and quick gains in price.
So, now that we know what a short squeeze is, it’s time to think about how we trade a short squeeze. Perhaps the most integral part of this is being able to identify a short squeeze in action. When it comes to identifying and trading a short squeeze, there are a few key options available to us, so let’s take a look at these and explain the best short squeeze trading methods.
Trend Lines and Resistance Levels
So, one of the most effective, and thankfully very straightforward, ways of trading short squeezes is by using foundational knowledge of market structure and employing the use of trend lines and resistance levels. So, put simply, when the market is in a bearish trend, we can use a bearish trend line to act as a marker for the trend. While price is below the trend line, the bear trend is healthy. If price breaks above the trend line, this signals a potential trend shift. However, price action around a trend line can be volatile and so taking a trade just because a trend line has been broken can be too aggressive.
However, if we employ a break of resistance as well, this boosts our chances of success. Within a bearish trend, we know that the classic structure is a series of lower lows and lower highs, the market is moving in a staircase fashion lower. If price fails to make a fresh low and then breaks above a previous high, this is a good signal that a trend break may be underway. When coupled with a trend line break, this can be a particularly powerful signal that a short squeeze is underway.
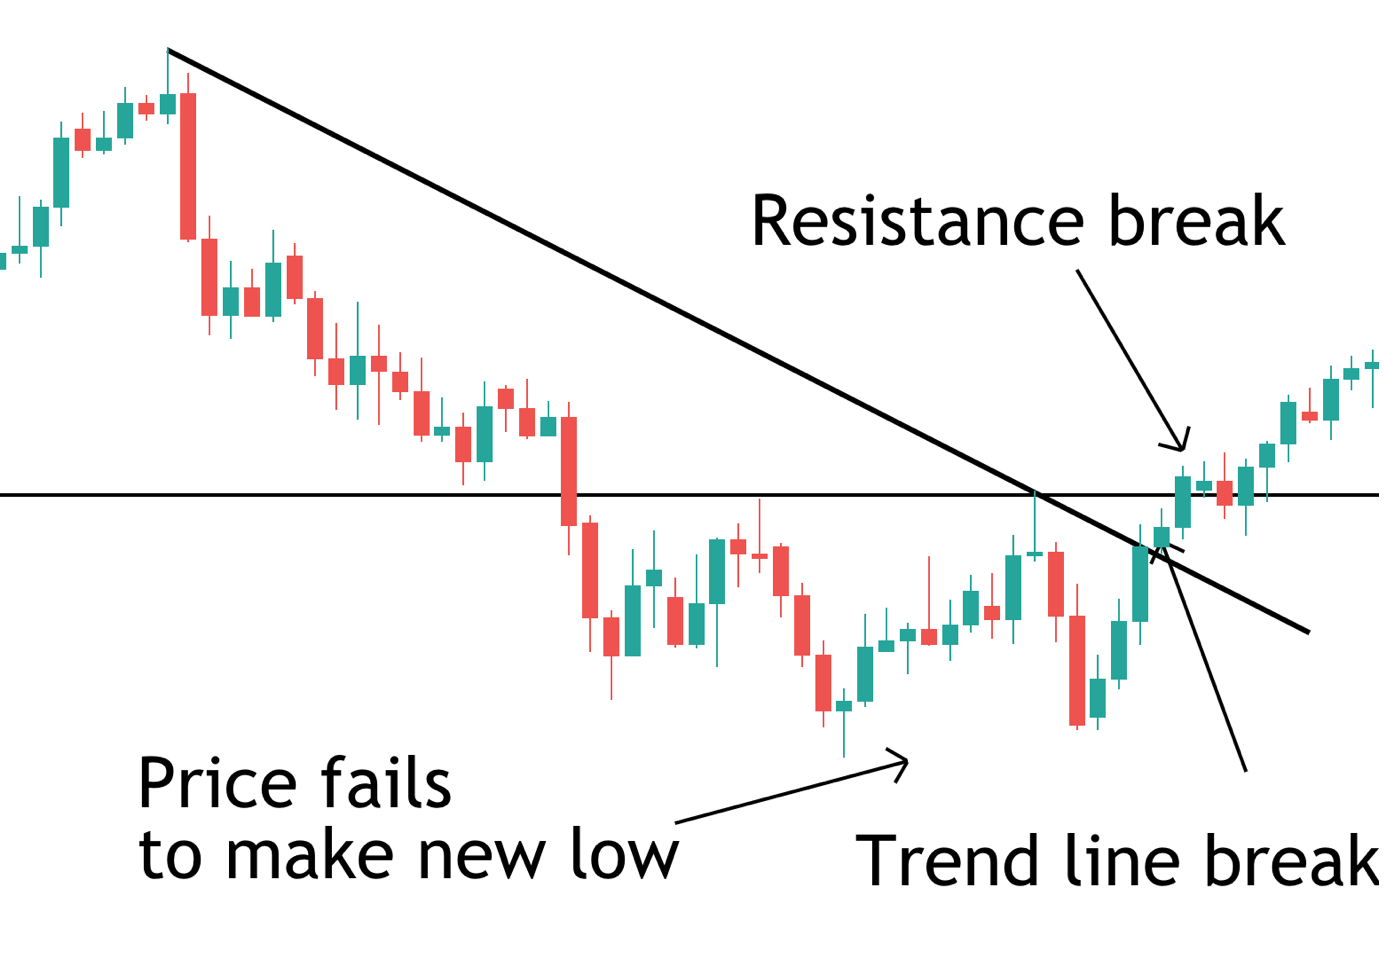
In the image above we can see a great short squeeze example that teaches us how we can use a trend line as resistance levels to trade a short squeeze. So, let’s walk through what’s happening in this example. We can see that initially we have price moving in a bearish trend, breaking new lows and moving lower under the bearish trend line. However, at the noted point we can see that the market fails to make a new low, giving us a first signal that a shift is occurring.
Price then breaks above the bearish trend line, giving us our first short-squeeze signal. Following this, price then breaks above the resistance level, confirming the short squeeze and giving us our buying entry. From this point we can see that price continues to surge higher as the short squeeze continues to develop.
In terms of how we would trade this setup, we treat it the same way we would a bullish break out trade. Long positions can be entered on the candle close above the resistance level and a stop loss can be placed below the swing low which formed before the short squeeze started. We then look to target a minimum of twice our risk, to ensure a positive risk reward.
The great thing about this trading method is that using the combination of trend lines and resistance breaks means that we essentially have a two-tiered system for taking a trade. If price breaks the trend line but not the resistance level, we don’t take the trade. This helps us to avoid getting caught up in potentially failed trades that happen during choppy conditions. And this will help improve our chances of success.
Price Action Reading
Another great technique for spotting and trading short squeezes is using basic price action reading, and by this we mean looking at candlestick analysis. If we think about the nature of what is happening during a short squeeze, the change of order flow, then we understand that candlesticks can be a great indicator that a short squeeze is underway.
One of the most common candlesticks that indicates a short squeeze is underway is the bullish engulfing candle. A bullish engulfing candle is a candle which forms after a bearish candle and completely engulfs the prior candle. This second candle ( in its most effective form) is typically far bigger than the preceding candle and demonstrates a sharp shift in sentiment.
When we see the occurrence of a bullish engulfing candle within a downtrend, this can be a great signal that a short squeeze is underway and offers us the opportunity to take advantage of a bigger reversal in the wake of the candle.
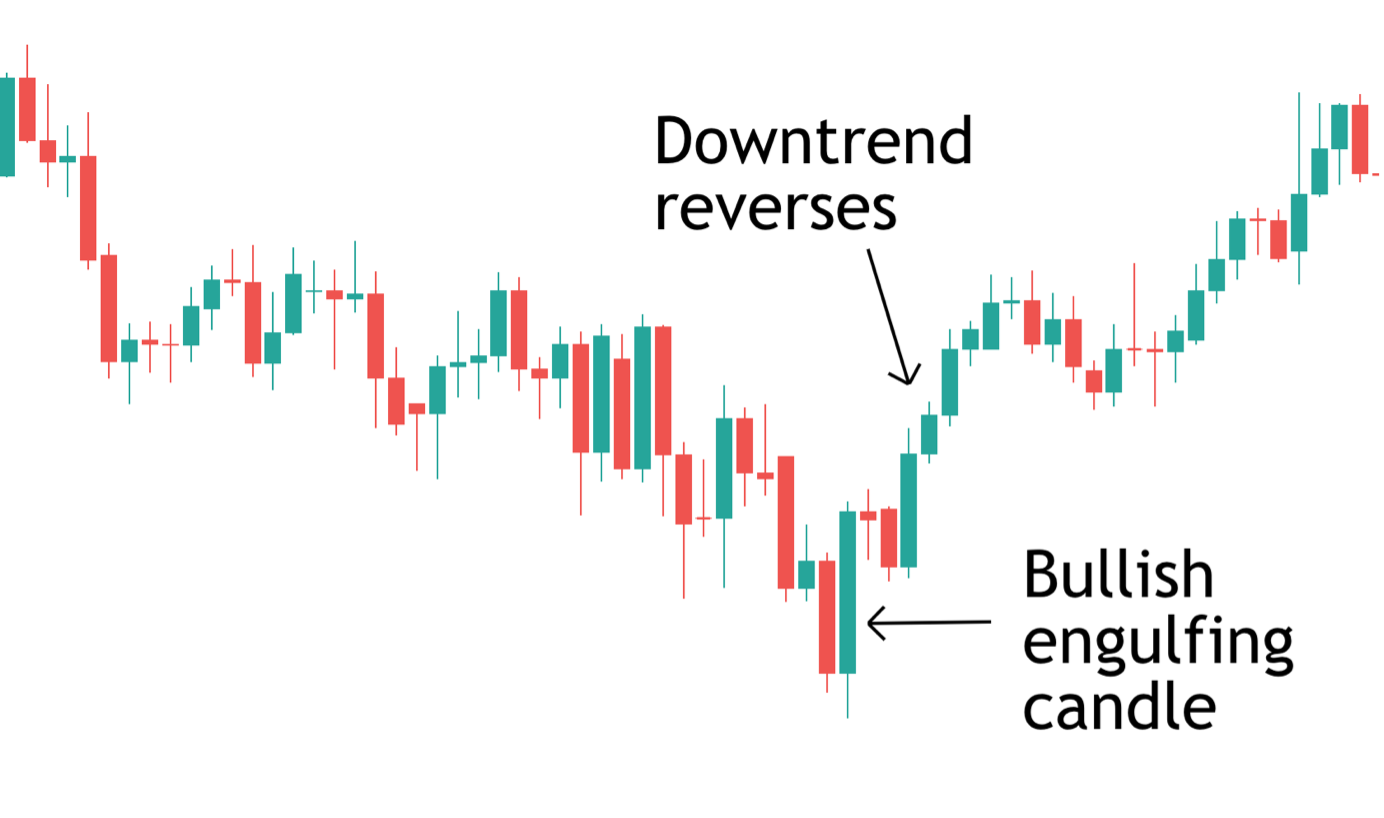
In the image above we can see a great example of this situation in play. So, price is moving lower within a bearish trend but as price breaks through the last low in the downtrend, to create fresh lows, buyers step in and price reverses sharply as the short squeeze kicks in. The presence of the bullish engulfing candle, which is much larger than the prior bearish candle, alerts us to the potential short squeeze.
So, when trading this setup the best course of action is to enter the trade as price breaks out above the high of the bullish engulfing candle with a stop below the low of the engulfing candle. We then want to target a minimum of twice our risk.
Now, the great thing about trading this setup is that it can be a very early entry into a bigger move. The shift in sentiment which occurs over the course of the engulfing candle is often the very beginning of the short squeeze and so entering at this point can be a very profitable move. However, it is also fairly aggressive as price is still very much within the bearish trend at this point.
Another option is to enter half a position on the break higher from the bullish engulfing candle and then enter the remainder of the position when price breaks above the trend line.
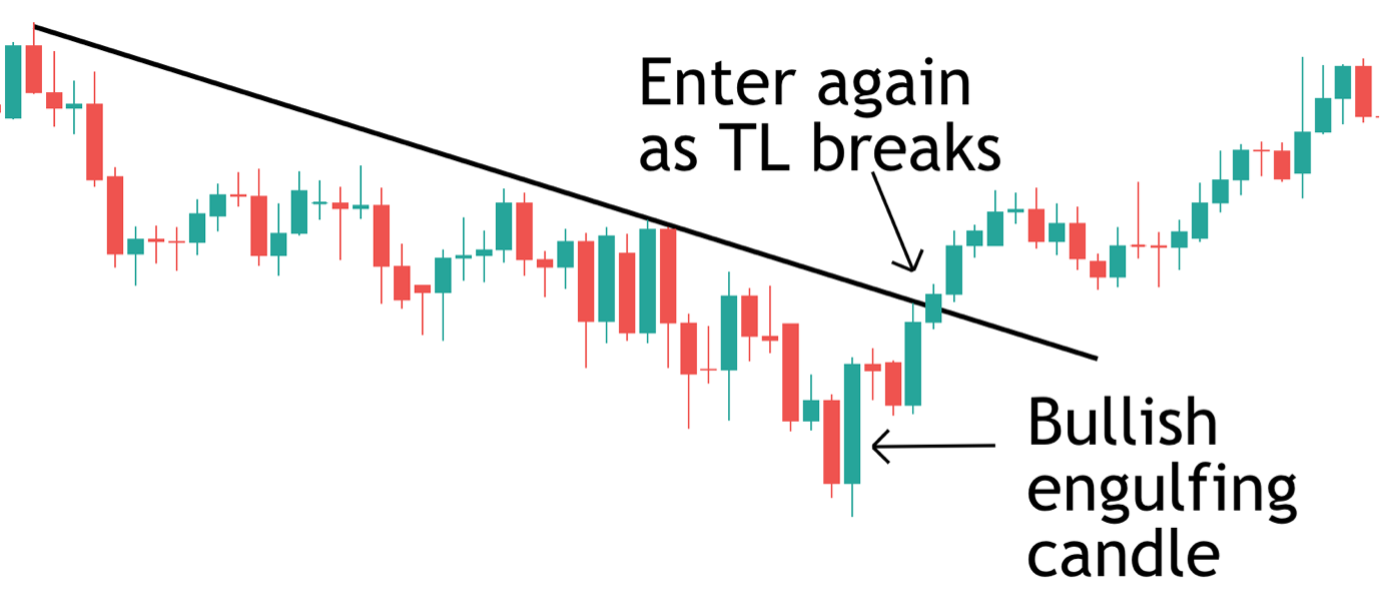
So, if we look at our example again, we can see the two potential trade locations. The first is as price breaks higher above the bullish engulfing candle and the second is as price breaks above the bearish trend line from highs.
Technical Indicators
Now, so far we have only looked at trading a short squeeze based on analysing raw price action alone and using technical elements such as trend line and resistance. However, another really effective way of identifying a short squeeze underway and taking a reversal trade, is to use technical indicators.
There are many great technical indicators which can be used to trade short squeezes. I have found one good option is to utilize momentum indicators and or trend direction indicators. Momentum indicators such as the RSI or Stochastics are great at alerting us to the slowing (or weakening of a trend) which is typically the conditions in which short squeezes develop.
Momentum indicators do this through the presence of bullish divergence. If you aren’t familiar with bullish divergence, let’s take a moment to clarify. Bullish divergence simply refers to a situation where the downward price move is not being supported by the momentum indicator. So, if we take the RSI indicator for example, then during a strong bearish trend we would expect to see the indicator making new lows, confirming bearish momentum.
Now, if price is moving lower but the indicator is failing to make new lows and also starting to make higher lows, this is bullish divergence and alerts us to a potential shift in trend. From these conditions, short squeezes can occur as selling pressure has dried up and once buying kicks in, the moves can be quite explosive to the upside.
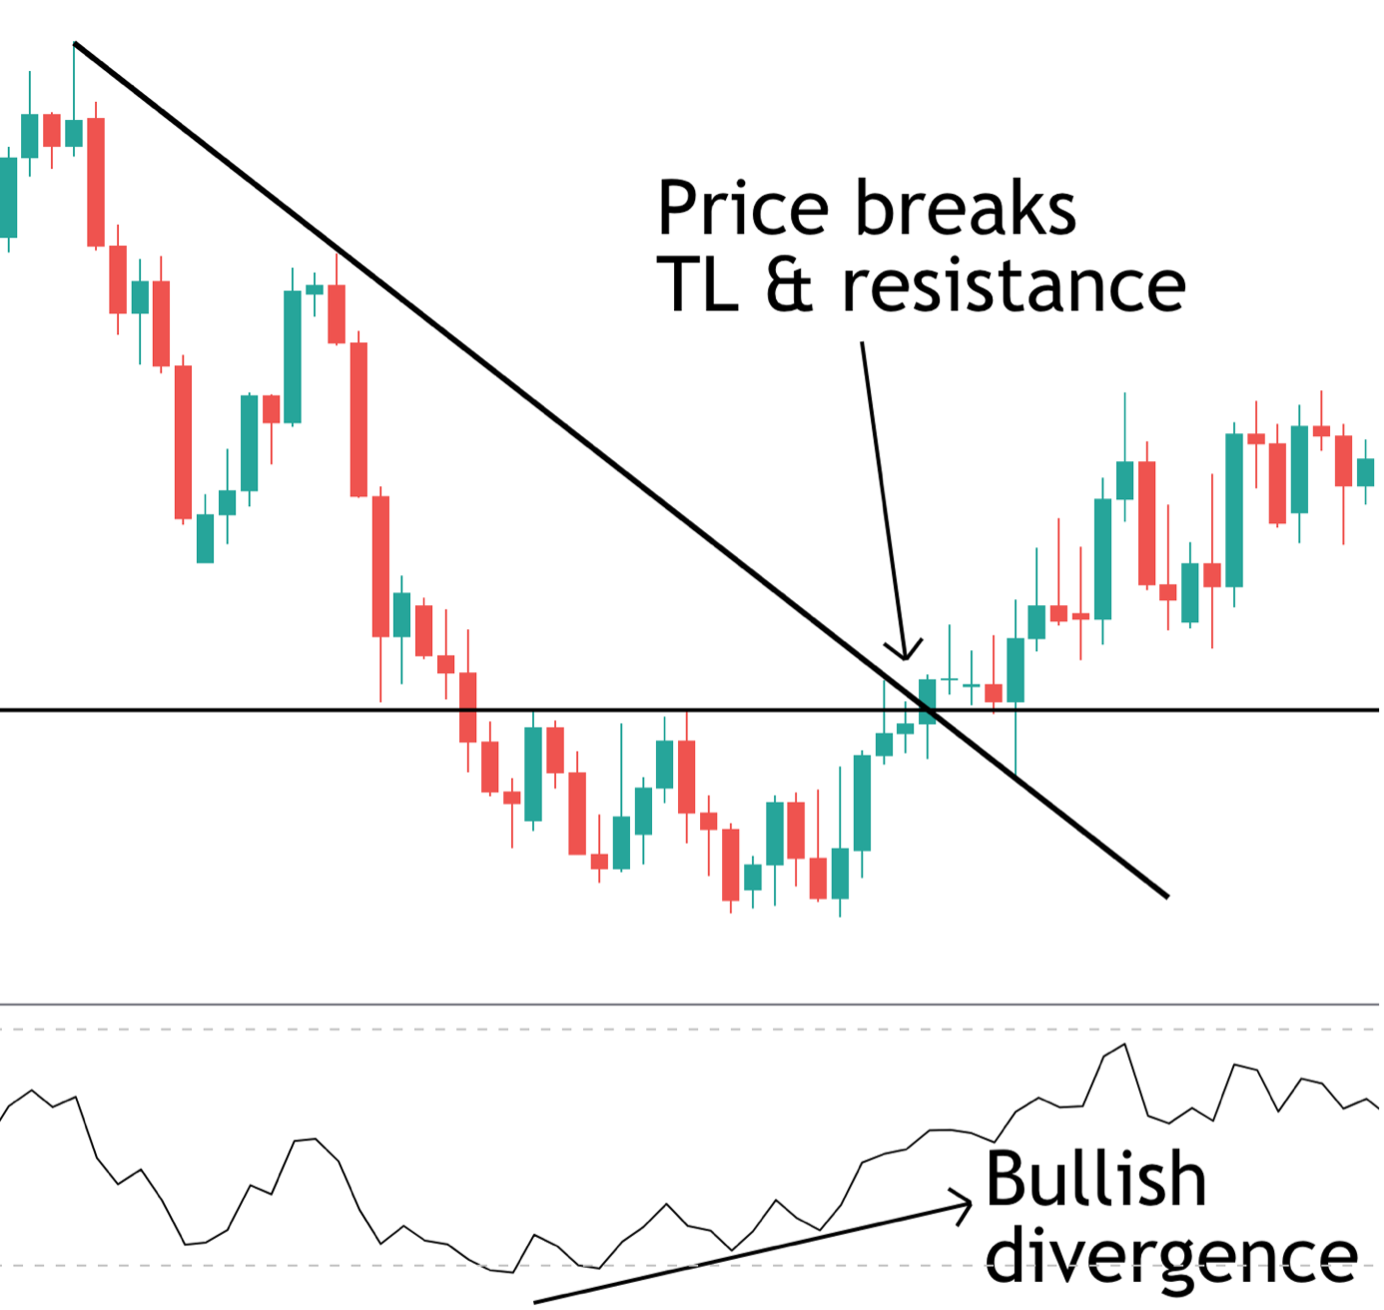
So, in the image above we can see a great example of how the RSI indicator can help us prepare for and trade a short squeeze. As you can see, initially price is in a bearish trend, framed nicely by the bearish trend line. Initially, as price is moving lower, the indicator is also moving lower, confirming bearish momentum in the market.
However, you can see that as the bear trend starts to slow a little (shallower drives lower and choppier price action), the indicator starts to flag up a bullish divergence with the RSI starting to make higher lows. This alerts us to a potential short squeeze in the near future. From that point you can see that price does indeed enter a short squeeze with the market accelerating higher and breaking above the last resistance in the downtrend and above the bearish trend line offering us our long entry.
As you can see, in this example we have essentially combined our earlier technique of using a break of trend lines and resistance to highlight our short squeeze and using technical indicators. Establishing technical confluence in this manner is a great way to trade and can significantly improve our chances of success with taking the trade.
Now, along with using the indicator to forewarn us about a forthcoming short squeeze, or potential short squeeze, we can also use the indicator itself to place a trade based on a short squeeze. As with price action, we are able to analyse and track the movements of the indicator itself. So, with the RSI indicator we are able to use trend lines and resistance on the actual indicator panel in order to measure the indicator and identify short squeezes.

So, looking at the image above once again but this time with some added analysis, we can see that the RSI indicator was trading lower in line with the bearish trend. We are able to draw in a bearish trend line on the indicator, highlighting this trend. However, the indicator then starts to base out and creep higher (higher lows), giving us our bearish divergence.
We can then see that the indicator breaks above the bearish trend line, giving us our first indication that a short squeeze is underway. From this point, we can see that price starts to accelerate sharply higher, confirming the short squeeze.
Now, the interesting thing here is that you can see the trend line break on the RSI indicator happens much earlier than the trend line break on the price chart. This therefore gives us a much better entry price. Trading the indicator in this manner is quite an advanced technique and can help you identify much better trade entry points.
Things to consider when trading short squeezes
The beauty of trading short squeezes is that, via the methods shown above, you can see that they are fairly easy to spot. They also occur equally on all timeframes, so no matter which timeframe you prefer to trade on, you can use the methods discussed above to trade a short squeeze.
Short squeezes, by definition, also occur in all assets so you can trade a short squeeze in stocks the same as you can in Forex or any other asset class.
When trading short squeezes, it is best to have an idea in mind of what your motive is with trading the short squeeze. If you are anticipating that the short squeeze will likely only be a short term correction before the trend resumes, it is best to trade for fixed targets. However, if you anticipate that the short squeeze reflects a broader shift in sentiment and a bigger reversal is likely then you can look to manage your trade in a different manner, allowing you to capture a bigger move.
Typically, short squeezes that occur in relation to news events tend to be shorter lived and more generally a short-term correction. You also need to build an idea of the different factors that can impact different assets. For example, a stock market squeeze can be driven by a company’s earnings release. If a stock is trading lower but earnings are better than expected this can cause a stock squeeze higher. In oil for example, a big short squeeze can occur in response to the weekly EIA inventories report or comments from OPEC, so it is important to keep an eye on the news wires for this.
However, if a short squeeze occurs seemingly out of no easy to determine driver, this typically reflects a positioning-driven short squeeze trade that can lead to longer term gains. As always, when trading short squeeze set ups it is important to manage your risk, use a stop loss and have an idea of where to exit the market, focusing on positive risk reward.