If you’re an active stock trader, you can use insights from the options market to feel the pulse of general investor sentiment. The put-call ratio allows exactly that – the ability to measure the market sentiment by using the relative volume of put options versus call options. Here is a detailed overview of how to use the put-call ratio to make better and more informed trading decisions.
Options: The Foundation of the Put-Call Ratio
To truly understand the put-call ratio, one must first have a sound understanding of the financial derivatives that are used to calculate the ratio. Options are financial instruments that derive their value from the price of an underlying instrument, which can be anything from stocks to currencies.
Unlike in the futures market, holders of options contracts are not required to buy or sell the underlying security of the option. For the opportunity to exercise the options only if they are in profit (in-the-money), option owners pay a small cost called the option premium.
Options contracts have expiration dates by which the holder of the option must exercise the option. The price at which an option can be exercised is known as the strike price. If the current market price is above the strike price, a call option (an option that gives the holder the right to buy the underlying security at the strike price) would be considered in-the-money.
Similarly, if the current price is below the strike price, a put option (an option that gives the holder the right to sell the underlying security at the strike price) would be considered in-the-money.
Options contracts usually represent 100 shares of a company. This means, if the option premium is 40 cents per contract, the buyer of the option would have to pay a premium of $40 for one option for the rights granted by the contract. The option premium depends on a number of factors, such as the current market price of the underlying instrument, the strike price of the option, and the expiration date of the option.
Since the put-call ratio is based on put and call options, it’s mandatory to understand the options market first before diving deeper into the put-call ratio. In the following lines, we’ll introduce the put-call ratio and show you how to trade it effectively.
Put-Call Ratio Explained
The put-call ratio is a ratio of the total number of traded put options to call options during a trading day and is often used to measure investor sentiment in the markets.
Investors buy put options in the market either to hedge against falling prices or to make a speculative profit when prices fall. A put option gives the owner the right, but not the obligation to exercise the option and sell the underlying security at a pre-determined price.
A call option, on the other hand, is used to hedge against rising prices or to speculate on rising prices in the future. A call option gives the owner the right, but not the obligation to exercise the option and buy a specified amount of an underlying security at a pre-determined price.
Options can be exercised at or before expiry, depending on whether the option is American or European style.
Since a large trading volume in put options can signal that the majority of investors are betting on falling prices, while a large trading volume in call options often signals the opposite (betting on rising prices), the put-call ratio can be an effective indicator to measure the overall market sentiment using the options market.
Traders often use the put-call ratio as an indicator of performance for individual stocks, but the ratio can also be used to gauge the broader market sentiment by applying the ratio to S&P 500 options, for example.
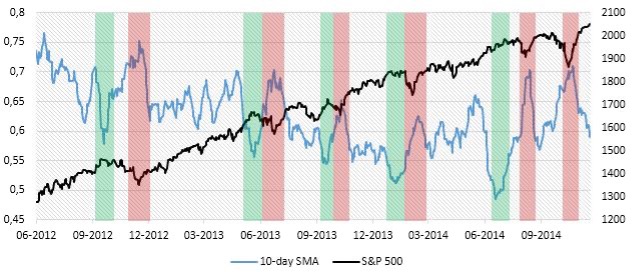
Chart Source: www.bsic.it
In the chart above, the S&P 500 is overlapped with the 10-day SMA of the put-call ratio. Take a look at how the S&P 500 behaved when the ratio reached extreme high or low levels.
How to Calculate the Put-Call Ratio
Calculating the put-call ratio for any stock or financial instrument is quite easy. Simply take the security’s put volume over a period of time (typically a day or week) and divide it by the call volume.
The put call ratio formula goes as follows: P/C Ratio = Put Options Trading Volume / Call Options Trading Volume.
When puts are more popular than calls (i.e., investors prepare for a potential fall in price), the put-call ratio will be above 1. And when calls are more popular than puts (i.e., investors prepare for a potential rise in price), the ratio will be below 1.
Another popular way to calculate the put-call ratio is to use the open interest of a specific day. The ratio is then calculated by dividing the open interest of put contracts by the open interest of call contracts on the same day. Open interest in the options market measures how many new put and call options have been created in the market.
When the open interest of put options in AAPL (Apple Inc.) is rising, this is a signal that demand for put options is increasing (which leads to the creation of new puts) and that markets are preparing for a potential sell-off in the AAPL stock.
How to Interpret the Put-Call Ratio
There are usually two ways to interpret the put-call ratio: To trade in the direction of the ratio or to take a contrarian position.
The typical way a trader would use the put-call ratio to make trading decisions in the stock market is to sell when the ratio is high, and to buy when the ratio is low.
A high put call ratio indicates that investors are expecting lower prices in the future and prefer put options over calls. This can also mean that some investors hedge against lower prices (because they have a long position in the market, for example), which is also a bearish signal for the underlying security.
Similarly, a lower ratio signals that calls are more popular than puts among options traders. Those market participants are expecting higher prices in the underlying security, which is why they are buying call options, pushing the put-call ratio below 1.
When the put-call ratio is between 0.5 and 1, some traders interpret this as a neutral signal and a sideways-moving market.
Another approach to interpreting the put-call ratio is by taking a contrarian view. This means contrarian traders would buy when the ratio jumps above 1 and sell when the ratio drops below 1.
The interpretation of a contrarian approach is that when markets are out of balance, they tend to revert to their mean, and the majority of investors are often taking the wrong side in the markets.
In other words, when the majority of traders are bearish on a stock or financial security and when fear in the markets is at its highest, this is usually the best time to buy. The opposite is true when the majority of traders are bullish – this is when greed is at its highest and fear of missing out kicks in, which is usually the time when the price of a stock tops out.
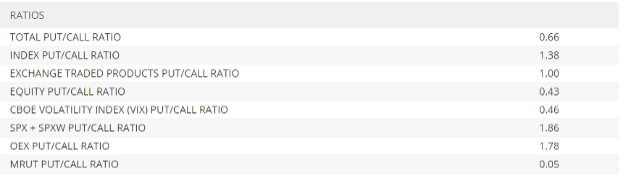
The CBOE put call ratio provides daily updates of the indicator for a number of securities and indices. The table above shows how the ratio overview looks like on their website.
For example, the equity put call ratio stood at 0.43 at the time of writing, which signals a bullish sentiment among options traders. A ratio of 0.43 means that more call options are traded than put options, which suggests that investors are willing to buy derivative contracts that allow them to buy (call options) rather than sell (put options) the underlying security.
The CBOE total put call ratio includes both index options and equity options to provide a broader measure of market sentiment.
How to Trade with the PCR Ratio
The PCR ratio can be traded in a number of ways. First, traders can initiate buying positions when the ratio drops below 1, which means that call options are relatively more popular than put options in the market, which in turn means that investors are preparing for a potential rise in prices. Similarly, traders can initiate selling positions when the ratio rises above 1, which means that puts are more in demand than calls and that investors are turning bearish on the market.
However, the put-call ratio is often considered a contrarian indicator. This means, a ratio below 1 would be a selling signal, and a ratio above 1 would be a buying signal. Let’s take a look at how this put call ratio analysis would play out in the $TSLA stock (Tesla Inc.).
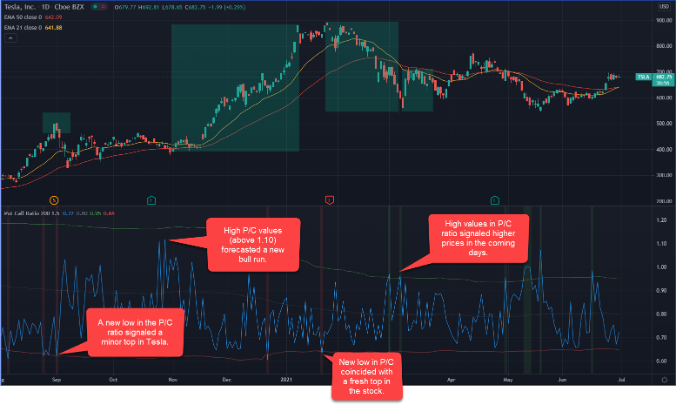
In the screenshot above, we added the put-call ratio chart to the daily chart of Tesla Inc. This indicator has two additional lines (the green and red ones that wrap the indicator) which plot the standard deviation of the put-call ratio for a pre-specified lookback period.
This is a welcoming feature, as it allows us to identify marginal extremes in the indicator itself. The indicator also plots red vertical lines when the ratio falls below the lower standard deviation line, and green vertical lines when the ratio rises above the upper standard deviation line. These vertical lines can be used as buying and selling signals by traders.
Now, let’s interpret the signals shown in the chart. On the left-hand side of the chart, the put call ratio indicator briefly dropped below the lower red line, which also coincided with a minor top in the Tesla stock.
The next time the ratio reached fresh marginal highs (although below the green standard deviation line), the Tesla stock was just about to start a strong bull run that lasted for a few weeks. After that, a new low in the P/C ratio signaled a fresh top in the stock.
And finally, when the ratio broke above the upper green line, this delivered another bullish signal as the price rose for a few days by more than a hundred dollars.
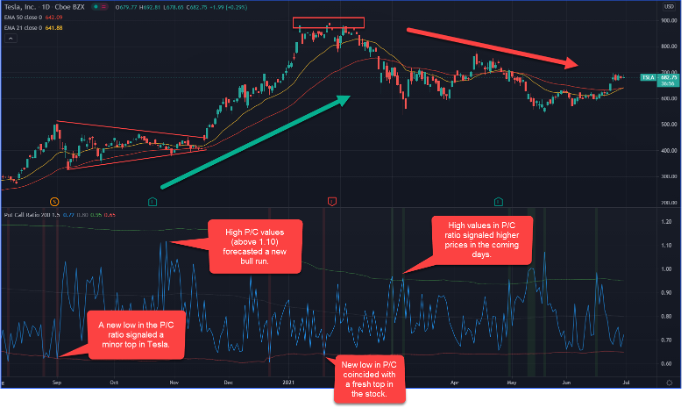
Although the overall results of using the bare put-call ratio are already quite good, traders could (and should!) apply other analytical tools to improve the signals of the indicator and create a PCR trading strategy. While this can be anything from fundamentals to Intermarket analysis, we have added some popular technical analysis tools to the chart above to form a complete put call ratio trading strategy.
Starting from the left-hand side, the $TSLA stock formed a symmetrical triangle which signaled a potential continuation of the underlying uptrend. The breakout above the triangle occurred at a time when the put-call ratio was quite low, signaling an attractive buying opportunity in the stock.
The 50-day and 21-day moving averages (red and yellow on the chart) can also be used to filter through the signals generated by the put-call ratio. For example, a trader could initiate buying positions only when both moving averages slope upwards, or they could wait for an MA crossover to confirm a signal produced by the put-call indicator.
Finally, the $TSLA stock formed quite a strong triple top pattern, signaling that buyers are losing steam and that sellers are about to take over control in the market.
Interestingly, this bearish signal coincided with the put-call ratio forming a new low below the red standard deviation line, which confirmed our bearish bias.
Pros and Cons of Relying on the Put-Call Ratio
Just like other measures and ratios that are designed to help traders make informed trading decisions, the put-call ratio doesn’t come without any weaknesses. However, let’s first cover the main advantages of using the ratio in trading.
Pros
Efficiency – The put-call ratio has proved to be an efficient measure of the prevailing market sentiment at any given time. The ratio has identified many tops and bottoms in the markets in the last few years by measuring the relative volume between put and call options that are traded during the day.
Direction – Not only does the put-call ratio help gauge market sentiment but the value of the ratio can also be used to determine the most likely direction for the underlying instrument. If the ratio is above 1, it’s usually a bearish sign.
Conversely, a value below 1 is often considered bullish. Just bear in mind that some traders prefer to take a contrarian approach by buying when the put-call ratio rises above 1 and selling when the ratio falls below 1.
The philosophy of this approach is that overextended markets tend to return to their mean value over time and that the majority of traders and investors often do the opposite of what they should be doing (which is why most of them lose money in the markets in the first place.)
Cons
Lack of available data – While companies with high market capitalizations usually have options, the majority of companies don’t offer options on their stocks. This makes it impossible to use the put-call ratio to measure the sentiment for the majority of stocks in the market.
However, traders can take advantage of the volume between puts and calls (or their open interest) in broad market indices, such as the SPY put call ratio, to get a general view of how market participants are perceiving the current market situation.
P/C Ratio is not bullet-proof – Although the foundation of the put-call ratio is sound, the indicator is still far away from the holy grail. Traders should always complement the put-call ratio with other types of analyses, such as technical, fundamental, or Intermarket, before making a final trading decision. Also, they need to make sure to risk only a small portion of their trading account on any single trade.
Reading the P/C chart – Traders need to make sure to individually analyze the put-call ratio for any single stock. Find the historical extreme levels in the ratio and analyze how the price behaved during those periods.
Final Words
The put-call ratio is a powerful indicator that is used to measure the overall investor sentiment in the markets. As its name suggests, the indicator is based on options, specifically the trading volume of put options relative to the trading volume of call options. Alternatively, traders may also use open interest instead of trading volume to calculate the ratio.
The put-call ratio typically provides a buying signal when the value drops below 1 (meaning calls are more popular than puts), and a selling signal when the value rises above 1 (meaning puts are more popular than calls.) However, the indicator is most often used as a contrarian indicator, which means it provides a selling signal below 1 and a buying signal above 1.
When trading with the put-call ratio, traders should always complement the indicator’s signals with other analytical tools, such as fundamentals and technicals, to form a put call ratio strategy. Although the put-call ratio is a very effective indicator, it’s not bullet-proof. There are times when the indicator provides strong buying or selling signals, yet the market simply continues in its original direction.
Also, bear in mind that not all stocks offer options, which reduces the universe of available stocks to which the put-call ratio can be applied. In those cases, traders may use the put-call ratio on a broader market index, such as the S&P 500, to feel the pulse of investor sentiment.