Intermarket analysis was popularized by renowned financial market technical analysis expert John J. Murphy in his 2004 book entitled, “Intermarket Analysis: Profiting from Global Market Relationships”. Subsequent advancements in neural network technology as applied to trading systems have made this an increasingly relevant subject for today’s forex trader.
Intermarket analysis simultaneously takes into account developments in and cross market correlations among the four primary financial markets. Specifically, these markets are: the forex market, the commodity market, the bond market and the equity market.
Among other things, intermarket analysis can be used to determine the current progress of the business cycle and how it is likely to affect various market sectors.
Intermarket analysis techniques can therefore provide a useful long term forecasting method for investment market analysts and business managers.
The following sections of this article will describe the key intermarket analysis principles and methods and explain how forex traders can use intermarket analysis to make better currency trading decisions and to devise profitable intermarket trading strategies.
Why Use Intermarket Forecasting Techniques?
Market price and exchange rate movements may seem to be highly erratic and even random as traders absorb new information, develop new opinions and adjust market prices accordingly. Nevertheless, despite the appearance of a random walk in market prices, analysts have regularly observed that market behavior forms patterns. Furthermore, they note that these same patterns tend to repeat themselves and hence may contain some prized predictive value for the astute observer in terms of the future direction of market pricing.
Such price patterns can be seen operating in virtually all markets and in all time frames, and more importantly for this discussion, they can even be observed when looking at the established relationships that have evolved for interrelated markets. Given the international nature of financial markets and the ability of traders to quickly absorb and react to new information, related markets now increasingly react together as their participants respond to the same geopolitical and economic information that now quickly reaches all parts of the globe.
These global market interrelationships mean that forex traders need to keep themselves aware of what is going on in other related markets, rather than just single mindedly focusing on performing technical analysis on a single currency pair. That may have been sufficient in the previous millennium but not in today’s global information age as our new age technology brings financial information to market participants in an instant.
Using intermarket analysis helps give currency traders a new edge in this increasingly global and interrelated financial marketplace in which the forex market plays a key and pivotal role, along with bond traders, commodity futures players and stock market operators.
Some forex traders ignore such key relationships between markets for the sake of simplicity, however, those that choose to bypass these key interdependencies, do so at their own detriment. Learning how to apply and use intermarket analysis to your currency trading decision process can make the difference between profitability and loss in today’s increasingly inter-related global marketplace.
The Key Inter Market Relationships
The four primary markets used in intermarket analysis — i.e. the currency, equity, bond and commodity markets — tend to relate to and interact with each other in ways that analysts have identified over the years. These well-established intermarket relationships allow those analysts familiar with them to make predictions about future market behavior based upon observations made in a correlated market.
In this sense, correlation refers to the degree to which two markets tend to have a relationship with one other that can be described as linear. A positive correlation implies that the correlated markets tend to move in the same direction, while a negative or inverse correlation signifies that the related markets typically move in the opposite direction.
As John J. Murphy points out in his aforementioned book on Intermarket Analysis, market analysts have observed a number of key correlated relationships between the stock, bond, currency and commodity markets over the years. Seven of these important intermarket relationships can be described as follows:
- Trends in commodities and the U.S. Dollar tend to be negatively correlated. This intermarket relationship implies that if the U.S. Dollar has been falling recently, that fact is seen as bullish for commodity prices.
- Commodity prices and bond prices tend to be negatively correlated, while commodity prices and interest rates tend to be positively correlated. This means that when commodity prices are rising, then that will usually be bearish for bond prices and bullish for interest rates.
- Bond prices and equity prices tend to be positively correlated, while interest rates and stock prices tend to be negatively correlated. This relationship indicates that rising bond prices and falling interest rates will typically be bullish for stocks, while falling bond prices and rising interest rates tend to be bearish for stocks. This is the most common relationship observed due to the general prevalence of positive inflation in most major economies.
- The rather rare observance of rising bond prices accompanied by falling stock prices is an indicator of a deflationary environment for an economy.
- The bond market typically reverses direction before the stock market does. As a result, bond price reversals can be seen as a leading indicator of equity market reversals in an economy.
- A rising currency tends to be positively correlated with the prices of stocks and bonds denominated in that currency. This means that an upward trend in the U.S. Dollar would be bullish for U.S. equity and bond markets, while a downward trend in the U.S. currency would be bearish for U.S. stock and bond prices.
- If commodity prices are rising, a decline in the value of the U.S. Dollar tends to be bearish for the prices of U.S. stocks and bonds. Conversely, if commodity prices are declining, a rise in the U.S. Dollar’s value will usually be bullish for U.S. stock and bond prices.
These commonly observed correlations have a fundamental basis in the relationship between inflation, interest rates and the evaluation process the relevant marketplace goes through to determine suitable prices for goods and companies and exchange rates for currencies.
Not only does intermarket analysis among the stock, forex, bond and commodity markets have a sound fundamental basis, but such relationships can also be analyzed by various methods that seem to fall more into the realm of technical analysis.
Tools for Intermarket Analysis
One of the most common methods of performing intermarket analysis involves observing the evolution of price action and/or exchange rate movements in each of the four relevant financial markets. As with many areas of market analysis, one of the primary tools for intermarket analysis is a chart of prices and exchange rates as they have changed over time.
For example, intermarket analysts will often superimpose performance charts of the four key markets on top of one another to observe trends and deviations from expected relationships that might present trading opportunities. Performance charts allow an analyst to compare how different markets performed over a particular time frame. This type of intermarket technical analysis, allows the analyst to evaluate the performance of an asset as the percent change of its closing price observed over time.
Each of the colored lines on a performance chart depicts the percent change seen for a particular asset from the starting point on the left side of the chart. Analysts can use such charts to make comparisons between several assets by superimposing the graphs of several performance lines on a single chart.
Figure 1 below shows an example of how such an intermarket analysis performance chart might look. The intermarket comparison performance chart shown in Figure 1 plots the performance values for the Standard and Poor’s 500 stock index, the Thomson Reuters/Jeffries Core Commodity CRB commodity index, the U.S. Dollar Index, and the CBOT’s 10 year Treasury note on top of one another in different colors.
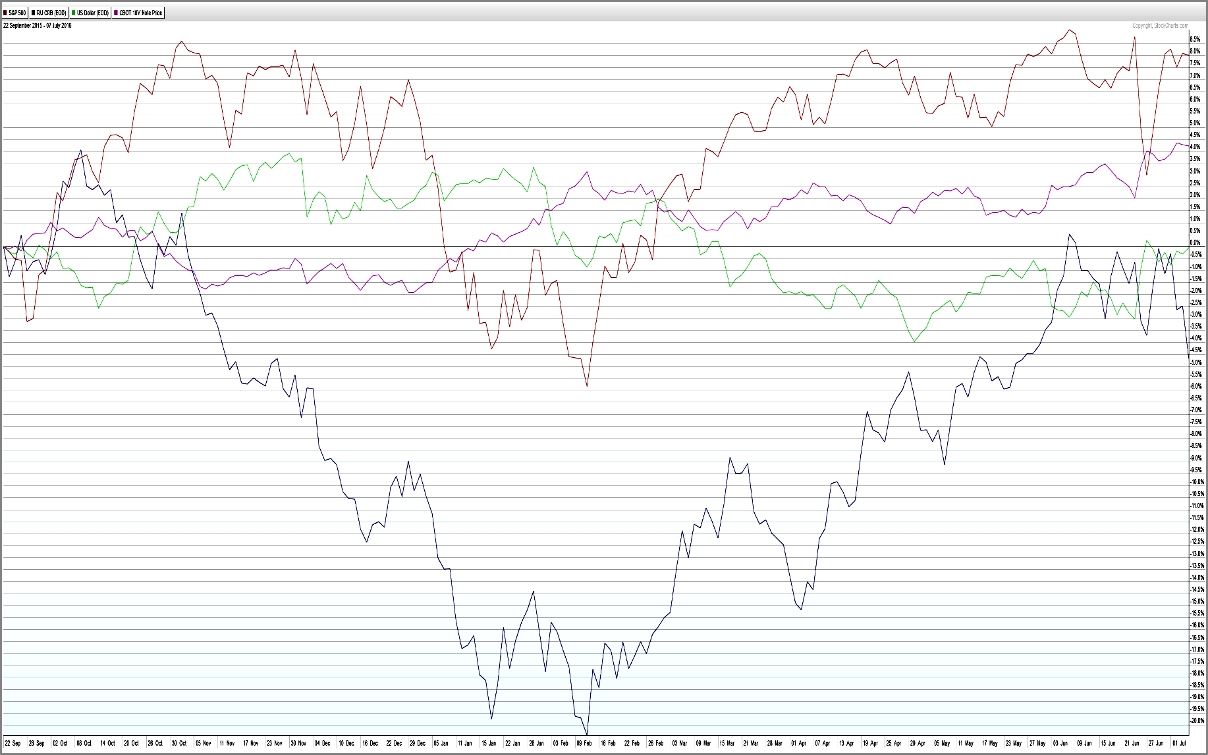
Figure 1: An intermarket comparison chart plotting the performance of four markets superimposed on a single graph. The lines represent the four markets as follows: Red = S&P 500 stock index, Dark Blue = R/J CRB (EOD) Thomson Reuters/Jeffries Core Commodity CRB Index, Green = US Dollar Index (EOD) and Purple = CBOT 10 Year U.S. Treasury Note.
This form of graphical intermarket analysis allows the analyst or trader to see how the intermarket relationships evolve over time and whether any performance behavior might indicate that a potentially profitable trading opportunity is present. It also allows them to evaluate the seven aforementioned intermarket relationships or others they might have identified.
Currency Trading and Intermarket Analysis
Many forex traders first come across the concept of intermarket analysis when they observe correlations between the value of the currencies they are trading and key strategic commodities like gold and oil. The Australian Dollar, the Canadian Dollar and the New Zealand Dollar are even commonly referred to as “commodity currencies” due to the correlation between their relative valuations and the price of certain key commodities like gold, for example.
Some of the most important currency and commodity relationships are listed below along with explanations regarding why these relationships tend to hold:
Gold Related Currency Relationships:
- The price of gold and the value of the U.S. Dollar tend to be inversely correlated. This is because investors tend to sell paper fiat currencies like the U.S. Dollar in favor of holding hard assets with intrinsic value like traditionally precious gold in times of economic or geopolitical crisis.
- The price of gold and the value of the Australian Dollar tend to be positively correlated. This relationship holds because of Australia’s position as the third largest producer of gold in the world. The Oceanic country currently exports roughly five billion U.S. Dollars’ worth of gold each year, making its economy very sensitive to the value of the shiny yellow metal. A rise in the price of gold therefore tends to boost the AUD/USD exchange rate.
- The price of gold and the value of the Canadian Dollar tend to be positively correlated. As with Australia, Canada is a substantial gold producer, ranking fifth in the world. Thus, when the price of gold rises, USD/CAD tends to fall since the Canadian Dollar rises.
- The price of gold and the value of the New Zealand Dollar tend to be positively correlated. New Zealand is also a significant net exporter of gold like Canada and Australia, ranking around 25th in the world.
- The price of gold and the value of the European Union’s Euro tend to be positively correlated. This relationship has evolved because when money flows out of the U.S. Dollar, it tends to flow into other quality assets like gold and Euros. A rise in the price of gold will therefore also tend to be accompanied by a rise in the EUR/USD exchange rate.
- The price of gold and the value of the Swiss Franc tend to be positively correlated. The Swiss Franc tends to be a safe haven currency — and although the Swiss currency no longer has to be 40 percent backed by gold reserves by law — the Swiss National Bank still retains substantial gold reserves which makes its currency more valuable than that of other countries who lack such reserves. Rising gold prices will therefore tend to be accompanied by a lower USD/CHF exchange rate as the Swiss Franc strengthens.
Oil Related Currency Relationships:
- The price of oil and the value of the Canadian Dollar tend to be positively correlated. This relationship is due to Canada’s status as one of the world’s top oil exporters, selling roughly two million barrels of oil each day to the United States alone. Rising oil prices will therefore tend to reduce the USD/CAD exchange rate as the Canadian Dollar goes up.
- The price of oil and the value of the Japanese Yen tend to be inversely correlated. This relationship arises because Japan is a net importer of oil. Hence, an increase in oil prices will tend to boost the USD/JPY exchange rate as the Japanese Yen weakens.
Currency and Equity Market Relationships
 In addition to the aforementioned commodity price correlations, some currency pairs also respond to shifts in relevant stock markets.
For example, when the Japanese Nikkei stock market index falls, USD/JPY also tends to decline since investors consider the Japanese Yen a safe place to put their funds and so its value strengthens.
Another perhaps more complex currency and equity market relationship has to do with the perception of risk and the relative amount of risk aversion among investors in the market. When investors are less risk averse and hence are willing to take risks, the stock market tends to rise. Similarly, currency pairs like AUD/USD, NZD/USD and EUR/JPY will also tend to rise in that situation, and pairs like USD/CAD, EUR/AUD and GBP/AUD will tend to decline.
On the other hand, when investors are seeking safe havens because they are becoming more risk averse, the stock market tends to fall. In this situation, currency pairs like AUD/USD, NZD/USD and EUR/JPY will also tend to fall, while pairs like USD/CAD, EUR/AUD and GBP/AUD will tend to rise.
Developing an Inter Market Trading System
Once traders start to be become aware of intermarket analysis, most of them will want to know how to start trading with intermarket analysis. They also typically want to know how to apply intermarket analysis in forex trading and how to develop a profitable intermarket trading system based on this valuable information.
The numerous details involved in developing and testing an intermarket trading system are beyond the scope of this article. Nevertheless, as a starting point, the interested forex trader can learn how to create and use performance charts like the graph shown in Figure 1 above, which is a key intermarket analysis tool. This will enable them to research new intermarket correlations and ensure that traditional ones are still relevant.
Forex traders should also be aware the typical relationships between relative currency evaluations and commodity or stock market movements detailed above. Thus, when they see a sharp movement on one side of a correlated pair of markets due to some unexpected news event, they can reasonably expect a corresponding rise or fall in the other side of the pair, depending on whether the established correlation is positive or negative.