As a trader, you should be familiar with some of the leading theories concerning market structure and cycles. Some of the more popular ones include the Elliott Wave Principle and the Dow Theory. Nevertheless, today we will add one more important type of market analysis to your trading arsenal. We will be taking a deep dive into the price action based methodology known as the Wyckoff trading method.
Who was Richard Wyckoff ?
Richard Wyckoff was a famous stock trader and investor who was born in the late 19th century. Wyckoff was fascinated by the stock market at an early age, and by the time he was in in his mid 20’s he was able to open up his first brokerage firm. Later, he authored several famous stock trading books, which are still studied by today’s market players.
Two Rules of Richard Wyckoff
The Wyckoff theory is based primarily on price action and the different cyclical stages the market falls in to. It is essential that we discuss two important rules stated in his book “Charting the Stock Market”. These two essential rules are paraphrased below.
- The first rule of Richard Wyckoff states that the market never behaves the same way. Price action will never create a move in exactly the same way that it did in the past. The market is truly unique.
- The second Richard Wyckoff rule is related to the first one. It states that since every price move is unique, its analytical importance comes when compared to previous price behavior.
These two rules are essential for the information we will discuss next – the Wyckoff Market Cycle theory.
Wyckoff Market Cycle Theory
Wyckoff developed a price action market theory which is still a leading principle in today’s trading practice. The Wyckoff method states that the price cycle of a traded instrument consists of 4 stages – Accumulation, Markup, Distribution, and Mark Down.
Accumulation Phase
The process of accumulation is the first stage of the Wyckoff price cycle. The Accumulation stage is caused by increased institutional demand. Bulls are slowing gaining power and as a result, they are poised to push prices higher.
Although the Accumulation stage is related with the bulls gaining authority, the price action on the chart is flat. In other words, the process of accumulation is illustrated by a ranging price structure on the chart.
Higher bottoms within the range is usually considered a signal that the price action is currently in an Accumulation phase.
Markup Phase
The Markup is the second stage of the Wyckoff trading cycle.
Bulls gain enough power to push the price through the upper level of the range. This is usually a signal that the price is entering the second stage and that a bullish price trend is emerging on the chart.
Distribution Phase
The Distribution process is the third stage of the Wyckoff price cycle. This phase is where the bears are attempting to regain authority over the market.
The price action on the chart at this stage is flat, just as with the Accumulation process. One indication that the market is in a Distribution stage will be the sustained failure of price to create higher bottoms on the chart.
The price action creates lower tops which is an indication that the market is currently experiencing a selloff.
Markdown Phase
The Markdown is the last stage of the Wyckoff price cycle.
The Markdown process comes as a downtrend begins after the Distribution phase. It indicates that the bears have gained enough power to push the market in the bearish direction.
The Markdown is confirmed when the price action breaks the lower level of the flat range of the horizontal distribution channel on the chart.
Afterwards the entire process repeats starting from the first stage – the Accumulation process.
Below you will find a sketch illustrating the concepts of the Wyckoff Price Cycle:
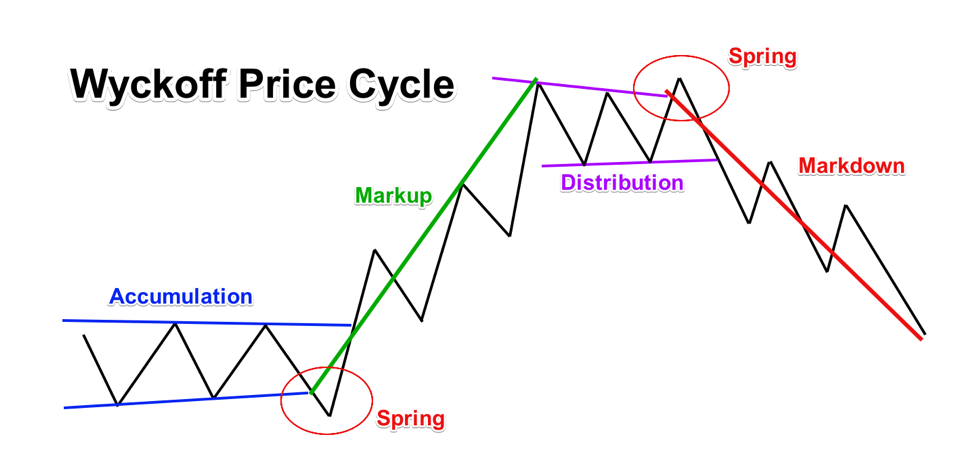
The blue lines indicate the Accumulation process on the chart. Notice that the first two bottoms are increasing. This confirms that the market might be accumulating at this point. The breakout through the upper level of the Accumulation range confirms the end of the Accumulation and the beginning of the Markup (green).
Then the decreasing tops within the upper range signal that the market might be entering a Distribution. The breakout through the lower level of the Distribution range confirms the end of the stage and the beginning of the Markdown (red).
Accumulation / Distribution Price Spring
You may have noticed something on our Wyckoff market cycle sketch that we did not mention yet. Did you notice that the price action dipped below the Accumulation channel and went above the Distribution channel prior the creation of the real breakout? This occurrence is called a Wyckoff spring, which is essentially a false breakout. This is another strong confirmation that the price action is following the Wyckoff market cycle.
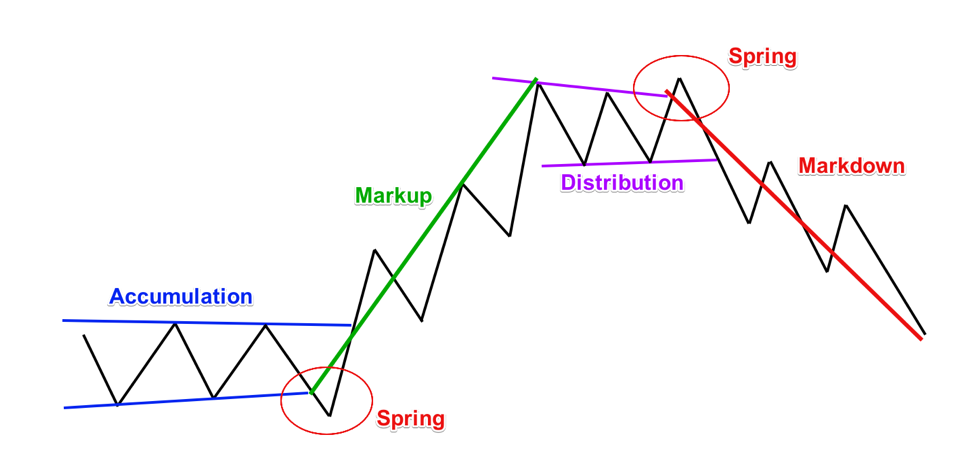
The red circles on the image above show you how the spring appears within the Wyckoff structure. The initial breakout (Spring) opposite to the expected price move is used as a confirmation of the cycle unfolding. The spring is often associated with stop running, wherein institutions push prices to obvious stop loss areas to find the required liquidity to fulfill their orders.
Three Laws of Wyckoff
Richard Wyckoff emphasizes three laws which are a natural cause of the Market Cycle.
Supply vs. Demand
If there is greater selling pressure, caused by excess supply, we are likely to see a decrease in price. If there is a greater buying pressure, caused by excess demand, we are likely to see an increase in price.
Effort vs. Result
Wyckoff says that every effort should lead to a result in the financial markets. An example of the Effort vs. Result relationship is the data on trading Volume. If there is an unusually high trading volume, we may expect a big price move. So, the big volume bar is the effort of the market players to gain dominance. The big market move is the result of that effort.
Cause vs. Effect
Wyckoff states that every cause in the market leads to a proportional effect. Take for example the Accumulation and Distribution stages. Accumulation leads to Markup and the price increases, and the Distribution leads to Markdown and the price decreases. The Accumulation is the cause, and the Markup is the effect.
Wyckoff Volume Spread Analysis
Volume is of a great importance for the Wyckoff trader, because it can provide valuable information into what is really going on “behind the scenes”.
Wyckoff Volume Analysis provides confirmation of progressing events during the Wyckoff Price Cycle. As we pointed to earlier, high volumes can lead to sustained price moves on the chart – the Result. However, this is not all. Wyckoff Volume Spread Analysis also helps you identify periods when the price is transitioning between the different stages of the Wyckoff Price Cycle.
When the price moves through a key level during the Wyckoff Price Cycle, you should consider the move valid if the trading volumes are relatively high during the breakout. If the volumes are decreasing, then you are probably looking at a spring (false breakout) rather than a real breakout. The chart below provides an illustration of this phenomenon.
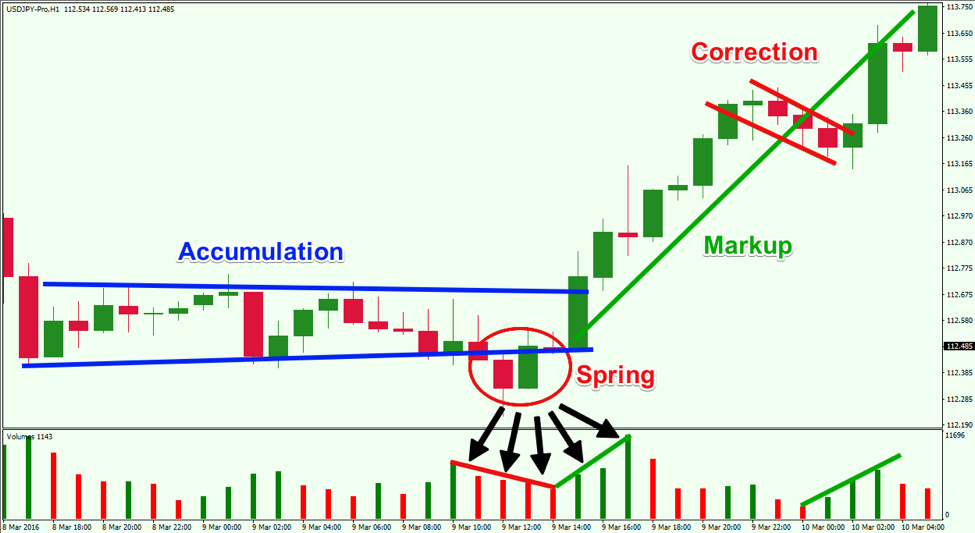
This is an example of an Accumulation stage of the Wyckoff cycle. Notice on the chart that the first two bottoms ( based on closing prices ) are slightly increasing. This hints that the market is likely in an accumulating stage. Suddenly, we see a bearish breakdown through the lower level of the blue range. However, the volume is decreasing during the breakdown through the level, which suggests that this could be a false break (Spring) before the real breakout actually takes place.
The price reverses right after the breakdown, creating a couple of big bullish candles. At the same time, the trading volume is increasing. This is a strong indication that the Price Cycle is likely entering the second stage – the Markup. Subsequently, price breaks the upper level of the range and begins a sharp increase.
The bullish move slows down slightly during decreasing volumes. This hints that the price action is likely to undergo a corrective move, which is exactly what happens.
The resumption of the bullish move comes with the price action breaks through the upper level of the corrective channel on increasing trading volume.
How to Profit with Wyckoff Trading in Forex
Traders can use the Wyckoff Price Cycle to recognize upcoming price moves. For example, the end of an Accumulation stage is the beginning of a Markup, which could be traded to the long side. At the same time, the end of a Distribution stage is the beginning of a Markdown, which could be traded to the short side.
Understanding the different stages within the price cycle will allow you to position for the next most likely price tendency. We can try to buy as close to the beginning of a Markup and try to hold it as close to its end as we can. The same practice is in force for shorting Markdowns.
Wyckoff Trading Strategy
After performing your Wyckoff Analysis, you should recognize the current market cycle. In order to take advantage of the current cycle, we must have a trading plan in place that we can execute on. So, let’s now discuss some rules around a Wyckoff trading strategy, which will help you to initiate and manage your trades within the price cycle.
Wyckoff Trade Entry
You should enter a trade when the price action is transiting from Accumulation to Markup and from Distribution to Markdown. First, you would need to confirm the current stage when the Forex pair is ranging. It would help to identify increasing bottoms for an Accumulation and decreasing tops for Distribution. In addition, it would be useful to analyze the previous price move for additional clues.
Another way you can attempt to confirm an Accumulation or Distribution stage is by identifying a Spring, which is the transitional price action behavior that often occurs between the cycle stages.
Chart patterns can also be helpful in identifying Accumulation and Distribution processes on the chart. The potential price move out of a pattern could help you identify the transition to a Markup or a Markdown.
The actual trade comes when the price action breaks the range in the direction of the expected move. For example, you could buy the currency pair when the price breaks the flat range through the upper level. Contrary to this, you could sell the currency pair when the price action breaks the lower support level of the Distribution area.
Also, you should keep an eye on volume for additional clues that confirm that your decision is correct.
Wyckoff Stop Loss Order
As you are well aware, there is no sure thing in Forex trading. Therefore, you should always use a stop loss order when opening a trade. If you are trading a Markup, your stop loss order should be located below the lowest point of the Accumulation stage. If you are trading a Markdown, then your stop loss order should be positioned above the highest point during the Distribution stage.
Wyckoff Take Profit
You can use price action analysis in order to manage your take profit points. Let’s discuss a case where you trade a Markup.
One indication that the price is transiting from a Markup to a Distribution is the presence of descending tops on the chart. This event should make you aware that a possible selloff might be taking place now.
Another exit signal on the chart would be a bearish spring on the chart. If you spot it, then you would want to exit your trade, because the price action has entered the late stage of the Distribution curve.
The third manner in which you could manage your exit is by keeping an eye out for developing chart patterns and candlestick patterns. Spotting a reversal formation could be a signal that the price may due for a correction or change of trend.
One thing is for sure, Wyckoff analysis and the price action techniques go hand and hand. Therefore, price action analysis is a great way to initiate and manage trades within the Wyckoff price cycle. You should always be flexible in your analysis and open to what the market is doing at any given time. Be ready to act in a manner that is in tune with the current available market information as evidenced on your price chart.
Wyckoff Trading Method Example
Now let’s show the Wyckoff market analysis in action, using the trading strategy we discussed above. Have a look at this image:
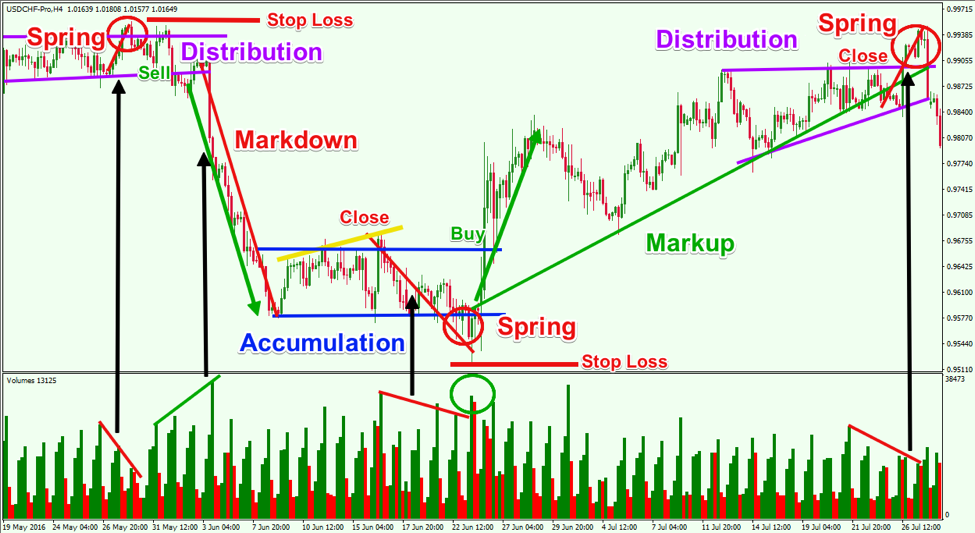
Above you see the H4 chart of the USD/CHF Forex pair for May – July, 2016. The image shows a Wyckoff based technical analysis approach for the currency pair.
The image begins with the USD/CHF in a Distribution phase. Suddenly, the price action breaks the upper level of the Distribution range. However, the trading volumes at that time are decreasing, which calls into question the authenticity of the upside breakout. Therefore, we can reason that a Spring pattern on the chart may be forming.
The price action reverses afterwards and breaks the lower level of the Distribution channel on increasing volume. You could sell the USD/CHF at this moment placing a stop loss above the highest point of the Distribution range as shown on the image.
See that the Markdown begins right after the selloff and the price of the Swissy decreases more than 4% in less than a week. Then we see a sideways movement, which hints that the Markdown phase is probably completed. You would close your trade when the price action begins to create increasing tops on the chart (yellow line). We also have a Double Bottom chart pattern created at the first two bottoms – another reason to close the trade.
The price finishes the Markdown stage and starts an Accumulation, which could be seen in the blue horizontal channel. During the Accumulation, we see that the price drops on decreasing volumes and breaks the blue channel downwards. Since the volumes are decreasing, we anticipate a Spring pattern rather than a valid breakout.
Notice the Volume bar in the green circle. It reverses the decreasing volume tendency. At this moment, the price action ends the Spring and starts an increase. A few periods later, we see a breakout through the upper level of the Accumulation channel. This is a strong buy signal, which you could use to go long the USD/CHF pair. You should place your stop loss order below the lowest point of the Accumulation process as shown on the image.
The price action enters a Markup stage afterwards. The USD/CHF Forex pair rises creating higher highs. After a 3.67% increase the price action starts to range. The purple triangle shows that the price action exits its green bullish trend and creates a sideways movement. The downside break through the green bullish trend line is a signal that the Markup stage is probably completed and the new Distribution stage is on its way. Suddenly, the upper level of the triangular range gets broken on decreasing volumes. This is another Spring pattern on the chart. You could close your long position there on the assumption that the price will reverse and enter a Markdown stage.
Conclusion
- Richard Wyckoff was a famous stock trader and investor, who developed a market theory based on Price Cycles.
- There are two important Wyckoff rules you should remember:
- Price moves are never the same. The market is unique and has its own mindset creating different price moves every time.
- The importance of a price move comes when it is being compared with previous price behavior.
- The Wyckoff Price Cycle states that there are four stages in a market:
- Accumulation
- Markup
- Distribution
- Markdown
- The Spring pattern is a sharp price move which breaks a ranging channel in the direction opposite to the real expected breakout. This false break appears during low volumes and often gets reversed to send the price to the next stage.
- There are three important Wyckoff rules:
- Supply vs. Demand
- Effort vs. Result
- Cause vs. Effect
- Volumes are important when trading the Wyckoff Price Cycle.
- Authentic breakouts appear on increasing and high trading volumes.
- If volumes are decreasing at a breakout, then the likelihood of a real breakout is reduced.
- Wyckoff Trading Strategy:
- Open a trade when the price transitions from Accumulation to Markup or from Distribution to Markdown.
- Put a stop loss at the other side of the range.
- Stay in the trade until the price action and/or the volume indicator give you an opposite signal.