 Can portfolio managers outperform the major averages? More than four decades ago Princeton economist Burton Malkiel wrote his classic book “A Random Walk Down Wall Street” in which he argued that returns are random and investors cannot produce returns that are better than the major averages.
The book has been revised many times, and there is a new addition as recently as 2007. Malkiel’s random walk theory is based on the notion that returns produced by stocks are unpredictable and random and therefore, a portfolio manager cannot produce consistent returns that will outperform the broader market. The book states that using different types of analysis will only lead to underperformance, as there is no way to predict prices over the long term.
His conclusion, to his random walk model, is that an investor is better off purchasing an index fund that replicates the returns of the broader market, and use a buy and hold strategy. This is the essence of Malkiel’s random walk hypothesis.
The Random walk theory asserts that stock price returns are efficient because all currently available information is reflected in the present price of a security and that movements are based purely on traders’ sentiment which cannot be measured consistently.
When new information becomes available, the price of a security will quickly adjust and immediately reflect the new information. Since new information is random and unpredictable, there is market randomness, and therefore the returns associated with prices are unpredictable, creating a random market.
Efficient Market Hypothesis
The Random Walk theory is predicated on the notion that the market is efficient, and that when new information becomes available to traders, they will react in a way to change the price to reflect new information. This theory has some issues as not every market participant has the same motivation.
For example, a corporate treasurer and a hedge fund manager will have some different motivations as to when they should transact. While a hedge fund manager might shy away from a period when a security price is tumbling, a corporate treasurer might be looking to use a large price drop to initiate a buyback program.
A corporate treasurer will also use derivative securities in different ways. For example, if a stock price is declining rapidly and a company has a buyback program, a corporate treasurer might use a technique where he is selling puts below the market to enhance the program by receiving a premium.
In this situation, if a treasurer sells put options below the market, he can receive premium regardless of whether the strike price of the put option is reached. This type of motivation will alter the way efficient market theory occurs, since the corporate treasurer, sees the market differently than a trader or portfolio manager.
Additionally, the time horizon used by traders can alter the efficiency of a market. Investors who are looking to hold stock for the long term will behave differently than those who are attempting to day trade a security. For example, if you are dollar cost averaging, where you purchase a stock as it declines, your goal is different than the trader who is looking to capture small moves on both long and short trades.
Algorithms Enhance Efficient Market Theory
The markets have changed considerably since the last version of a Random Walk Down Wall Street was written in 2007. Today, algorithms are a large part of short-term movements in nearly every capital market. An algorithm is a computer program that looks for changes in information and immediately reacts by buying and selling securities. These securities could be stocks, currencies pairs, bonds or even commodities.
High-frequency algorithmic trading strategies use computer algorithms that are trading thousands of times a day trying to influence the market as well as capture inefficiencies. High-frequency traders made their first foray into the equity markets. New regulation allowed electronic exchanges to compete with one another, which left the door open for high-frequency traders to step in and search for discrepancies in prices.
Today, algorithms use data that is accumulated from many different sources. Algorithms are scanning websites and the Twitter universe looking for keywords to determine how they should transact. A simple term such as the “Feder Reserve Rate Hike” could set off a cascade of transactions, which could result in volatile market movements. Many of the recent flash crashes have been generated by algorithms that quickly buy and sell securities and create a snowball effect when new market information becomes available.
Algorithms also alter the distribution of stock returns. In general, the returns reflected in the capital markets are not normally distributed. What does this mean? For example, if you were to measure the weight of 100 school children and plot the distribution you would likely see a classic bell shaped curve. The most recurring weight would be the middle and the remaining weights of these children would be distributed on either side. Approximately 68 % would fall within 1-standard deviation of the middle and 95% would fall within 2-standard deviations.
There have been numerous studies that have found that returns of securities are not normally distributed and these returns have fat tails. This means that there will be a high number of returns that are outside the normal distribution. Some might be lower and many might be higher.
Since algorithms are designed to take advantage of new information, their rapid reaction to new information generates returns that are not normally distributed. They are trained to do nothing when there is no new information, providing little liquidity, but to erupt when there is new information generating volatile market conditions.
Non-Random Walk Theory
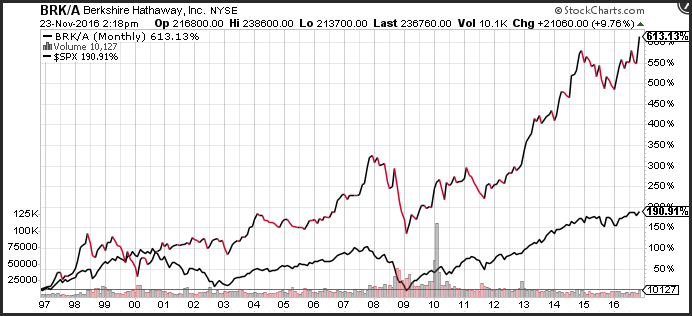
While the theory that Malkiel provides has merit, to the extent that he can make the argument that prices are random, there have been many portfolio managers who have outperformed the broader markets. This means that a buy and hold methodology is not the best way to achieve risk-adjusted returns. As an example, over the past 20-years, Berkshire Hathaway has experienced 613% return on capital compared to the S&P 500 index (excluding dividend) which has a return profile of 190%.
There have also been several papers and articles that have been written to counter the arguments made by Burton Malkiel, asserting that there is a non-random market. There is a collection of articles called “A Non-Random Walk Down Wall Street” which offers evidence that the price of a stock offers valuable information.
The empirical data that was used was a series of econometric models that tested the randomness of prices. The non-random walk was composed by Andrew Lo, who is a non-random proponent, with a conclusion that there are many techniques that can be used to beat the major averages, but the question remains for how long can these methodologies be successful. Lo said, “The more creativity you bring to the investment process, the more rewarding it will be. The only way to maintain ongoing success, however, is to constantly innovate.” His thought process on beating the markets over the long term was to change your methodology to adjust to market conditions constantly.
Test for Market Randomness
There are several tests that can be performed to determine if a data series is random. For example, a RUNS, test named after Abraham Wald and Jacob Wolfowitz, is a statistical methodology that evaluates the randomness of a two or more-time series.
The runs test can determine if trends exist in a market and how often they occur. The null hypothesis is assumed, which means that there is no dependence and no trend that exists, and the populations are identical in nature. The runs tests ranks the values and either proves the null hypothesis or suggests a trend.
Regression Analysis
Another way to determine if a variable is dependent on another variable is to run a regression analysis. A regression formula designates an independent and dependent variable as well as an R-squared, which describes how dependent one variable is on another.
The simplest regression analysis uses a predictor variable and a response variable. The data points are reported using a least-squared method. If there are outliers in the data series that are suspect, resistant methods can be used to fit the model. An R-squared of 1 means the dependent variable moves in tandem with the independent variable.
Correlation Analysis
Another technique that is used to determine the non-random nature of securities is correlation analysis. Correlation is like regression in that you are using multiple time series to determine if the returns move in tandem.
The analysis evaluates the returns of one time series relative to another and provides you with a correlation coefficient between 1 and -1. A correlation coefficient of 1 means that the returns of the 2-time series move together in lockstep. A correlation coefficient of -1 means that the returns of the 2-time series move in the opposite directions. When you are evaluating the relationship, it is important to analyze the returns as opposed to the price.
Although correlation does not imply that the movement of one security is dependent on another security it does show that the movements of the two securities are related to one another.
The higher the correlation coefficient, the more closely the performance of the two assets are to one another. Correlation coefficients of 70 or negative 70 mean that the assets have a significant correlation or negative correlation.
An example of how to use correlation is to find an asset that might influence another asset. For example, a country like Canada has a significant number of oil companies that employ millions of people. The Canadian economy relies heavily on these companies and these companies rely heavily on the price of oil to ensure profitability. When the price of oil falls dramatically, as it did during the first half of 2015, the economies in countries like Canada face significant headwinds.
A correlation analysis can be performed over many different periods. You can perform correlation analysis over one long period, such as 1-year or over rolling periods. The number that you see over a 1-year period will incorporate the aggregate correlation period, but will not show you the nuances of how the correlation changes over specific time horizons. For example, the USD/CAD might have a correlation coefficient of -0.80 over a year but might range between -1 and -0.20 during different 20-day timeframes over the course of a year.
 Technical Analysis: A Case For Non Random Markets
Technical analysis is widely used to determine the future direction of a security. There has been some empirical work done that suggests that technical analysis can be used to outperform the broader market.
Many technicians believe that they can predict future price movements using historical data points. For example, technical analysts believe that all the available information is currently in the price of a security.
With this as a backdrop, you can only determine the future price by using studies or patterns, as past price action forecasts future price movements. At the very least, technical analysis can be used as a self-fulfilling prophecy.
If many people use technical analysis to determine the future price movements, it is important for you to understand technical analysis so you know what other might be thinking. In the following section, we will discuss some basic types of technical tools that traders utilize to predict future movement.
Demand and Support Levels
The values of a security is based on changes to the supply and demand for that security. When an investor thinks that the price of a security is cheap relative to the market’s expectations, they will buy the security in the hopes that it will climb in value. As demand for the stock increases, the price will find a pivot point where further declines will be unattainable. This is considered support.
There are many ways you can use technical analysis to determine support. Many traders use trend lines which connect swing lows to determine trend support. Upward sloping trend lines that connect higher lows are a very popular way to find support levels in a bull market.
Supply and Resistance Levels
Resistance is the opposite of support. It is an area of supply that reflects market price action where prices have a difficult time moving higher. Pent up supply builds up at resistance. Like support there are several ways you can determine resistance levels using technical analysis. You can use trend lines which connect swing highs, or you can use a horizontal trend line that also connects pivot highs.
Moving Averages
Another technical methodology that is often employed to determine the future direction of a security is using moving averages to smooth the price action and help describe a path. A moving average is an average of a specific number of days. When the next price is recorded, the first price is dropped from the calculation.
For example, if you are calculating the 10-day moving average of a security, you would average the first 10-days. On the 11th day, you would drop the first day which would generate a new data point.
Moving Average Crossover
Moving averages can help you determine the future direction by using the popular crossover methodology. The moving average crossover helps you determine if there is a new emerging trend in the security you are trading. If you are looking for a change over a short-term timeframe, then it is best for you to use short-term moving averages.
One of the more popular settings is the 5-day moving average cross above or below the 20-day moving average. This encapsulates a 1-week period and a 1-month period and is very helpful at catching short-term trends. If you are looking for a longer period, you might consider the 20-day and 50-day moving averages.
A long-term moving average crossover such as the 50-day moving average and the 200-day moving average, is very popular and known as either the “golden cross” on a cross above, and the “death cross” on the cross below. The moving average crossover is a robust way to define a trend.
Conclusion
As a technical analyst, I do not believe that the markets are random, and it is quite apparent that there are individuals that have track records that are better than the broader markets over a long period. Warren Buffet’s performance, has easily beat the S&P 500 index by 423% over the past 20-years. While Buffet uses a fundamental approach to picking companies, there are numerous examples of successful traders, who use statistical models, as well as, technical analysis to create robust and consistent returns.
There are also several statistical tools such as the runs test, regression and correlation, that show that there is dependence, and correlation between assets. The premise that all the available information is currently priced into a security has merit, and it is also clear that there is a new paradigm, where algorithms trade information that is ubiquitous, including information that is available on social media including Facebook and Twitter.
At the end of the day, even though the Random vs Non-Random proponents will continue their debate, I expect that the informed technical analyst who has a positive expectancy strategy will continue to outperform the market.