The diamond pattern is an advanced chart formation that occurs in the financial markets. It is one that is less well known to technical traders and investors alike. As such, many traders are not very familiar with its structure or trading application. In this lesson, we will dive into the specifics of recognizing and trading the diamond pattern.
Diamond Chart Pattern
The diamond formation is part of the family of classical chart patterns. But unlike the commonly seen flag, pennant, head and shoulders, and rectangle patterns, the diamond chart pattern occurs less frequently on the price chart.
As such there are not as many opportunities to trade the diamond chart pattern as some of the others mentioned. Nevertheless, technical traders should become familiar with this pattern as it provides a solid trading opportunity when it is recognized early enough.
The diamond chart pattern is often confused with the head and shoulders chart pattern. Though there are similarities between both of these formations, there are some distinct differences between the two formations.
We’ll be diving into the specifics of the diamond pattern structure momentarily, but for now it’s important to understand that the diamond pattern is a more advanced chart pattern that has reversal characteristics.
The diamond pattern occurs most often after a prolonged trend phase. When it occurs within the context of a bullish market, the pattern is referred to as a diamond top, or a bearish diamond pattern due to its bearish implication. Conversely, when it occurs within the context of a bearish market, the pattern is referred to as a diamond bottom, or a bullish diamond pattern due to its bullish implication.
Let’s take a closer look at the illustration below which details the structure of the diamond chart pattern.
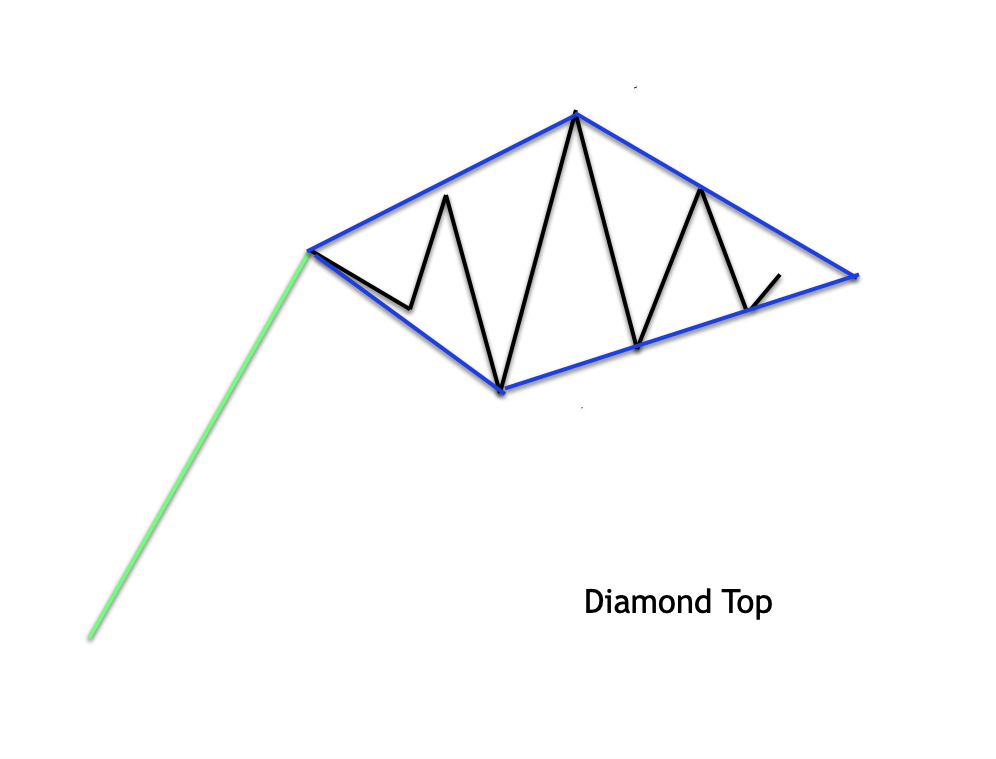
On the illustration above we can see what the diamond top formation appears as. Notice the strong uptrend preceding the diamond structure. The market rallies to a high point, and then retraces lower. Then the market makes a higher high. After which the prices drop below the previous swing low and creates a new swing low point.
Prices then move higher once again creating the peak within the structure. Following that, the price action moves lower, but does not take out the previous swing low point. Prices resume higher once again, and settle below the peak point reached earlier. The price again falls, and it stays above the prior swing low point.
Once this price action completes, we can draw four fairly equal sized trendlines that connect the swing highs at the top of the structure, and the swing lows at the bottom of the structure. This creates a diamond shaped appearance which is where the pattern gets its name from.
Sometimes, we may not see each and every up and down price leg noted earlier within the pure definition of the diamond structure. This will not necessarily invalidate the labeling of the structure as a diamond pattern. What is most important is that we can plot four trendlines around the structure that are of relatively similar length.
Bearish Diamond Pattern
The bearish diamond pattern variety, also known as, a diamond top was described in the earlier section. Again the pattern can be seen as a series of up-and-down price swings that resemble the structure of the head and shoulders formation.
More specifically, the left shoulder and head will connect to form a trendline, the head and the right shoulder will connect to form a second trendline. This completes the trendlines for the upper section of the bearish diamond formation. Then, for the lower portion, we would connect the swing lows within the troughs which will form a V shape.
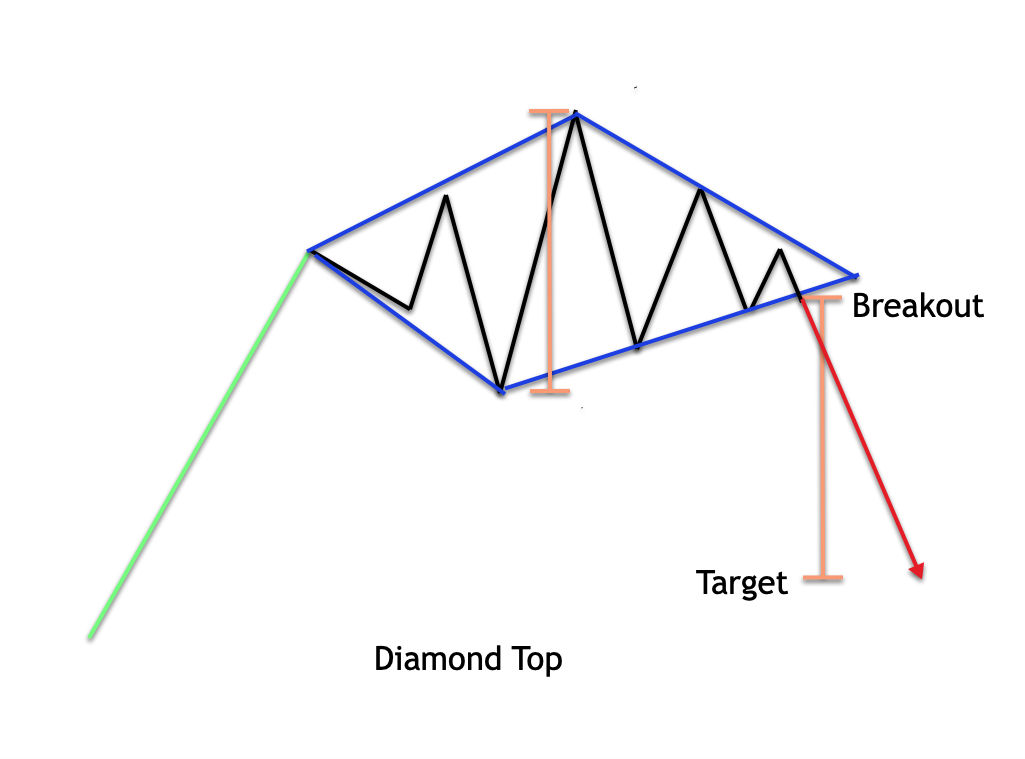
Referring to the illustration above, we can see the bearish diamond pattern once again. Additionally on this diagram we have shown the breakout entry signal for trading the structure, along with the target level for the pattern. As for the short entry signal, that would be triggered at the break and close below the lower right-hand line sloping upward.
Some traders prefer to wait for just the breakout below this line without the requirement for a close below it. This is a viable entry point as well, however, keep in mind that it will lead to more false signals as compared to waiting for the breakout and close condition.
The price target for the structure is calculated using a measured move technique. More specifically, we want to measure the peak to valley distance within the structure, and then project that distance downward from the breakout point. This will provide a level at which we can expect the follow-through on the breakout to begin to subside or potentially reverse. As such, it represents an excellent take profit level and trade exit.
Bullish Diamond Pattern
Let’s now look at the inverse of the bearish diamond pattern, which is the bullish diamond pattern. A bullish diamond pattern variety, also referred to as a diamond bottom, occurs in the context of a downtrend. Typically we will see a strong price move lower, and then a consolidation phase that carves out the up and down swing points of the diamond bottom.
In this case, the appearance will be similar to the inverted head and shoulders formation. We will connect the peaks and troughs within the structure in a similar manner as described earlier. Once we have drawn the four trendlines around the structure, and can confirm that the four lines are fairly equivalent in size, we will be able to validate the structure as bullish diamond pattern.
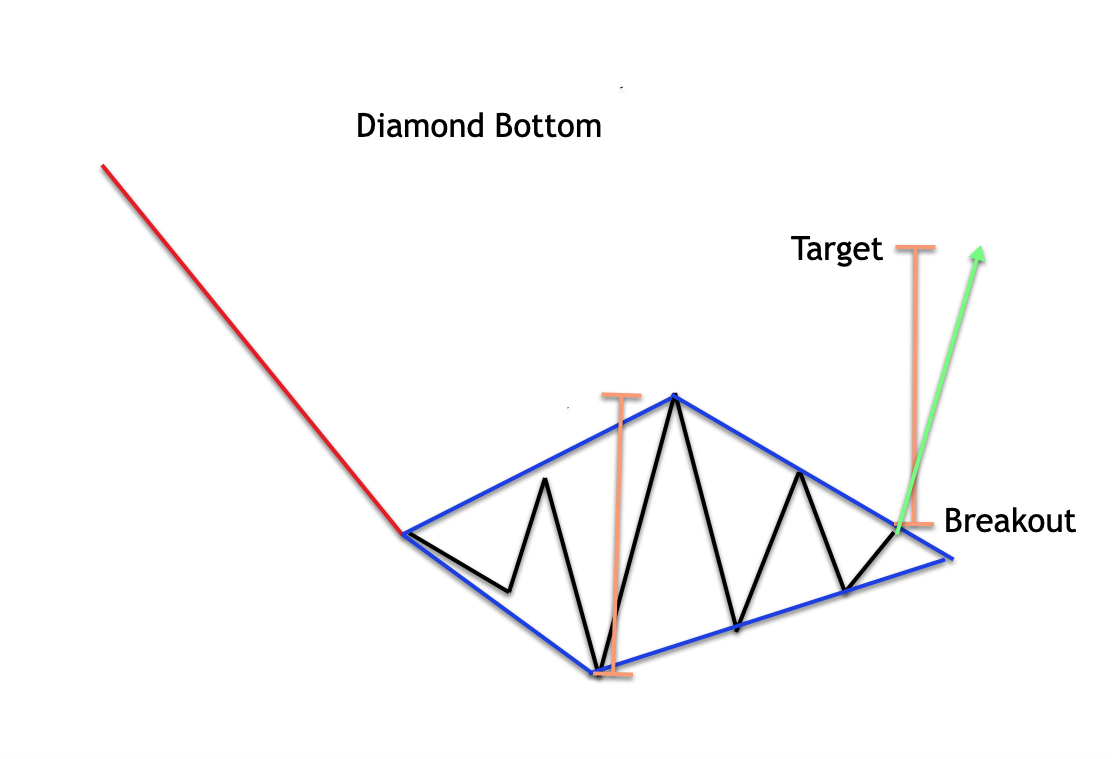
Looking at the illustration above of the diamond bottom, we can see that the formation is preceded by a downward price move. We can then see the up down sequence within the diamond structure which is outlined by the two upper trendlines pointing downward, and the two lower trendlines pointing upward.
The long entry signal is triggered at the break and close above the upper right-hand line sloping downward. Again, the preferred method would be to wait for an actual breakout and close rather than just a breakout above this trendline in order to prevent the occurrence of false signals and potential whipsawing price action around this area.
We would calculate the upper price target by measuring the high to low within the enclosed structure. Once we have that distance calculated and plotted on the chart, we would extend that same distance from the breakout point projected upward to arrive at the preferred target level. Once price reaches this level we should consider exiting the entire position or at least a large portion of it, and possibly leave a smaller portion open if desired.
Diamond Pattern Trading Strategy
Let’s now shift our focus to creating a trading strategy that incorporates the diamond pattern. We have seen that the diamond technical formation occurs both in the context of an uptrend and a downtrend. When a bullish price move precedes the diamond pattern it is called a diamond top and which has a bearish implication. When a bearish price move precedes the diamond pattern is called a diamond bottom which has a bullish implication.
In this particular diamond trading strategy, we will attempt to keep it as simple as possible by utilizing a pure price action-based approach. We know that the diamond pattern is one that does not occur very often in the market. As such we do not want to put too many variables into the strategy which would filter out an otherwise good set up.
Here are the rules for trading the diamond top chart pattern.
A clear uptrend must be in place prior to the diamond top formation.
The diamond top formation should be clearly defined with four trendlines that connect to each other, and which are relatively close in length to one another.
Enter a sell order at the market upon a break and close below the upward sloping trendline near the completion of the pattern.
The stoploss should be placed at the most recent swing high preceding the breakout point.
The target level will be calculated based on a measured move calculation. We will measure the distance between highest high and lowest low within the structure, and project that downward from the breakout point. This projected level will act as the profit exit point.
There will be an additional time stop component on the trade. Specifically, if after the passing of 50 candles, the price has not triggered either our stoploss or target level, we will immediately exit the trade at the market.
Here are the rules for trading the diamond bottom chart pattern.
A clear downtrend must be in place prior to the diamond bottom formation.
The diamond bottom formation should be clearly defined with four trendlines that connect to each other, and which are relatively close in length to one another.
Enter a buy order at the market upon a break and close above the downward sloping trendline near the completion of the pattern.
The stoploss should be placed at the most recent swing low preceding the breakout point.
The target level will be calculated based on a measured move calculation. We will measure the distance between highest high and lowest low within the structure, and a project that upward from the breakout point. This projected level will act as the profit exit point.
There will be an additional time stop component on the trade. Specifically, if after the passing of 50 candles, the price is not triggered either or stoploss or target level, we will immediately exit the trade at the market.
Diamond Trade Setup In EURCAD
We’ll now look at an example of the diamond pattern in the Forex market. This example of the diamond top trade set up is based on our previously outlined strategy and will be shown on EURCAD cross currency pair. Below you’ll find the price chart for the EURAD pair based on the eight hour trading timeframe.
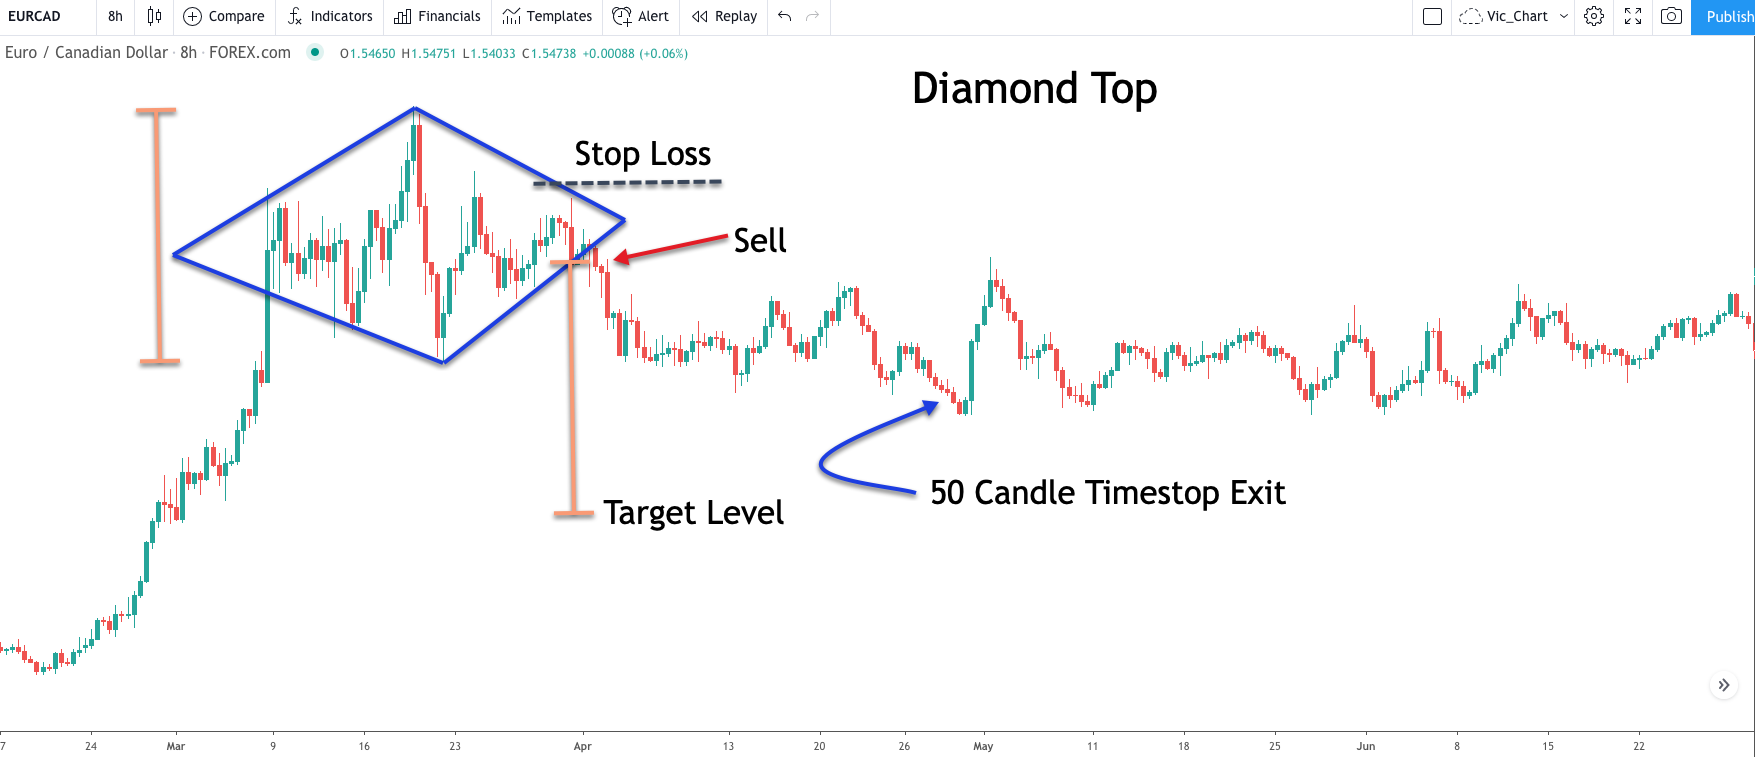
As we’re well aware, our diamond strategy is based on a pure price action analysis. As such we will need to monitor the price closely for potential signs of an emerging diamond chart formation. If we look at the EURCAD price chart again, we can see the diamond top pattern outlined. Notice how the diamond formation starts with prices making a swing low, and then making a higher high, followed by another swing low, followed by another swing high, and finally the last swing low before the breakout.
Notice how the two lines connecting the swing highs, and the two lines connecting the swing lows are of relatively similar lengths. This provides us with confirmation that this is indeed a symmetrical diamond top pattern, worthy of further consideration.
Now that we have labeled the structure as a diamond formation, we must ensure that there is a clear uptrend preceding this diamond top formation. As we can see from the price action leading up to the diamond top, there was a strong and consistent uptrend present in the market. This confirms our trend requirement per our outlined strategy. And with that we can make preparations for a potential short trade.
If you look closely at the price chart you can see where that breakout and close occurs to the downside. This is also shown by the red arrow noted as Sell. Once this sell entry order was executed, we would turn our attention to the stoploss and take profit level. The stoploss would be placed at the recent swing high prior to the breakout point. You can see that noted on the price chart above the sell trigger.
The target level is calculated using a measured move technique. That is to say that the price move following the breakout from this structure should be at least the length of the entire structured measure from peak to valley. That distance is represented by the orange vertical bracket shown to the left of the diamond top chart formation. The second bracket represents an equal length to the first bracket measured from the breakout point. You can see where the target level rests based on this measured move target technique.
You will note that after the breakout there was some follow-through to the downside, however, the bearish momentum fizzled out, and the price began to trade in a sideways manner forming a long horizontal consolidation structure.
But based on our strategy rules, we would not have had to endure this extended consolidation phase. This is because our diamond trading strategy incorporates a 50 candle time stop. You can see where that time stop would have triggered taking us out of the position entirely. Though the price did not reach our intended target, we would’ve still booked a profit on the trade.
Diamond Pattern Signal In USDJPY
We will now illustrate an example of the bullish diamond bottom pattern. For example, we will be looking at the daily chart of the US Dollar to the Japanese Yen forex pair.
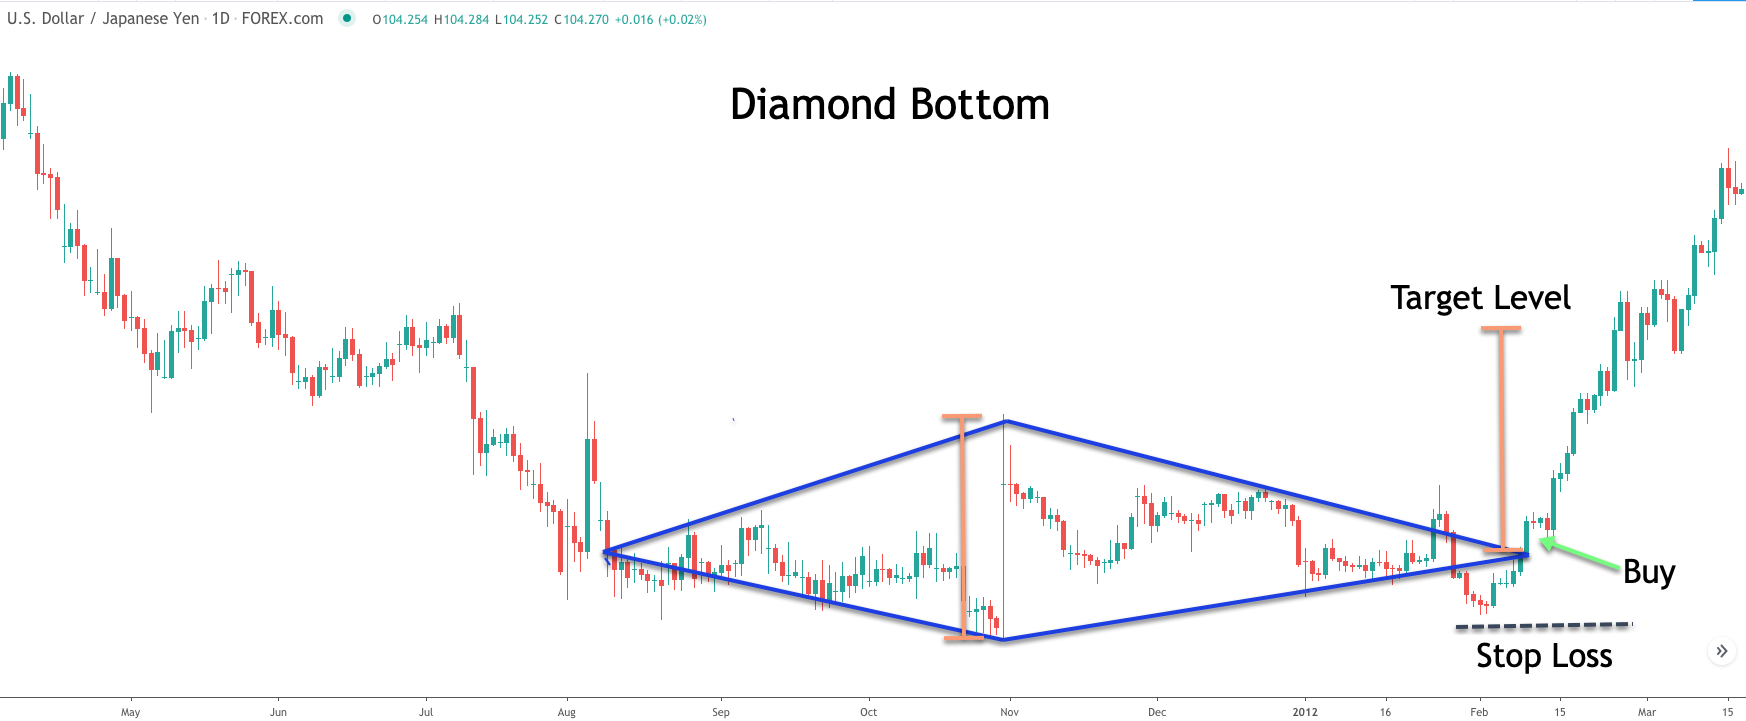
If we look at the lower part of this price chart, we can see the forex diamond pattern outlined by four trendlines. Notice how the center of the diamond bottom formation has the longest length within the formation. We can see the two swing high points that connect each of the two upper sections of the diamond bottom formation. Similarly we can see the two swing low points that connect each of the two bottom sections of the diamond bottom formation. This overall structure resembles a diamond appearance, and each of the four trendlines containing the price action within the pattern are of relatively similar length.
Now that we have properly classified this as a diamond formation, let’s now dissect the other aspects of this potential trading opportunity. We know that based on our strategy rules, the diamond bottom pattern should be preceded by a clear downtrend. Referring to the price chart once again, we can see that this condition was met. The prices were moving lower in a nice stairstep manner prior to the formation of the diamond bottom.
At this point, we could move forward with preparing for a potential long trading opportunity. If you look closely at the trendline that acts as our signal line, you will note that there was initially a false breakout to the upside. This then led to the price action breaching the lower right-hand trendline temporarily, but then the prices recovered and the second breakout opportunity provided us another buy entry. As soon as this buy order was executed, we would have placed a stop loss at the most recent swing low preceding this breakout.
The price target would be measured using the measured move method. We would calculate the peak to valley length within the diamond bottom formation and then project that upward from the breakout point. The left vertical bracket represents the high low of the diamond bottom formation, and the right vertical bracket shows that projection from the breakout point. As we can see, the target was reached quite easily, and occurred prior to our 50 candle time stop exit. As such would have been able to capture the entire price move from the entry to the target level.
Summary
We have learned that the diamond pattern can have both a bullish and bearish implications. A bullish diamond pattern is often referred to as a diamond bottom, while a bearish diamond pattern is often referred to as a diamond top.
Diamond reversal patterns are seen across all different types of financial markets including the stock market, forex market, crypto market, and futures markets. The diamond pattern is not seen as often as many other classical chart patterns. However, it is important that you understand the pattern and are able to recognize it, because when it does occur, it can provide for an excellent trading opportunity.
Based on backtesting we have found that the diamond top pattern which occurs after a rise in market prices tends to provide for a higher probability trade set up then the diamond bottom pattern which occurs after a decline in market prices. You will need to do your own testing to see if this tendency aligns with the markets you trade.