Forex trading is gaining greater and greater popularity every single day. Traders use different analysis techniques to identify potential price moves and tradable opportunities. Forex analysis includes the study of different on-chart patterns, which contain price information. One of the most popular pattern groups are the Japanese candlestick patterns, of which the Harami formation is apart of. This article is a full guide to understanding and trading the Harami candlestick pattern.
Forex Candlestick Patterns
Candlestick patterns are on-chart formations within Japanese candlestick charts. A candlestick pattern can involve one candle or multiple candles. Each of these pattern setups gives clues to the trader whether the price might increase or decrease. Furthermore, most candle patterns will also suggest an entry point on the chart, as well as where to place a stop loss order. Knowing the important candlestick patterns will increase your probability of winning in trading.
Harami Candlestick Pattern
The Harami formation is a reversal candlestick pattern that consists of two candles. The name of the Harami pattern comes from the fact that it resembles a pregnant belly and “Harami” means “pregnant” in Japanese.
If the price is trending in a certain direction, a Harami pattern is an indication that the trend is probably exhausted and we might be seeing a reversal soon.
Structure of the Harami Formation
As we said, the Harami is a two-candle formation:
First Harami Candle – This is the bigger candlestick. Its body should fully engulf the body of the second candle.
Second Harami Candle – This is the smaller candle. Its body is fully engulfed by the body of the first candle.
Types of Harami Candle Patterns
We identify a bearish and a bullish reversal Harami candlestick pattern, based on the two candles being bullish and bearish or bearish and bullish.
Bullish Harami Pattern
The bullish Harami appears at the end of bearish trends. It starts with a longer bearish candle, which fully engulfs the body of a following bullish candle. The bullish Harami candlestick indicates that this might be the end of the bearish trend. In this relation, traders expect an upcoming bullish activity after the confirmation of the pattern. Thus, traders like to approach the bullish Harami setup with long trades.
Bearish Harami Pattern
The bearish Harami pattern has the opposite setup and functions compared to the bullish Harami. A bearish Harami usually appears at the end of bullish trends and indicates a possible upcoming reversal. A bearish Harami starts with a long bullish candle and continues with a smaller bearish candle, with is fully engulfed by the first candle. The confirmation of the pattern implies that the bullish trend is exhausted and that a bearish activity might be on its way. Traders like to position into the bearish Harami candlestick pattern by opening short trades for catching a potential price decrease.
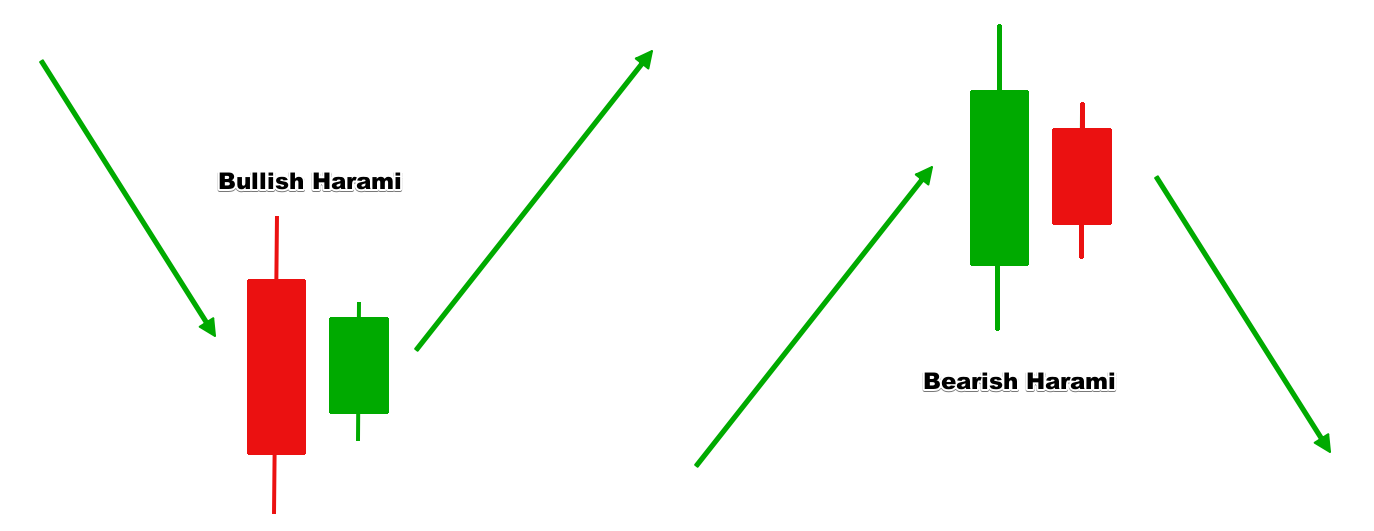
This sketch briefly explains the structure of the two Harami reversal patterns. We added the arrows to outline the previous price direction and the expected outcome. It is important to remember which Harami pattern applies where.
How to Approach the Harami Trading Pattern
It is not enough only to know the Japanese Harami candlestick pattern structure in order to trade it successfully. There are specific success rules that apply to every Harami pattern indicator. Following these rules is likely to give you a better success rate in your Forex Harami patterns.
Entry Techniques with the Forex Harami Patterns
Entering a Harami candlestick pattern trade might be tricky. The reason for this is the confirmation of the pattern. Not every Harami pattern on the chart is confirmed. Here is why. Having the two Harami candles on the chart are enough to say “Hey, this is a Harami pattern!” However, to confirm the reversal power of the pattern, you will need an extra candle – the one that comes afterward.
If the third candle is in the direction of the Harami pattern and closes beyond the level of the second candle, you are good to go and you can enter the market in the respective direction.
Entering a Bearish Harami Trade
You have a bearish Harami pattern on the chart: A longer bullish candle during a bullish trend and a second smaller bearish candle – fully engulfed by the body of the first candle.
Here you should sell if a third bearish candle appears afterward and if it closes below the close of the previous bearish candle.
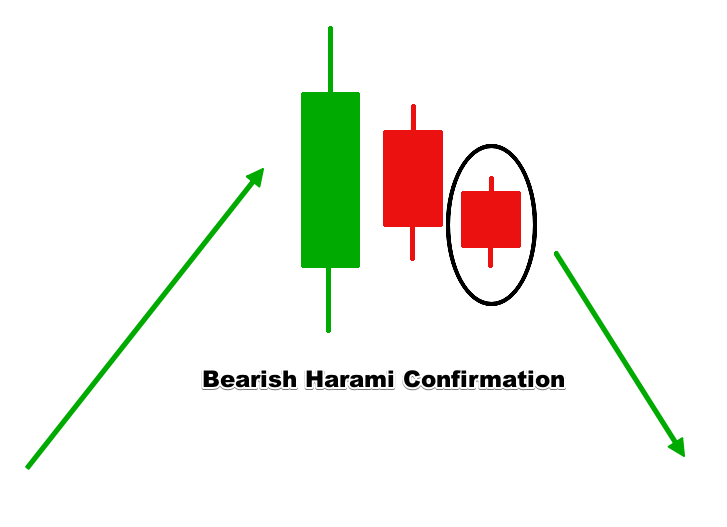
This is how the confirmation candle will look during a bearish Harami pattern. The appearance of the third candle will give us enough confidence to enter the market with a short trade.
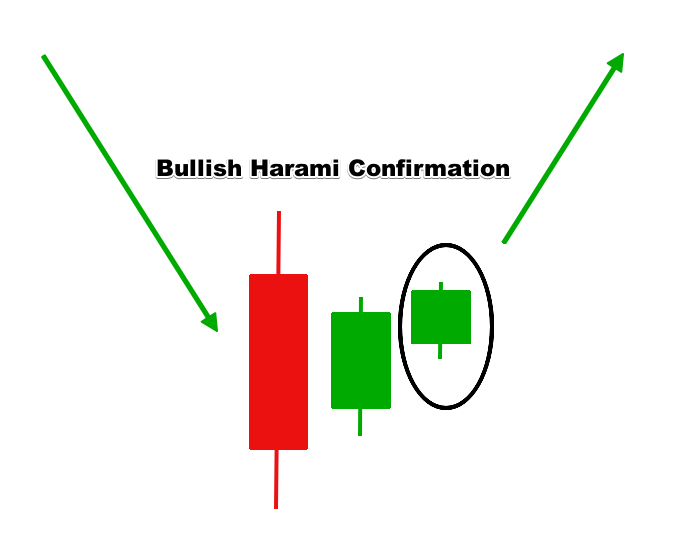
Entering a Bullish Harami Trade
The entry of a bullish Harami trade looks the opposite. In this case, we have a longer bearish candle during a bearish trend and a second bullish candle that is smaller and fully engulfed by the previous candle. The confirmation will come if we get a third bullish candle that closes above the close of the previous bullish candle.
Stop Loss when Trading the Harami Formation
Forex Harami patterns like every other pattern will never give you a 100% success rate. Some of your Harami trades will end up losing. Therefore, you should secure every Harami trade with a Stop Loss order for limiting the potential loss.
If you trade a bearish Harami pattern, you should place your Stop Loss above highest point of the first Harami candlestick – the longer bullish candle.
If you trade a bullish Harami pattern, your Stop Loss order should go below lowest point of the first Harami candlestick – the longer bearish candle.
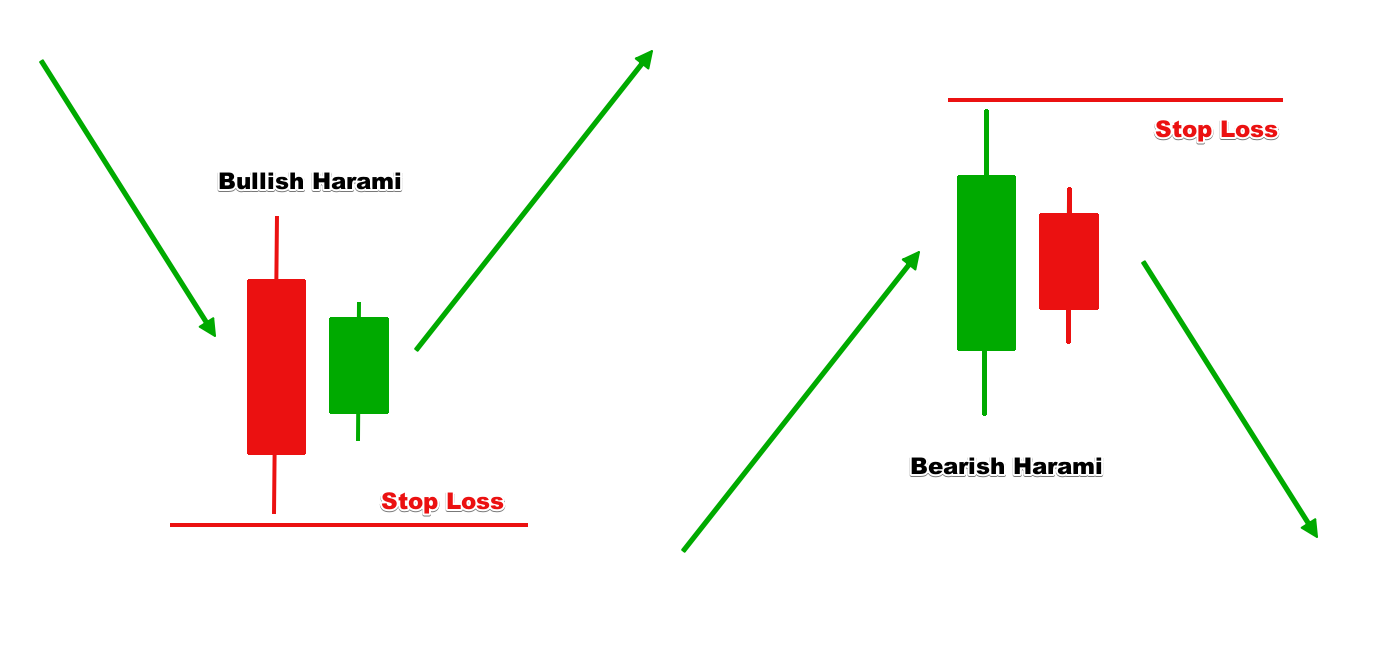
So, with the case of bullish Harami candlestick pattern, the Stop Loss order should lay below the lower candlewick of the first candle, which in this case is bearish.
If it is about a bearish Harami setup, then you should place your Stop Loss order above the upper candlewick of the first candle – a bullish one in this case.
Take Profit with the Harami Candlestick Setup
There are certain Take Profit rules when trading the Harami pattern. You take the size of the pattern and apply it in the direction of your trade. This is the minimum potential you should expect during a Harami trade.
You measure the size of the Harami pattern by taking the distance between the open and the close of the first candle (the longer one). This general rule can be used only if your trade relies solely on the Harami pattern indicator on the chart. And this is rarely the case. Usually, it is better to combine the Harami pattern with an extra indicator for getting a better probability and aiming for higher targets.
Harami Trading Strategy with Price Action
The Harami candlestick setup is a specific price action event. The following example will show you how you can combine the Harami setup with extra price action setups. Furthermore, you will see how price action signals will give you extended targets and higher potential overall.
- We will open our trade based on Harami pattern confirmation.
- We will stay in the trade for a minimum target equal to the size of the Harami setup, but will hold the trade further if the price action lets us.
- We will apply a Stop Loss order beyond the candlewick at the closing side of the first Harami candle.
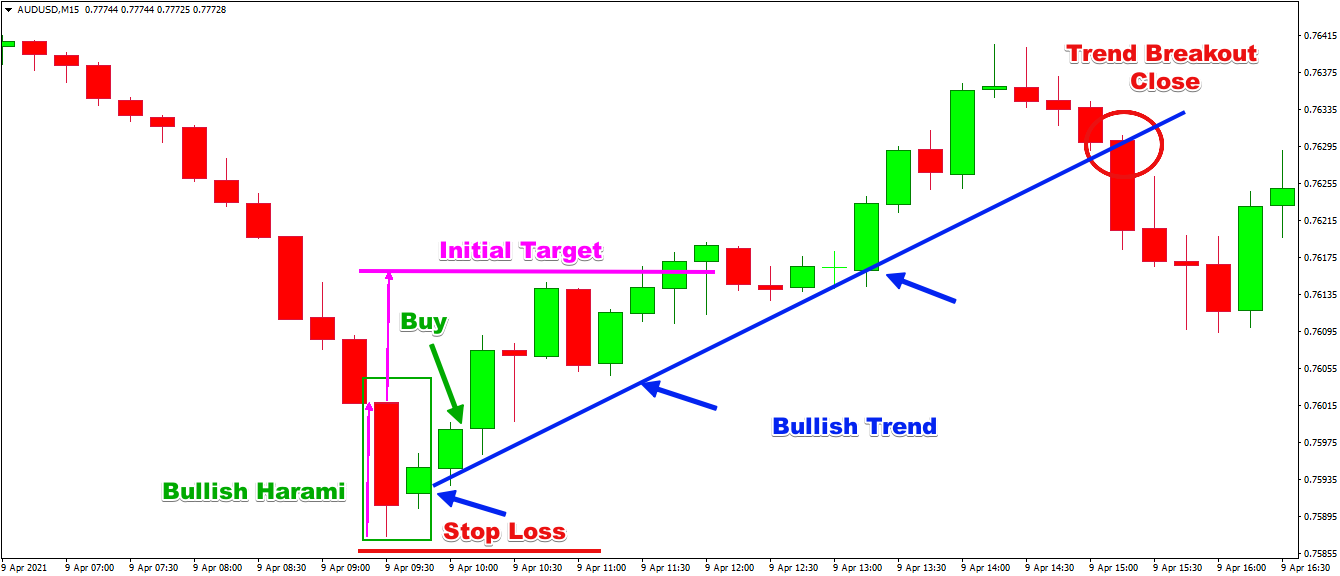
Above you will see the 15-minute chart of the AUD/USD Forex pair, also known as the Aussie. The chart contains the price action on April 9, 2021 and has no on-chart indicators. We will rely solely on price action here.
The chart starts with a sharp bearish trend. Notice that the bearish candles become bigger and bigger with the progress of the price decrease. The exponentiality here implies that a pullback might be coming.
Suddenly, a bullish Harami pattern occurs on the chart. The body of the second candle is fully engulfed by the first candle. Furthermore, this is the first bullish candle for 12 periods. The next candle is also bullish and it confirms the validity of the bullish Harami setup. These are two consecutive bullish candles after 12 bearish candles in a row. This should mean something, right?
We open a long trade at the Harami confirmation and we place a Stop Loss order below the lower candlewick of the first Harami candle. Initially, we aim for a price move equal to the size of the pattern. You can see this target level in pink on the image above. However, after accounting for two higher bottoms on the chart (first two blue arrows), we realize that this might be the beginning of a fresh bullish trend. We don’t want to miss this opportunity, right? The price action is telling us to ignore the initial target here.
Not long after we see that the price action forms a third bottom, which confirms the presence of a bullish trend – the blue line on the chart. We see a third bullish impulse right after this bottom.
After the top of this impulse, we see three consecutive bearish candles. This is something that hasn’t happened on the chart since we were looking at the bearish run before the occurrence of the bullish Harami formation. We can take this as the first indication that this trend might be ending.
The other more obvious signal comes when the price actually breaks the blue trend line in bearish direction. That’s a close! Unfortunately, this closing candle is a bit long and is very likely to eat a big part of your already gained profit.
Anyway, this doesn’t mean that your decision is wrong. It is just that you cannot guess the best possible scenarios in Forex trading. The trade is profitable after all, right? And it brings 22 pips or 0.29% for only 5 hours.
And if you had chosen to exit the market right after the three consecutive bearish candles, missing the big drop through the blue trend line, you would have kept most of your open profit. In this case, the trade would have brought 31 pips or 0.49% profit for less than 5 hours.
Harami Trading Pattern with an Oscillator
Another good Harami trading strategy involves an oscillator indicator. The reason for this is that oscillators will often give you a signal in advance.
A Harami pattern is not very likely to put you in a long-term trade. The same applies for most of the oscillators. That is why this Harami pattern strategy is so well synchronized. Let’s try it out with the Stochastic Oscillator.
Trading Rules:
- We will enter the market on Harami pattern confirmation + an overbought/oversold or divergence signal from the Stochastic Oscillator.
- We will stay in the trade for a minimum target equal to the size of the Harami pattern, but will keep the trade longer until we see an opposite signal from the Stochastic.
- We will apply a Stop Loss order beyond the candlewick at the closing side of the first Harami candle.
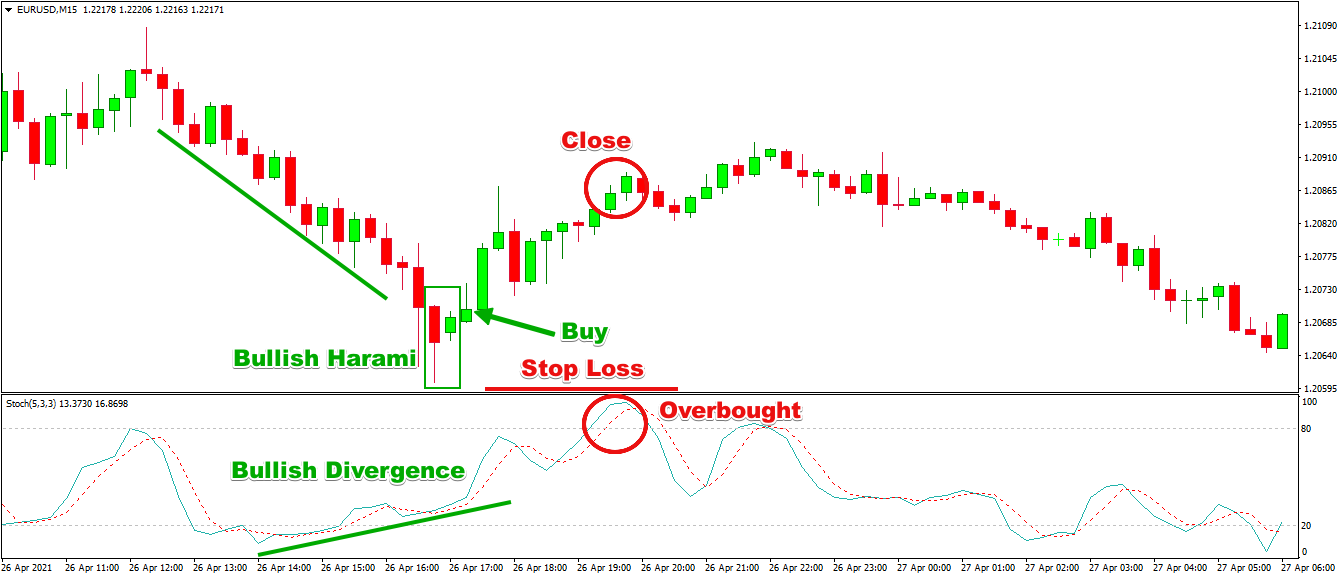
This time we are looking at the 15-minute chart of the EUR/USD for April 26-27, 2021. The image reveals a bullish Harami trade. At the bottom of the chart, we have the Stochastic Oscillator attached.
The situation begins with a consistent bearish trend. Suddenly, the Stochastic Oscillator starts increasing, while the price keeps decreasing. As such we confirm a bullish divergence between the price action and the Stochastic, which is a long setup signal.
Suddenly, the price action prints a Harami chart pattern, which you can see in the green rectangle. The candle that comes afterward is bullish and closes above the second Harami candle. This is the confirmation of the Harami setup.
Now, we can enter the market based on a bullish divergence from the Stochastic Oscillator, combined with a bullish Harami pattern.
The red horizontal line on the chart marks the right place for your Stop Loss order in this case – right below the lower candlewick of the first Harami candle.
The price of the EUR/USD starts increasing afterwards. The next eight out of ten candles are bullish.
Ten periods later, the Stochastic Oscillator enters the overbought zone, giving us a signal that this bullish impulse might be exhausted. According to our strategy, this is where we need to exit the trade, collecting the profit.
This trade brings a profit equal to 18 pips or approximately 0.15%. Although this is not a big amount, we should admit that this is a day trade, which took only a little more than 2 hour. Trades like this are actually, what scalpers and day traders in general are looking for.
Conclusion
- Candlestick patterns are an essential form of Forex technical analysis.
- One of the most common candlestick setups in Forex trading is the Harami pattern.
- The Harami formation is a two-candle pattern, where the first one is opposite to the second one and fully engulfs it.
- There are two types of Harami reversal patterns:
- Bullish Harami patterns typically appear at the end of bearish trends. They start with a longer bearish candle, whose body fully engulfs the body a second smaller bullish candle.
- Bearish Harami patterns typically appear at the end of bullish trends. They start with a longer bullish candle, whose body fully engulfs the body a second smaller bearish candle.
- Harami candlestick pattern trading rules:
- Open your trades upon Harami confirmation – a third candle, which is in the direction of the reversal and closes beyond the close of the second candle.
- Place a Stop Loss order beyond the candlewick at the closing side of the first Harami candle.
- Hold the trade for a minimum price move equal to the size of the pattern – the length of the first Harami candlestick.
- Harami patterns combines well with price action:
- Enter the trade based on a confirmation from a Harami pattern.
- Place a Stop Loss order at the opposite side of the pattern – beyond the close of the first candle.
- Hold the trade aiming for at least the size of the pattern or further if the price action supports it.
- Oscillators like the Stochastic are also of great help when trading Forex Harami patterns:
- Enter the market on a Harami confirmation supported by a signal from the oscillator.
- Place a Stop Loss order at the opposite side of the pattern – beyond the close of the first candle.
- Hold the trade for at least the size of the pattern or further if the oscillator supports this idea.