Experienced traders know that the first 15 to 30 minutes of trading can often predict the tone of the market, and as such, it’s important to watch the price action during the early session closely. There are various trading techniques that are built around trading the opening range, and most of these are based on a breakout methodology. We will review everything you need to know about trading the opening range and the best markets to apply it to.
What Is The Opening Range?
The opening range is defined as the high low price range of a given trading instrument based on a specified opening range time period. Typically, the most popular time intervals used for the opening range is the 5 minute, 15 minute, and 30 minute time frames.
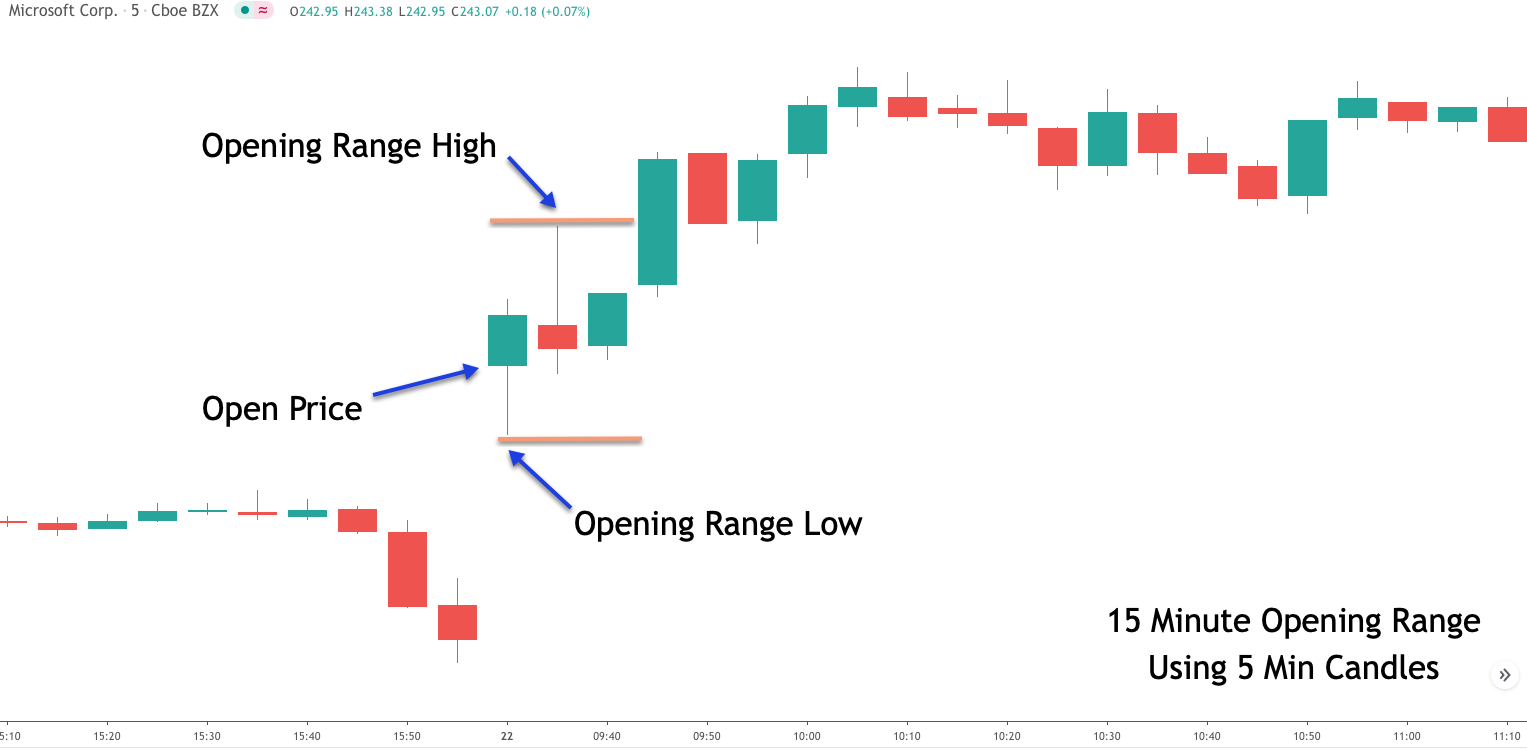
And so for example, if you are defining and trading the 15 minute opening range of a particular stock XYZ, then what that means is that you are evaluating the high low range of stock XYZ from the opening bell to 15 minutes following the opening bell. Within this opening range, the two most important levels that you would be watching would be the high and low price within the first 15 minutes. Below you can see an example of a 15 minute opening range for MSFT stock using 5 minute bars.
The opening range analysis method tends to work best on markets that have a clearly defined closing time and opening time. For example within the US equities market, the opening bell, which marks the official start of the trading session occurs that 9:30 AM Eastern. And the closing bell, which marks the official end of the trading session occurs at 4 PM Eastern. As such the US stock market has a clearly defined closing time and opening time, making it a good venue for applying opening range trading techniques.
Opening range analysis can also be applied to markets that trade continuously during the day, but wherein the majority of the market volume occurs during one particular trading session. A good example of this would be the E-mini stock index futures markets, particularly the E-mini S&P, the E-mini Dow, and the E-mini NASDAQ futures.
When applying opening range market analysis, it’s imperative that you use the local opening for a specified market instrument, regardless of the actual opening and closing times that may be set by an exchange.
For example, if you were to analyze the opening range for the Japanese Nikkei Index, you will want to make sure to use the official Japanese equity market open time for calculating the start of your opening range. Although this may seem obvious to some, applying the wrong opening time is one of the most common mistakes that beginning traders make when incorporating opening range strategies.
Importance of the Open
Now that you understand what the opening range is, and the proper way in determining the open for any specified market instrument, let’s now discuss the importance of the opening price and range. The open holds a special significance within the market and is widely watched by experienced traders and investors.
The opening price will generally set the tone for the trading session, as traders are attempting to find fair value. Additionally, the opening price goes beyond providing value in terms of what the sentiment is in the market. That is to say that there is a very important statistical significance as it relates to the opening price.
Statistically speaking, there is a strong tendency for the opening price to be the high or low of the trading session. This is extremely valuable information that many traders ignore or are unaware of altogether. If we know that the open will have a likelihood of either being the high or low on the day, or very near the high or low of the day, then we can construct opening range trading methodologies around that historical tendency.
And so, it is without question that the opening price is the most important piece of data for short-term traders, particularly day traders seeking to extract a reliable edge from trading the intraday session.
Within the equities market, most of the earnings reports, FDA announcements, and market moving information is released after the market close. As such, the open provides us the first hint of how traders and investors are digesting a specific news announcement. We can use that information from the open to guide us and make informed trading decisions through the day’s trading session.
There are many opportunities for outsized gains during the early session, but traders should be aware of the heightened volatility and risk that can accompany strategies that revolve around trading the open. As such, traders should have a solid risk management plan if they are interested in participating in the market during this time.
History of Opening Range Breakouts
Let’s not take a moment to describe what we mean by an opening range breakout. An opening range breakout is a strategy that attempts to buy above the high of a predefined opening range, or attempts to sell below the low of a predefined opening range.
For example, if we utilize a 30 minute time window after the open as our opening range, then we would plot a resistance level at the high within that 30 minute time span, and plot a support level at the low within that 30 minute time span. A very simple entry strategy could call for a long signal upon the price moving above the upper resistance boundary. Similarly, a short signal could occur upon the price moving below the lower support boundary.
The opening range breakout has a long history in the financial markets. There have been many technical analysts and professional traders that have done work in this area, and introduced various themes for the opening range breakout strategy. Three of the more well-known technicians who have done research into ORB breakouts include Sheldon Knight, Larry Williams, and Toby Crabel. Each of them has put their own twist on the opening range breakout methodology.
Toby Crabel has contributed the most in this area of technical analysis, and wrote an excellent book on the subject entitled “Day Trading With Short-Term Price Patterns And Opening Range Breakout”. The book was published in 1990, and is considered the Bible on the opening range breakout technique. The book is currently out of print, and often sells for more than $500-$700 when it does become available by a private seller.
Crabel’s book provides an in-depth analysis on trading the opening range breakout in various futures markets. In it he outlines detailed statistical analysis on various breakout triggers and incorporated opening range breakout signals with some very specific bar structures, such as the NR4 pattern, the NR7 pattern, and Inside Day pattern. Although the book is quite dated, there are lots of valuable nuggets in it that can be adapted to today’s market as well. Any serious opening range breakout trader would be well served by reading it from cover to cover.
Best Markets To Trade Opening Range
So what are the best markets for trading the opening range breakout? Well, as we’ve alluded to earlier the one condition that we like to see when applying opening range breakout strategies is for a market to have a distinct opening and closing time. These days, with electronic trading, many markets trade almost 24 hours a day on weekdays. This can make it more difficult to successfully apply opening range techniques.
Having said that, it’s important to understand that even though some markets do in fact trade round-the-clock, the volume traded in the overnight sessions tends to be quite thin. As a result, this overnight activity accounts for only a small percentage of trading that occurs during the normal session. As such, these types of instruments would still make for viable opportunities for trading the opening range strategy.
Some markets that are good candidates for opening range breakout strategies include the US stock market and certain futures markets. Individual stocks work well with opening range strategies particularly when there is a catalyst event prior to the opening bell such as an earnings report or FDA announcement. Additionally, certain futures markets are also good candidates for opening range strategies. This includes the stock index futures markets, the financial futures markets, and the commodity futures markets.
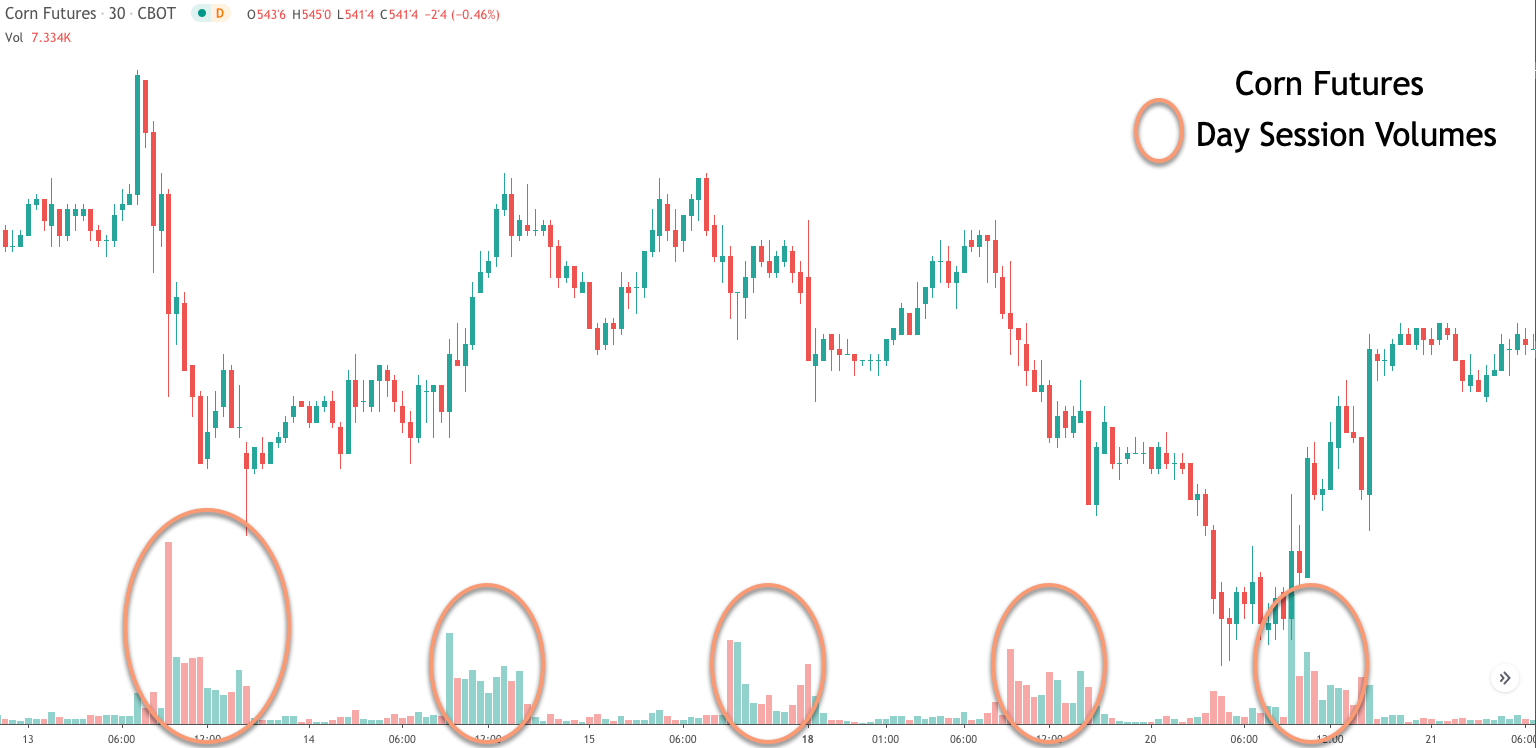
An excellent market for incorporating opening range breakout techniques is the agricultural futures market. This includes corn futures, soybean futures, and wheat futures. These markets are extremely liquid and have short trading sessions during the day, and the majority of the volume within these markets is seen within the day session.
Below you can see an example of the corn futures market volume for the day session compared to after-hours activity.
One market that is not ideal for trading opening range strategies is the Forex market. This is because the Forex market trades round-the-clock. Although, there are some volume tips during certain sessions, for the most part, there is relatively strong volume of trading in each of the major currency pairs throughout the day, as the market moves from one money center to the next.
Opening Range Breakout Trading Strategy
As we learned so far, the opening range signifies an important time within the markets wherein the buyers and sellers are going head-to-head in the earliest part of the session to determine which group may ultimately take control. There are many different strategies for employing the opening range breakout.
While some traders utilize a break from the opening range as an entry signal, others may use that information to build a directional bias for the remainder of the trading session. As such, there is no single method for incorporating ORB breakouts into your trading program. Having said that, simple ORB breakouts can provide for excellent trading opportunities for intraday traders.
Let’s illustrate a strategy for trading the opening range breakout as it relates to individual stocks. This strategy can be traded using any liquid stock.
Here are the rules for a long trade using the opening range trade set:
- The prior three days of trading activity should exhibit consolidation price behavior with a relatively narrow trading range.
- There should be a relatively sizable gap up open on the fourth day.
- We will wait for the 30 minute opening range and take note of the high and low of this opening range.
- When the price trades above the high of the opening range, we will enter an order to buy.
- The stop loss will be placed below the low of the opening range.
- We will hold the position through the day session and utilize an exit at the close.
Here are the rules for a short trade using the opening range trade set:
- The prior three days of trading activity should exhibit consolidation price behavior with a relatively narrow trading range.
- There should be a relatively sizable gap down open on the fourth day.
- We will wait for the 30 minute opening range and take note of the high and low of this opening range.
- When the price trades below the low of the opening range, we will enter an order to sell.
- The stop loss will be placed above the high of the opening range.
- We will hold the position through the day session and utilize an exit at the close.
The logic behind the strategy is to catch a volatility breakout move following a period of consolidation and suppressed levels of volatility. Typically, low periods of volatility will lead to high periods of volatility and vice versa. As such, this opening range strategy takes advantage of this tendency and would be considered a volatility breakout method.
30 Minute Opening Range Breakout Example 1
Let’s look at a practical example of the previously outlined 30 minute opening range breakout strategy. Below you will find the price chart of Apple based on the 30 minute timeframe.
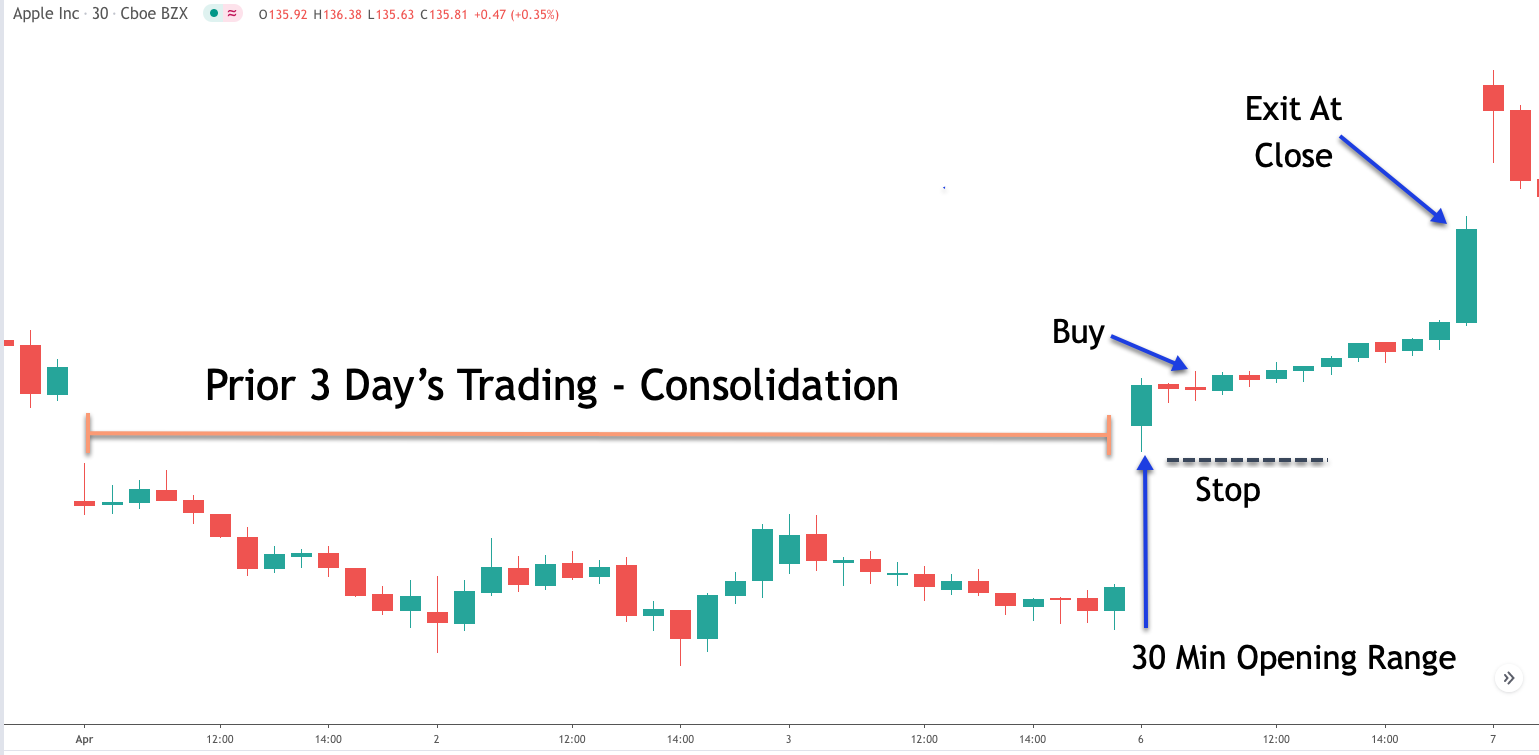
Looking at the far left of the price chart, we can see that the price began to move sideways and this consolidation phase lasted for three full days. Notice the tight range in the price of Apple during this time. We can say that the entire price movement progressed within a very narrow range.
As such, the stock was building up energy for the next price leg. Following the three days of range bound price behavior, the price of Apple opened up sharply higher and a very obvious gap up can be seen on the price chart. With these two primary conditions now being met, we can prepare for an opening range breakout trade.
Following the open at 9:30 AM Eastern, we would have monitored the price action closely within the first 30 minutes of trading, between 9:30 and 10:00. This would represent the 30 minute opening range that we would be interested in watching closely. At 10:31 AM we would mark the higher and low within this opening range, and wait for an upside breakout above the high of this range to enter into a long position.
On the price chart you can see the first bar after the gap up. This bar represents the 30 minute opening range. After this bar completes, the second bar is an inside bar which remains within the high low range of the initial opening range. The third bar however breaks above the high of the opening range, and as such, when this event occurs within the third bar, we would have been executed on our long position.
Once a long position has been executed, we would place our stop loss below the low of the 30 minute opening range as noted by the black dashed line below the buy trigger. Based on our strategy rules, we would hold the trade through the day session, and exit at the close. You can refer to the chart once again to see where we would have exited the position.
30 Minute Opening Range Breakout Example 2
Let’s now look at another chart example of our 30 minute opening range breakout strategy. In this example, we will be illustrating the strategy using the 30 minute chart of Facebook.
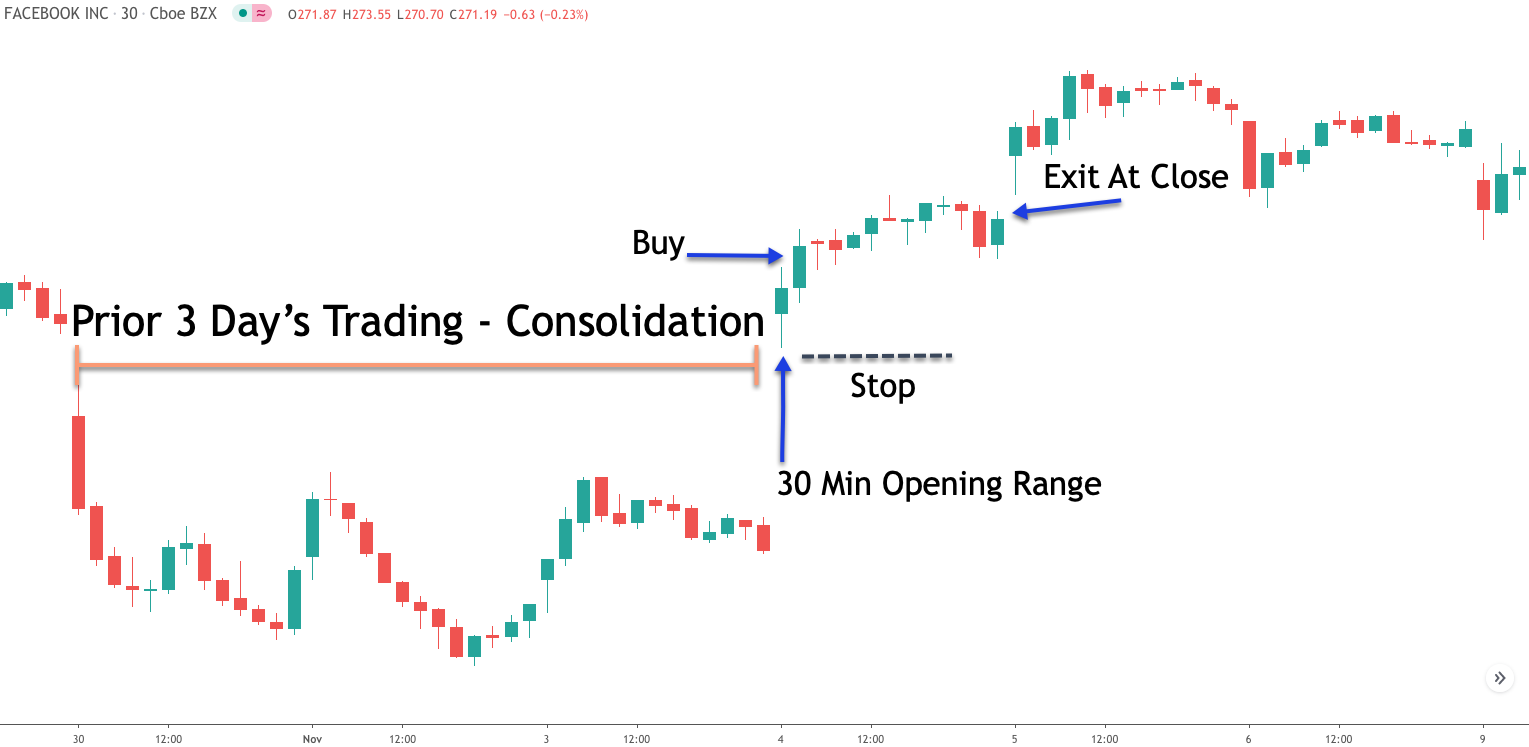
If we scroll our eyes over to the far left of this price chart, we can see that there was a sharp move lower, which then led to sideways price movement. This sideways price movement continued over three days of trading. We can see a clear upper resistance level within this range bound price behavior, and a clear lower support level within this range.
As such, we can say that the price of Facebook was trading within a low volatility environment during this time. We would expect that the buildup of energy within this consolidation phase would eventually erupt forcing prices directionally either up or down.
In this case, we can see that on the fourth day the price gapped up substantially higher from the previous day’s close. As such, all of the components of our opening range breakout strategy have aligned at this point, and we could prepare for a potential trading opportunity. We would want to watch the first 30 minutes of trading very carefully, and mark the high low range within this predefined opening range.
The moment that the price breaks above the high of this opening range, we would enter a position to go long. You can note the buy entry that occurred on the very next candle following the initial opening range. Once we were in the trade, we would want to protect our position by placing a stop loss below the low of the opening range as noted on the price chart. Our exit strategy calls for holding the position through the session and then liquidate it at the close. You will note the exit point by referring to the blue arrow noted as, Exit At Close.
Closing Thoughts
The opening range breakout is a tried-and-true day trading strategy that has stood the test of time. The strategy works best in markets where we can define a clear opening time and closing time for the market session. A lot has been written about the opening range strategy over the years, but the general premise remains the same. That is to say the opening range provides a trader with an early warning of potential supply and demand imbalances in the market, which can lead to a trend day.