Analysing the Forex markets, and broader financial markets in general, is an exciting and captivating endeavour that can be incredibly lucrative when done correctly. While the internet is full of weird and wonderful ways to analyse and trade the markets, in general there are two camps when it comes to trading the markets; fundamental and technical analysis.
Fundamental analysis broadly comprises analysing the markets based on economic and political inputs. Monitoring economic data releases is key to this method as is tracking central bank monetary policy. However, the truth is that trading in this manner can be very hit and miss. It is incredibly difficult to consistently gauge how the markets will react to data releases and even central bank announcements given the nuanced way in which the markets trade around fundamentals.
In reality, fundamental trading tends to be the domain of institutional traders given the complex algorithms they have which can track and react to these data inputs. For most retail traders, the most popular and effective way of trading the markets continues to be technical analysis.
At its purest level, technical analysis is simply the study of the price charts. Regardless of what is driving the price action, the technical analyst is merely concerned with how price is moving and identifying tradable patterns and outcomes. To do this, the technical analyst relies on a number of different analysis tools on their technical analysis charts. Of these, trading chart patterns are among the primary methods used.
What Are Technical Trading Patterns?
Forex trading chart patterns are price structures which have been established over time and studied and are identified as leading to tradable outcomes. These structures, when identified in the market, carry with them the weight of a potential tradable outcome such as a head and shoulders pattern leading to a bearish reversal (a decline in price) or a double bottom leading to a bullish reversal (a rally in price). As such, trading chart patterns in technical analysis is an incredibly simple yet effective way of trading the markets.
What Do Chart Patterns Tell Us?
Far from simply being some pretty decorations on your charts or random lines drawn in at will, correctly identified chart patterns reveal a great deal about the underlying order flow in the markets and give us hints about where price might head next. Armed with that information we are then able to make price forecasts and trading decisions.
So, let’s take a look at the top chart patterns, explain what they tell us about the markets and how we can trade them.
Top Trading Chart Patterns in Technical Analysis
Head & Shoulders Pattern (H&S)
The first chart pattern we will study can be considered the grandfather of forex trading chart patterns; the head and shoulders (H&S).
The H&S pattern is a bearish reversal pattern which alerts us to a potential reversal lower in price. The pattern is identified as follows (and hence the name).
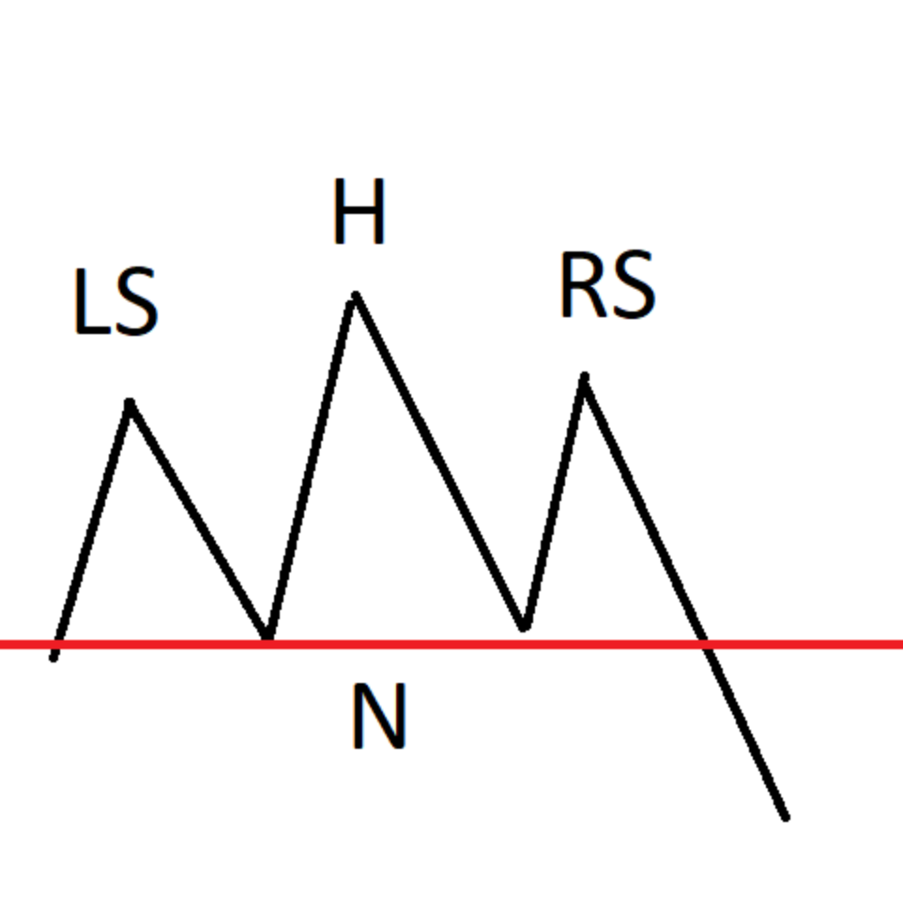
Firstly, we have an initial price high, giving us our left shoulder, we then have a higher peak in the middle, giving us, our head and we then have a lower peak, around the same level as the first, on the right giving us our right shoulder. The two low points in the pattern give us our neckline. That is the H&S pattern, very simple to spot!
So, what is this pattern telling us about the underlying order flow in the market? This pattern actually reveals a great deal about the underlying action between buyers and sellers. So, initially we see that buyers are in control, driving price higher to the first peak, the left shoulder. From here, sellers then step in and take price down. However, buyers step back in and in fuller force driving price back up above the initial peak to give us a new high, our head.
However, sellers step back in here and drive price firmly lower, all the way back down to what will become the neckline. From there, buyers then step in again and drive price back up. However, they are unable to make it past the point of the first peak. From here, sellers drive price back lower and this time price breaks below the neckline of the pattern confirming a bearish reversal from which, price sells off.
So, essentially what this pattern is revealing to us is a shift in power between buyers and sellers. Buyers are in control initially, go through a battle with sellers and are eventually overpowered by selling pressure and the market reverses lower.
How to Trade the Pattern
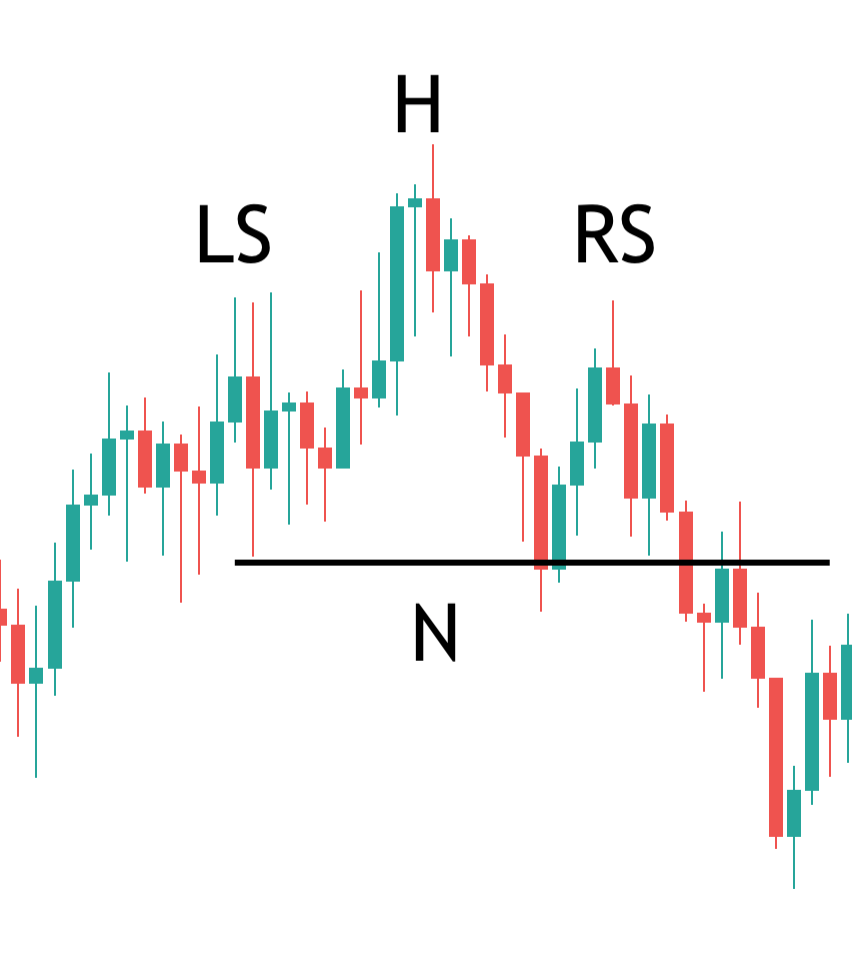
So, in terms of how we trade this pattern, the most common way of trading the pattern is to wait for price to break below the neckline following the sell off from the right shoulder. As price breaks down through the neckline at this point, we can enter a sell position.
In terms of stop loss placement, the typical method is to place a stop above the right shoulder and then target a minimum of twice our risk (distance between entry and stop loss). Doing this ensures that we achieve a positive risk reward ratio on our trade and sticking to this over time is a great way of boosting your chances of achieving and maintaining profitability.
Inverse Head & Shoulders Pattern (IH&S)
Now, as well as being a bearish reversal pattern, there is also a bullish version of this pattern, used to highlight a potential reversal higher. This pattern is called the inverse head and shoulder pattern (IH&S).
So, this time around, we identify the pattern as follows and as you will see, everything is simply flipped on its head.
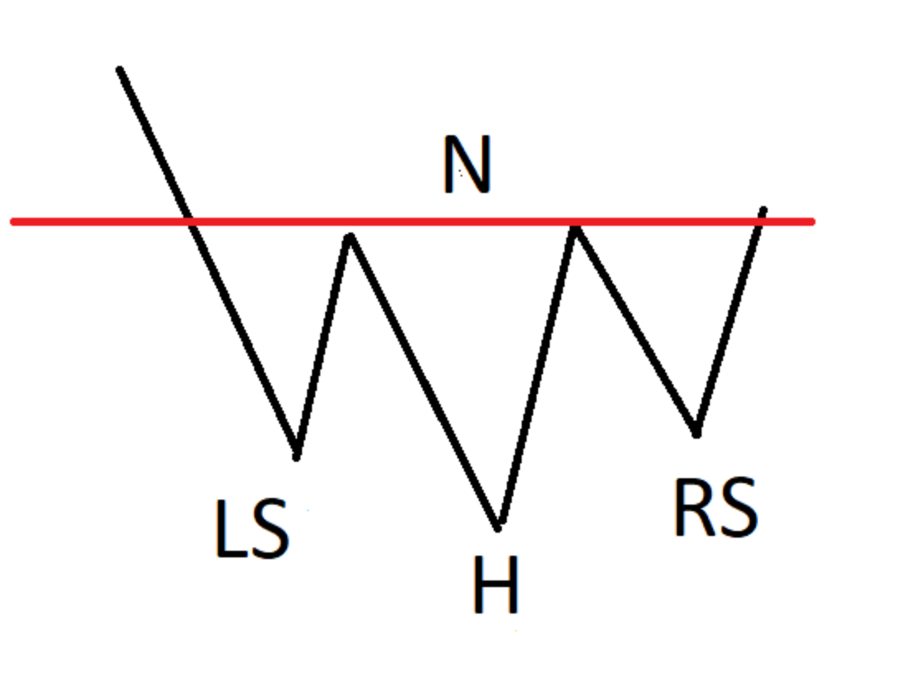
We have an initial price low on the left from which price bounces higher, giving us our left shoulder. Price then reverses lower and trades down to fresh lows before again rebounding higher, giving us our head. From here, price trades up to around the previous high and then reverses lower once again. This time price trades down to around the same level as the first low and then reverses and trades higher.
So, this time around the pattern is highlighting a shift between buyers and sellers where sellers are in control initially, there is a battle and buyers eventually overpower them and take the market higher.
How to Trade the Pattern
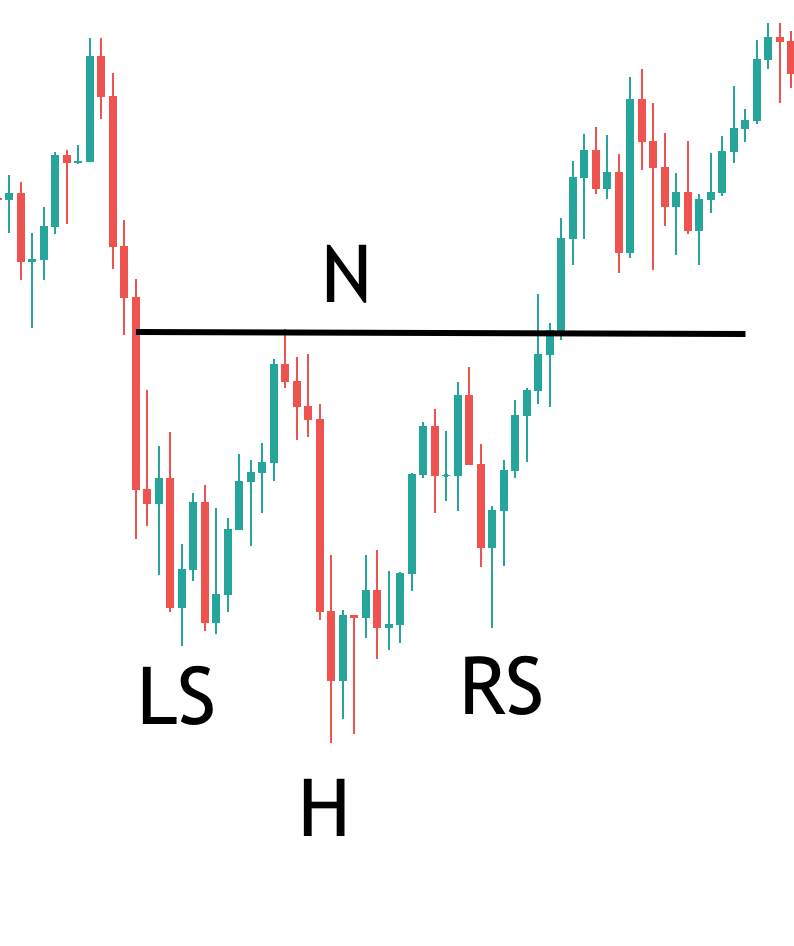
So, this time around, the way we would trade the pattern is that we would look to enter a buy position as price breaks above the neckline, confirming the bullish reversal. We know that buyers stepped in with full force at the low of the pattern (the head) and so once price breaks above the neckline we can enter our buy position. This time around we would place our stop below the low of the right shoulder (remember, we are simply doing the inverse to what we would do with H&S pattern). Once again terms of a target we would look to target a minimum of twice our risk.
So, hopefully you can see just how useful this pattern can be in identifying potential reversals within the market and finding great trade locations. This pattern is fantastic because it can be used in all instruments and assets and traded on all time frames. So, whether you are conducting intraday chart analysis or looking to swing trade on the higher timeframes the H&S and IH&S patterns are a really effective tool for helping you capture reversal points on your technical chart.
Double Top Chart Pattern
Another top technical chart pattern we are going to look at here is the double top. The double top is a bearish reversal pattern, just like the H&S pattern, which highlights a potential reversal lower and offers us the chance to enter a sell trade.
The pattern is again very easy to identify via the following structure.
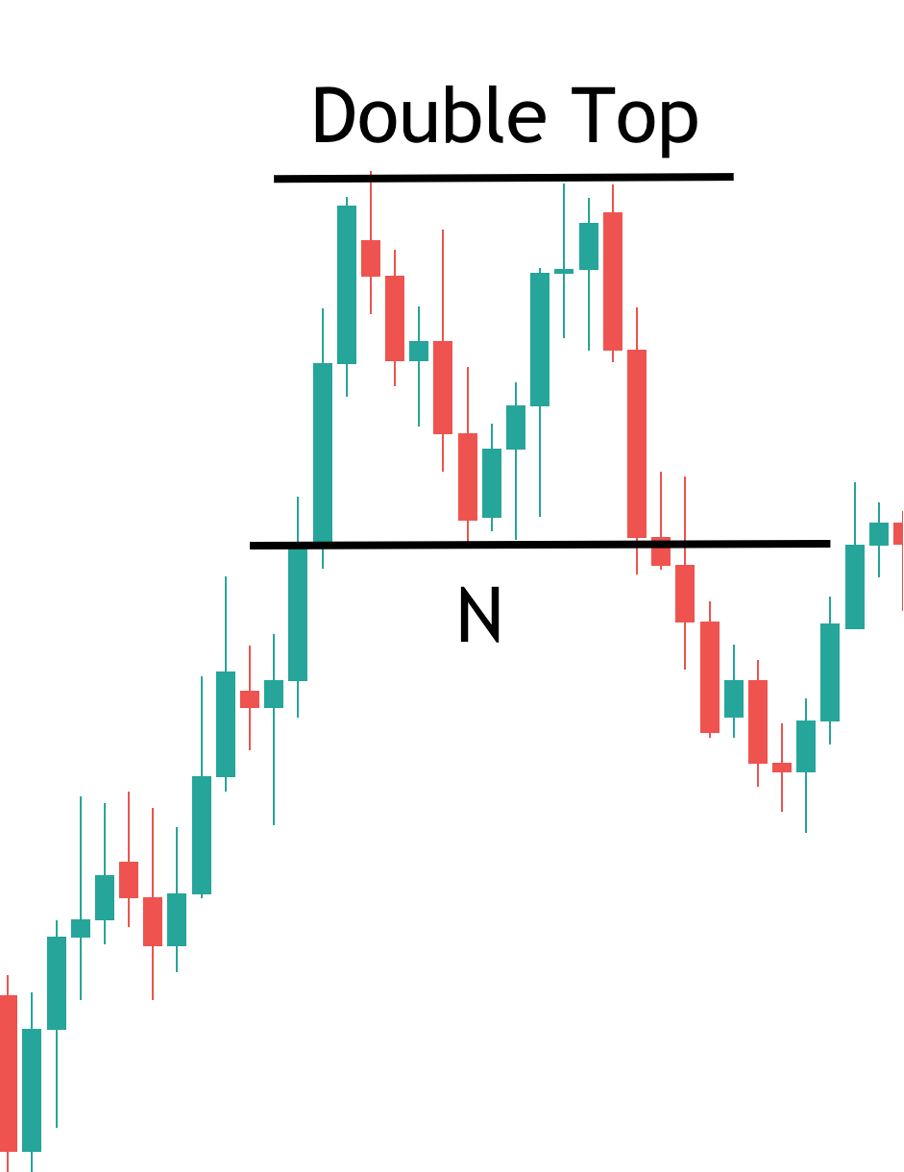
So, initially we see price driving higher within a bullish rally taking us up to our first peak, where sellers step in and affect a reversal. From here price trades lower. However, this reversal does not last, and buyers once again step back in to take price back up. Price then trades back up to test the resistance level created at the initial high. However, as price tests the high, sellers once again step in and drive price lower. From here price then reverses lower and breaks through the initial low (the neckline of the pattern).
So, as you can see, once again what this pattern is highlighting is a battle between buyer and sellers where sellers overwhelm buyers and send price lower, similar to the H&S pattern.
So, in terms of how we trade this pattern, the typical method is to place a sell trade as price breaks down below the low of the neckline. Once again, the neckline is the key pivot to watch and as price breaks below here, it confirms the bearish reversal, offering us the opportunity to sell. In terms of stop loss placement, we would place our stop above the high of the second peak and then target a minimum of twice our risk.
Combining Indicators & Patterns
The beauty of trading chart patterns is that you can also combine them with other charting and technical analysis methods such as technical indicators. As we have discussed in other articles, one of the most powerful ways of increasing our chances of success with any given trade is to look for confluence between different technical signals. So, in this instance we would look to establish a bearish signal on a technical indicator along with our bearish double top pattern, giving us extra indication that the market is likely to reverse lower.
Once such indicator which is very useful in these scenarios is the RSI indicator. The RSI is a momentum indicator meaning that it measures the strength of price moves in the market and signals when momentum is either overbought (stretched to the topside) and vulnerable to a reversal lower or oversold (stretched to the downside) and vulnerable to a reversal higher. Now, one particularly powerful way in which we can employ this indicator in tandem with our double top pattern is to look to establish bearish divergence on the RSI indicator as the second peak forms.
If you are unfamiliar with the term, bearish divergence essentially refers to a situation where the moves on the price chart are not supported by the indicator. So, bearish divergence is identified when price is trading higher, but the indicator is not trading higher. This tells us that bullish momentum is waning in the market (buying pressure is weakening) and price is vulnerable to a reversal lower.
So, let’s think about this: we have our double top pattern which we know suggests a bearish reversal is likely coming and then on top of that we have the RSI indicator telling us there is bearish divergence in the market. This is a strong signal that the market is likely to roll over.
Example of Bearish RSI Divergence with Double Top Pattern
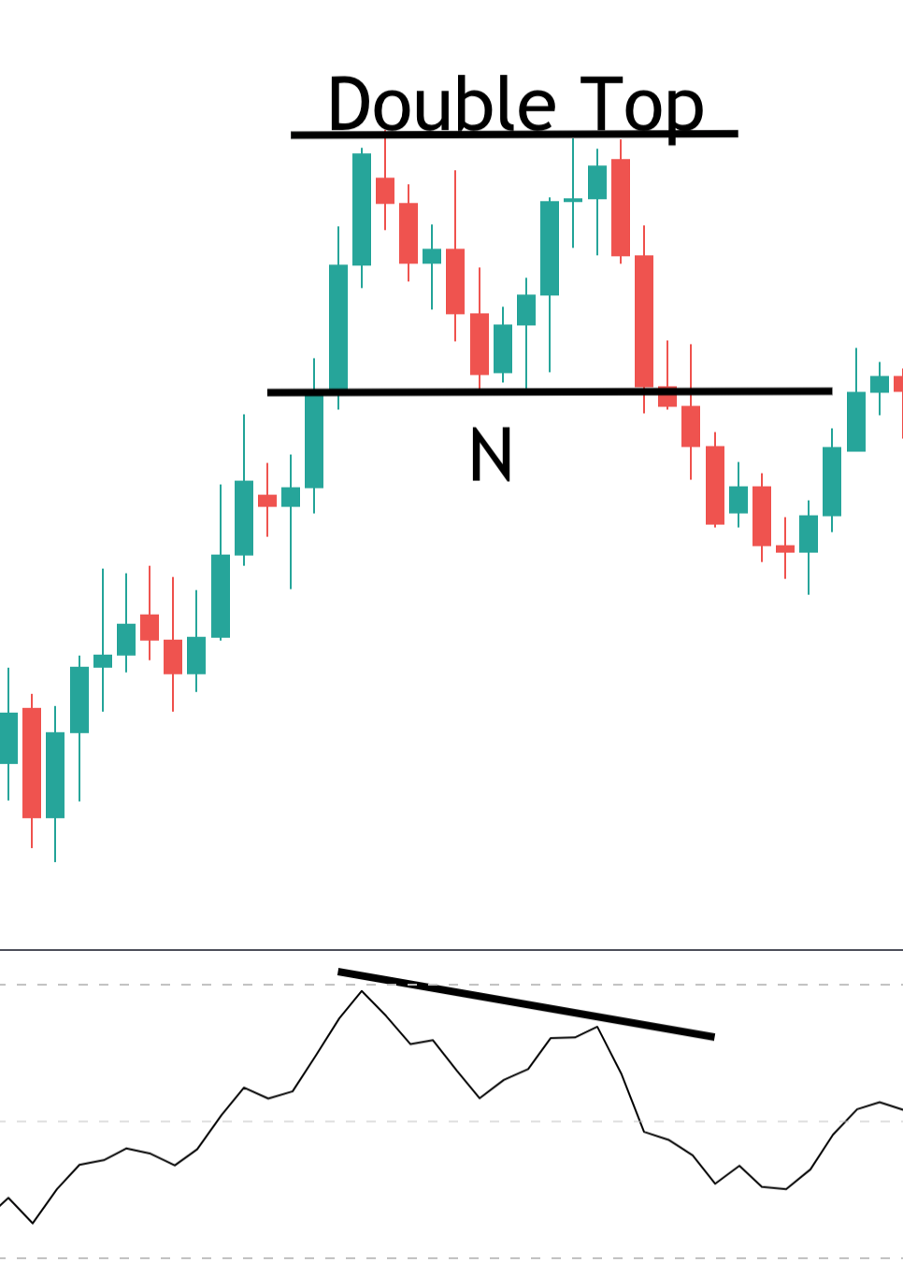
So, in the example above you can see exactly this situation in play. Price trades up to make the initial high before selling off and trading back down to what will become the neckline of the pattern. From here, price then trades back up and retests that initial high. Now, you can see here that as price tests the level, the RSI indicator is actually putting in a much lower peak. This tell us that buying pressure is far weaker at the level than it was the first time around.
And so, as price reverses from here we know we have a strong signal to set a short position and capture the reversal. This is a fantastic example of the power of technical analysis and how we can use chart pattern in combination with indicators to find great trade entries.
Double Bottom Pattern
Now, as well as being a bearish reversal pattern, there is also a bullish version of the pattern which we can use to capture a reversal higher in price; this pattern is known as the double bottom. As when discussing the H&S and IH&S patterns, this time around, everything is simply upside down once again.
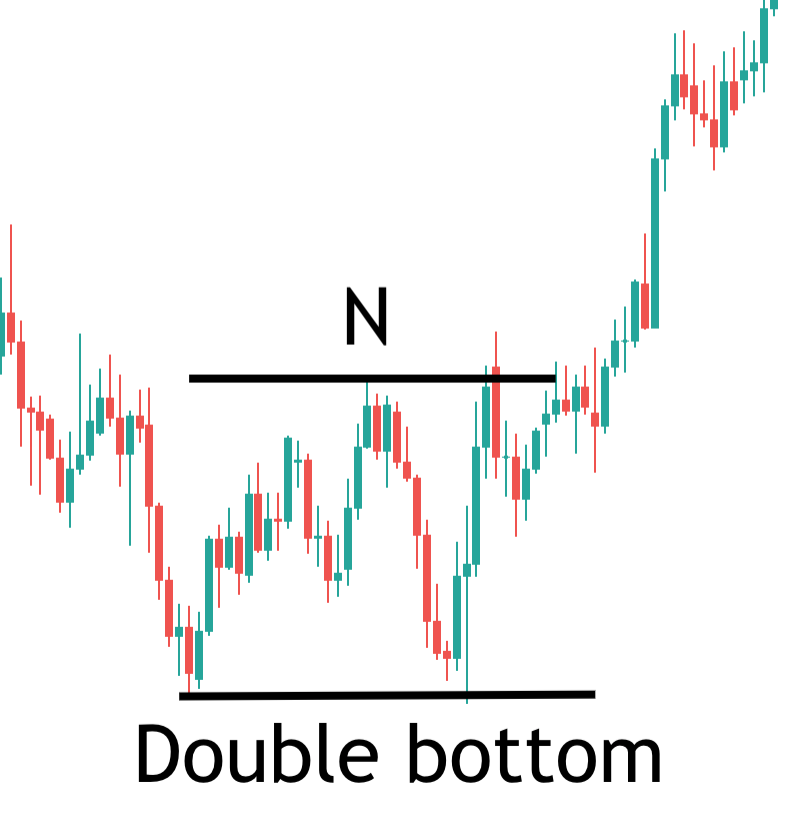
So, we identify the double bottom pattern by first seeing price trading lower within a bearish move. Price then puts in a low, giving us our initial swing low before reversing higher. However, sellers then step in once again taking price lower. Price then trades back down to test the initial low, but once again, buyers then step in here and take price back up.
So, as you can see, this time around the pattern is highlighting a battle between buyers and sellers in which buyers overwhelm sellers and take price higher. So, this offers us the opportunity to set a buy trade as price breaks above the neckline of the pattern. As with the previous patterns, we want to enter our buy trade as price breaks the neckline and place our stop loss below the low of the pattern, targeting a minimum of twice our risk.
Combining Patterns and Indicators
Now, given what we know about this pattern, that it is a bullish reversal pattern and we are anticipating a break higher in price, one more advanced way to trade the pattern is to look to get in early as the reversal off the double bottom support level occurs. Now, this is inherently a slightly riskier approach as until the neckline has been broken the pattern is not yet confirmed.
However, once you have spent enough time identifying and trading these patterns, this is a method which can work very well because the upside is that you get in much earlier on the move giving you a greater potential profit.
One such way to do this is to use the stochastics indicator. Similar to the RSI, the stochastics indicator is an indicator which measures momentum in the market and identifies price moves as being either overbought or oversold. So, one way in which this indicator can be useful is to wait for price to test the double bottom and look to see the indicator move below the oversold threshold, telling us that price is overextended to the downside and vulnerable to a reversal higher. Once the indicator then crosses back above the oversold threshold, this is our buy signal, suggesting a reversal higher is coming.
Double Bottom & Stochastics Example
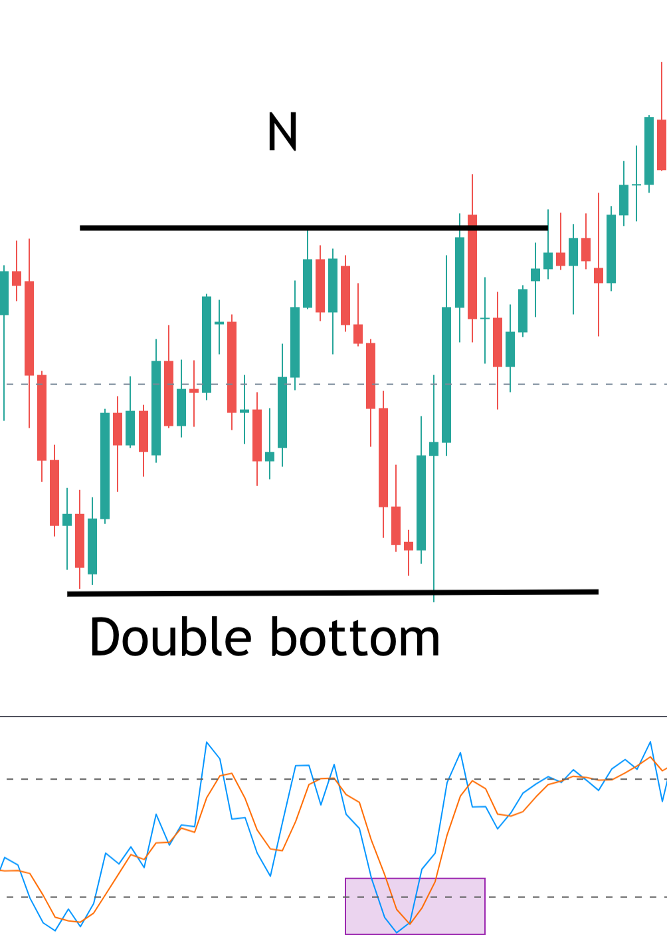
In the chart above you can see an example of this happening. So, price trades down and tests our double bottom support level which we have already marked out. As it does so we can see that the stochastics indicator has gone below the oversold threshold, telling us the move is overstretched. Then, as price starts to bounce off the level, we see the indicator crossing back above the threshold, giving us our buy signal. We can once again place our stop just below the low of the pattern and this time, play for a much bigger target due to our earlier entry. We still also have the option of adding an entry as price breaks out above the neckline.
Considerations When Trading Chart Patterns
Hopefully by now you are feeling pretty excited by the potential chart patterns have to help us analyse and forecast the forex markets. As we discussed earlier though, these patterns can be used across all asset and instruments and so the patterns discussed here will be just as useful in share market chart analysis. When trading these patterns as share market chart patterns, we look for exactly the same parameters and trade the patterns in exactly the same way as we do with the forex trading chart patterns. Many traders use these patterns for share market chart analysis and again, these can be used on all timeframes.
Ultimately, technical analysis and chart interpretation comes down to practice and skill. The more time you spend studying the charts and practising identifying these trading chart patterns, the better you will become at actually trading patterns using technical analysis.