If you are sick of charts overloaded with indicators then the following material will help you to view the markets in a simpler, more effective way. Although traders tend to use different tools when trading forex, I will walk you through the most classic way of trading. It is a price action trading system. Today we will go through the most important aspects of a price action trade and we will examine a few price action trading strategies.
What is Price Action Trading?
Price action trading in forex is a trading method based solely on analyzing previous price behaviors. This means that a trader analyzes market conditions on a naked chart without using additional indicators or oscillators. It is the purest way to evaluate the market, and certainly the most effective way to trade that I have found. Price Action trading helps us with the following:
Trend Identification
The most important process in a price action trading strategy is in identifying ongoing trends.
You probably have heard the famous phrase “The trend is your friend”. And this is absolutely correct. The trend is really your friend. You should always try to trade in accordance with the prevailing trend whenever possible.
Avoiding Consolidations
Price consolidation is when the price is ranging without any clear direction. This means that the price of the forex pair is not increasing or decreasing. It is rather moving sideways, and usually not providing any high probability trading opportunities.
For most traders, a good trading rule would be to stay out of the market when the price is consolidating in order to avoid whipsaws.
Finding Reversals
Some traders tend to attack currency pairs when trend lines are getting exhausted. The reason for this is that trend reversals give you the opportunity to be in the market right at the beginning of a trend. When looking for reversals, traders try to enter before the crowd does, in order to maximize the potential reward to risk ratio offered on such trades.
Analyzing Corrections
A trend correction occurs when the price is moving in a direction opposite to the prevailing trend. Typically a correction or retracement will bounce off the sloping trendline, which can confirm the resumption of the trend. Corrections usually move the currency pairs with an amount lower than the regular trend movement. At the same time, corrections typically take approximately the same time to form as a regular trend movement. In other words, if you are trading a correction, your position will take the same time as a regular trend movement. This is based on harmonic relationships within the market.
Some traders feel that corrective trend movements should be avoided because the actual trend movement provides significantly better opportunity. On the other hand, there are traders who prefer counter trend trading. If you can master market timing, you will find trading corrections can be quite profitable as well. But in general, I believe you should not try to trade corrections if you are not yet an experienced trader.
Popular tools when trading price action
Although indicators are not typically used in the framework of a price action trading strategy, price action traders do rely on various chart patterns. I am going to introduce you to some of the most popular chart patterns found in the markets. But before we dive into various chart patterns, lets briefly discuss the concept of Support and Resistance levels.
Support and Resistance
Support and resistance are on-chart levels, where the price is expected to react. These are usually psychological levels where investors’ attitude tend to match. These levels are easily spotted on the chart. When you see the price attempting to pass thru a certain level several times but is met with buying or selling pressure, then you have a psychological level. If the price approaches this level in bullish direction, the level is a resistance.
And at the other end of the spectrum, if the price approaches the level in bearish direction, it is a support. Note that every support can be broken and then turned into a resistance. The same is in force for the resistance itself. It could always be broken and turned into a support. Traders use support and resistance levels to set entry and exit points on their trading position when trading with price action.
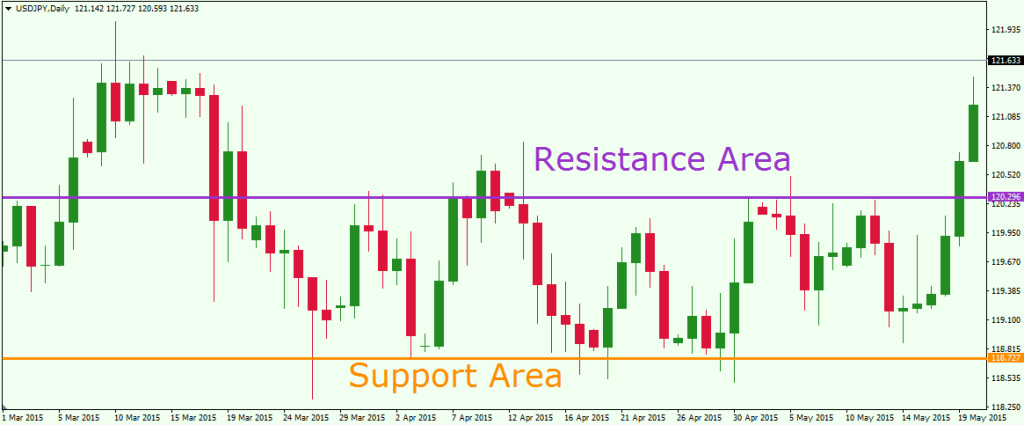
This is the daily chart of the USD/JPY for Mar 1 – May 19, 2015, showing the price of the Yen consolidating between a support and resistance area.
Every forex trading strategy can benefit from proper support and resistance identification. Most forex traders, whether novice or experienced will look at support and resistance levels before initiating a trade.
Trendlines
Trend lines act the same way as a horizontal support or resistance lines. The difference is that a trend line is inclined. In order to confirm a trend, we need to connect at least two tops or bottoms on the chart with a single line.
The continuation of this line is the trend’s potential. Every next price movement toward this trend line has a high chance to bounce from this established trendline. Traders can use trendlines to enter into the market whenever the price bounces off of it or use it to get out of an existing position when price nears the trendline.
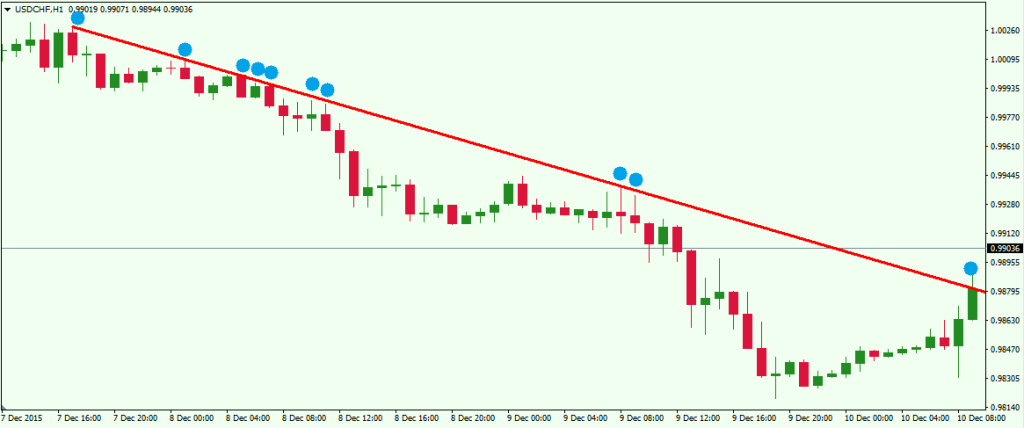
This is a H1 chart of the USD/CHF for Dec 8-10, 2015 showing a bearish trend. The blue points show the moment where the trend line is being tested. As you see, this is a 10-times tested bearish tendency, which is considered reliable.
Channels
Price channels act the same way as a trend line. The difference, though, is that channels have another level, which forms a corridor with the trend. When we confirm a channel on the chart, we expect the price to bounce as a ping pong ball from the upper and the lower level of the channel. This gives the price action trader a clear view of when the price will change direction and for how long it will go in this direction. Also, the more experienced traders can use channels to trade trend corrections in addition to the actual trend movement.
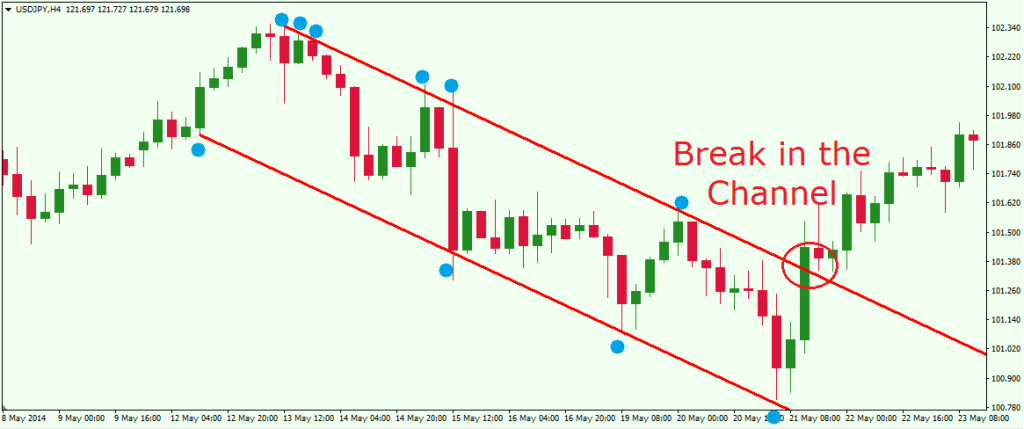
This is the H4 chart of the USD/JPY for May 8-23, 2015, showing the movement of the Yen in a bearish channel. The upper level is tested 6 times and the lower level is tested 4 times. At the same time, the bullish break through the upper level of the channel provides a new bullish opportunity.
Candlestick Patterns
The use of candle patterns is a very common technique for price action traders. Candlestick patterns are specific candle formations on the charts, which can foretell different price potential. Let’s take a look at some of the most common candle patterns.
Doji
The Doji candle is fairly easy to recognize on the chart. We have a Doji on the chart when the price opens a candle at a certain level and then closes that candle at the same level. Thus, the Doji looks like a dash with a wick. The Doji candle indicates indecision in the market, and many times it give us clues of an exhaustion point after a trend. Have a look at the image below:
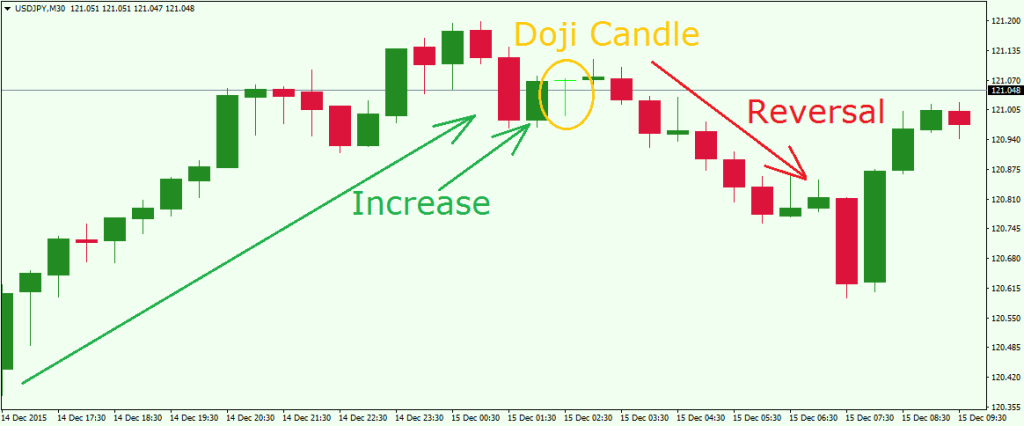
This is the M30 chart of USD/JPY for Dec 14-15, 2015. We have an uptrend, a Doji and a reversal afterwards. Going short after the Doji puts us in a profitable short position during a decrease of about 50 pips.
Hammer and Hanging Man
These two candles look absolutely the same. They have a long bearish wick and a head. The difference between these two candles, though, is that the Hammer is at the end of a bearish trend indicating a potential reversal, while the Hanging Man is usually found at the end of a bullish trend, signaling an upcoming reversal. The picture below shows a bearish candle followed by a hammer and a rapid price increase:
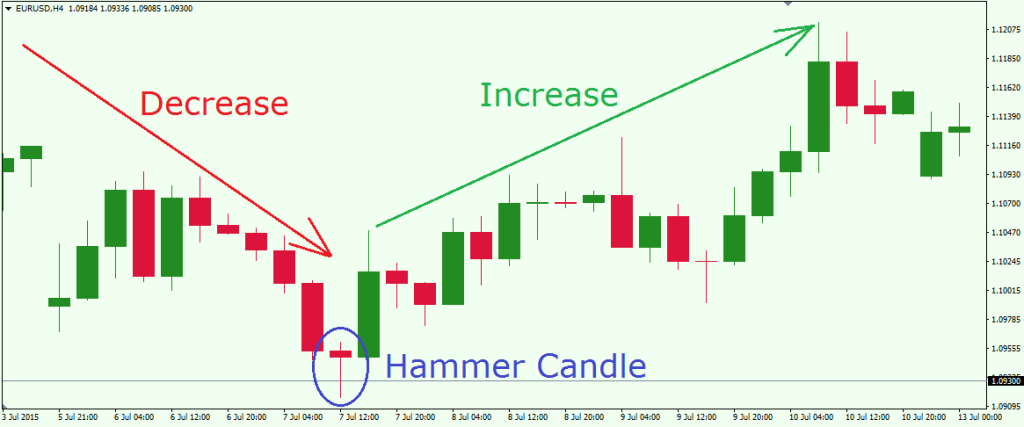
This is the H4 chart of EUR/USD for Jul 3-13, 2015, showing how a Hammer Candle preceded a price increase of about 265 pips in less than 3 days. Pretty attractive, don’t you think?
Inverted Hammer and Shooting Star
The Inverted Hammer and the Shooting Star look absolutely the same too. Furthermore, they are the exact mirror image of the Hammer and the Hanging man. They have a lower body and a long bullish candle wick.
The Inverted Hammer has the same function as the Hammer. When you get it at the end of a bearish trend, you expect the price to increase. At the same time, if you get a Shooting Star at the end of a bullish trend, you will likely see a decrease of the price. Refer to the image below to see how this works:
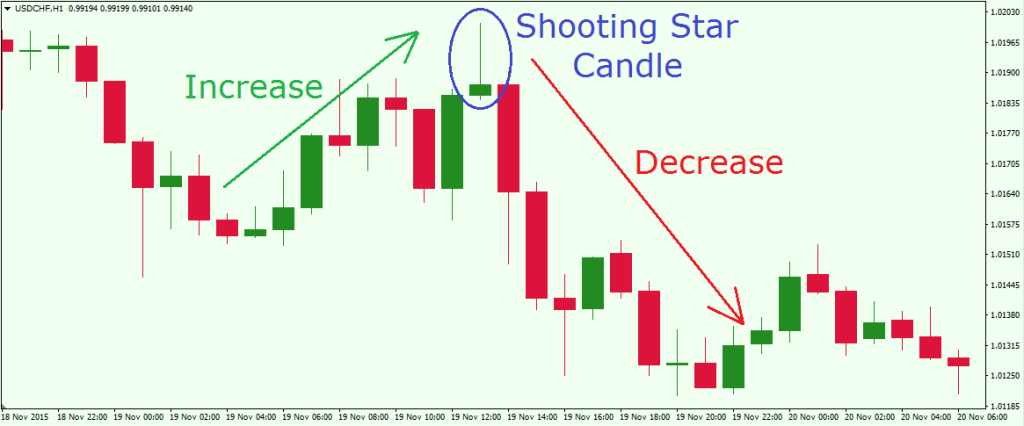
This is the H1 chart of USD/CHF for Nov 18-20, 2015. After an increase of the Swissy a bearish Shooting Star appears on the chart. The next thing we see is a sharp decline of about 67 pips for 8 hours. Note that in order to discover candlestick patterns on your chart, you should actually use a Japanese candlestick chart configuration. If you are using a line chart or bar chart you will simply have no candles to analyze.
Chart Patterns
Chart patterns are specific formations and figures on the chart which give clues to potential trend continuations and reversals. One of the unique features of chart patterns, is that by analyzing the pattern itself, we are able to set potential targets for the trade. In many cases, chart patterns have the potential to move a forex pair with an amount equal to the size of the formation. This is typically referred to as a measured move. Depending on the chart pattern, and how it is traded, it is not uncommon to see success rates of the chart patterns above 60% – 65%. Now I am going to discuss some of the most reliable chart patterns:
Double Top and Double Bottom
The double top and the double bottom are reversal chart patterns, where at the end of a trend, the price creates two tops (or bottoms) approximately on the same level. The bottom between the two tops is the signal level. When the price breaks through the signal level, we consider the formation as confirmed and we open a position accordingly. Then we follow the market until we reach a target equal to the size of the formation. Take a look at the image below:
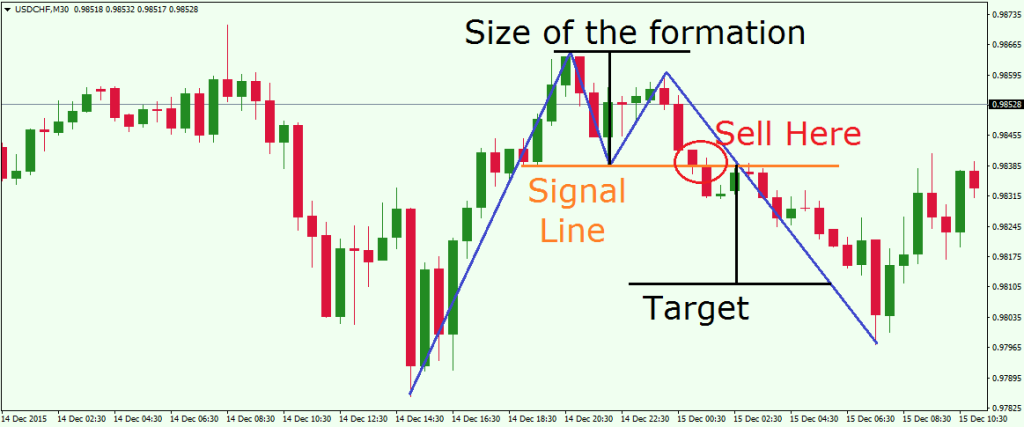
This is the M30 chart of the USD/CHF for Dec 14-15, 2015. The blue lines show the double top formation. The orange horizontal line is the signal line, which triggers our short position. The black lines show the size of the formation, which is the amount of decrease we pursue. Notice that the signal line plays the role of a support since the price conforms to that level a bit before the creation of the double top. Also, when the price breaks the signal line as a support, it tests it immediately as a resistance afterwards. This gives additional reliability to our short position.
The double bottom formation looks the same, but upside down. It could appear at the end of a bearish trend and could reverse the price movement the same way as the double top. Thus, it should be traded the exact same way as a double top formation, but in the opposite direction.
Head and Shoulders and Inverted Head and Shoulders
The head and shoulders is a reversal chart pattern, and is one of the most reliable chart patterns to trade. We have a head and shoulders formation when the price creates three spikes in this order – one lower, one higher and another lower on the approximate same level as the first one. Traders call this formation head and shoulders because, you guessed it, it really looks like a head and shoulders. Head and shoulders typically appear at the end of a bullish trend. At the same time, inverted head and shoulders typically appear at the end of a bearish trend. The two formations look the same, but inverted – the same way as with the double top and the double bottom formations.
When you get a head and shoulders formation, you should set up your signal line, which is also called the neck line. The neck line is the straight line, which connects the two bottoms creating the head between the two shoulders. When the price breaks the neck line, you would open a position, and target a price movement equal to the size of the formation. Please refer to the following example for a head and shoulders example:
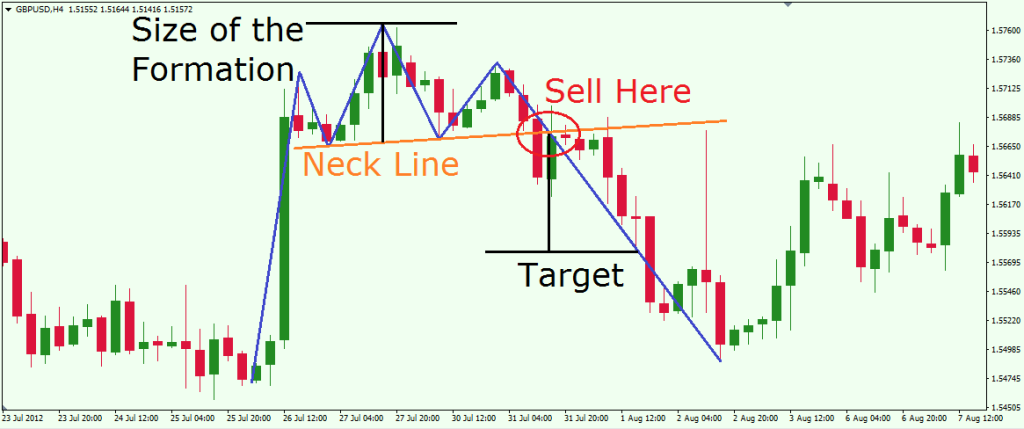
This is the H4 chart of the Cable (GBP/USD). The blue lines on the chart draw a head and shoulders formation. The orange line is the signal line of the formation – the neck line. The black lines represent the size of the formation and at the same time, the potential target we are pursuing. We go short whenever the price breaks the neck line and we aim for the target level.
The inverted head and shoulder formation works the same way, but could appear at the end of a bearish trend, reversing it into a bullish direction.
Rising Wedge and Falling Wedge
We have a rising wedge when the price is closing with higher tops and even higher bottoms. And we have a falling wedge when the price closes with lower bottoms and even lower tops. The rising wedge has the same potential as the falling wedge, but in the opposite direction. Also the two formations are a mirror image to each other. The rising and the falling wedge can be trend reversals or trend confirmations depending on where they appear in relation to the overall trend.
When you have a rising wedge in a bullish trend, this typically suggests that price might reverse its direction. At the same time, if you spot a rising wedge during a downtrend, it has a trend confirmation character.
If you see a falling wedge on a bearish trend, this means the trend could reverse its direction. At the same time, if you notice a falling wedge during a bullish trend, then the formation has a trend confirmation character.
If this sounds confusing to you, just remember that the rising wedge typically calls for an upcoming bearish movement, while the falling wedge indicates eventual price increase.
Similar to the other chart patterns we discussed, the wedge has the potential to push the price toward a movement equal to the size of the wedge. The image below will show you how to trade a wedge.
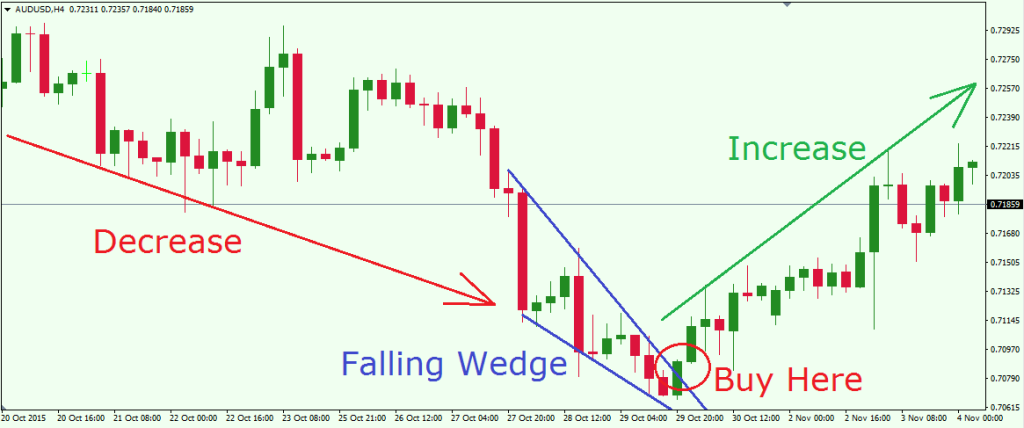
This is the H4 chart of the AUD/USD forex pair where we have a falling wedge reversal pattern after a price decrease. Since it is after a decrease, we know that the price might increase after the wedge. Thus, we buy after the price breaks the wedge in a bullish direction. Note that in a wedge, the signal line is the level, where the price is expected to break through.
Now imagine that we get this wedge after a price increase. In this case, the same falling wedge will act as a trend continuation pattern.
The same strategy applies for rising wedges. If a rising wedge is formed after a price increase, then we have a reversal pattern and we expect to see a price drop. If a rising wedge occurs after a price decrease, then the wedge acts as a correction and the expected drop has a continuation character.
The trading patterns we discussed above are fractal in nature, which means that they could appear on any timeframe on any chart. As with any type of analysis, you should always be prepared for different trading situations. Also, some of the patterns could appear at the same time. You can always confirm a trend with a continuation chart pattern and an additional candle pattern, which can give you additional confirmation when entering the market.
I believe now you should have a clearer picture of how to trade price action using different trading patterns. Price Action Trading is the purest, simplest way to trade the markets. We base our trading assumptions solely on the recent price movement and we try to predict where the price might go based on its previous behavior.
In Conclusion
- Price Action Trading is a method of trading, which puts an emphasis on price movement and behaviors rather than on trading indicators.
- A few of the most important processes in price action trading are:
- Identifying Trends
- Spotting Reversals
- Analyzing Corrections
- The most important trading tools for price action trading are:
- Support and Resistance
- Trend Lines
- Channels
- Candlestick Formations
- Chart Patterns
- Price action trading patterns could appear at any time and could be combined with Candlestick patterns for extra reliability.