Many forex traders are aware of what Pivot Points are and may even incorporate these support and resistance levels into their trading strategy. But did you know that there are many different variations of Pivot Points?
In this article, we will take a closer look at five major types of Pivot Points – Standard Pivot Points, Woodie’s Pivot Points, Camarilla Pivot Points, Fibonacci Pivot Points, and Demark Pivot Points. We will define each type and compare and contrast each variation.
Pivot Point Basics
Pivot points are used by forex traders to locate potential support and resistance areas. They are levels where price interaction may cause a reaction. In addition, Pivot points help traders gauge the bias and sentiment in the market over a given time interval.
Pivot points were originally used by floor traders in the futures markets. Most floor traders were short term day traders in nature. Before the start of the morning session, many floor traders would calculate the Pivot Points of the financial instrument they traded, using the prior day’s high, low and close. This would help them identify important levels during the day, and keep them on the right side of the market.
Pivot levels can be applied to the Equities, Futures, and Forex markets. They are particularly helpful in the FX Markets and their derived levels tend to be respected during the trading session. There are three major sessions in Forex – the US session which opens at 8:00 am EST, the European session which opens at 2:00 am EST, and the Asian Session which opens at 7:00 pm EST.
When there is higher volume in the markets, the Pivot levels tend to lead to more breakout opportunities, and when there is lower volume in the markets, such as periods in between one session’s closing and the next session’s opening, we tend to see price action range between two levels.
Pivot points are considered leading indicators as they have predictive qualities. Many forex traders prefer to use Pivot points over many other types of horizontal levels, as they are more objective and easy to understand. However, some fundamentalists and even some technicians argue that Pivot Points only work because they have become a self-fulfilling prophecy. There may be some truth in this assertion, but so long as their application proves to be profitable in the markets, traders will continue to employ them within their trading programs.
Trading With Pivot Points
The concept of support and resistance is one of the most important ideas when trading the markets. Trading without knowing where potential turning points may occur is akin to skydiving without a parachute. Sooner or later it will ruin you. Pivot points are a tool that can help traders recognize points of interest where traders are likely to see increased order flow. Keep in mind that many traders tend to place stop loss orders and take profit targets around these levels so there exists a higher likelihood of activity that can cause price rejections or breakouts from these levels.
Intraday traders tend to rely on daily pivot levels which are calculated from the prior’s day’s high, low and close. These traders are usually trading the short term timeframes such as the 5, 10 or 15 minute intervals. But trading with Pivot points is not the exclusive realm of short term traders. Many swing and intermediate term traders also use pivots, but they tend to rely more on weekly or monthly pivots.
Although there are many different methods to incorporate pivots into your trading, there are three primary strategies for trading with Pivot levels. The first is using the levels to initiate breakout trades. The second is using the levels to take reversal trades. And finally, traders can employ pivots as a take profit mechanism or to scale out of trades.
Let’s take a look at a few examples: The first example is a breakout trade setup using Pivot Points:
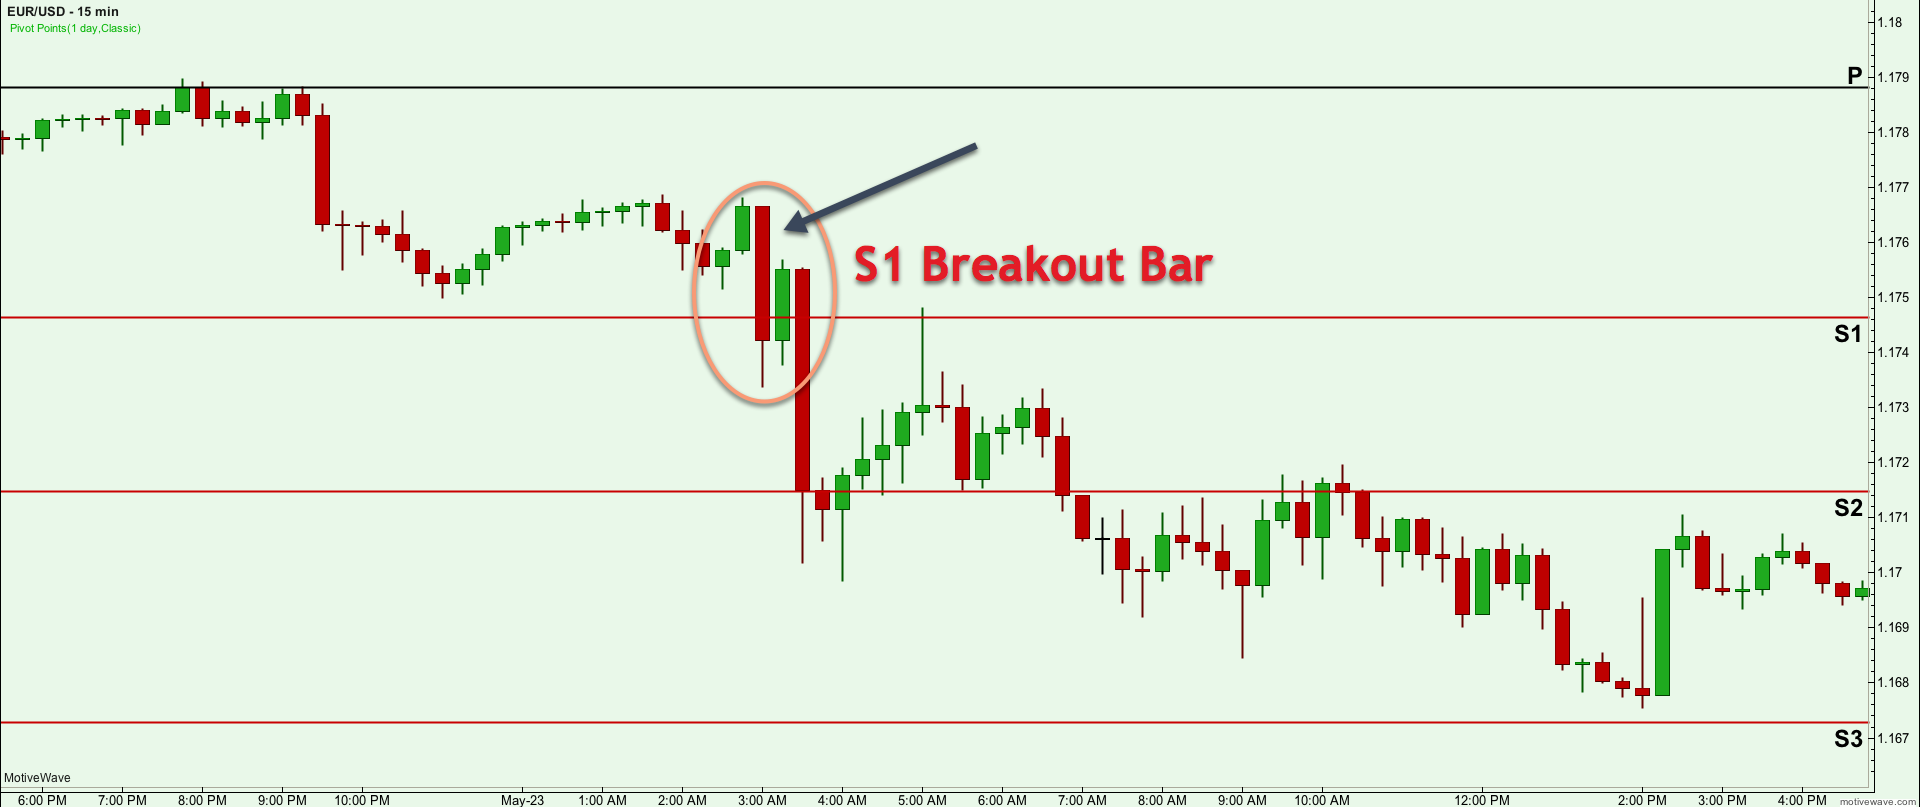
In the chart above, you will notice the circled area with a strong bear candle that breaks the Support 1 level, and closes below it. This is considered a pivot point breakout setup.
The next example is a reversal trade setup using Pivot Points:
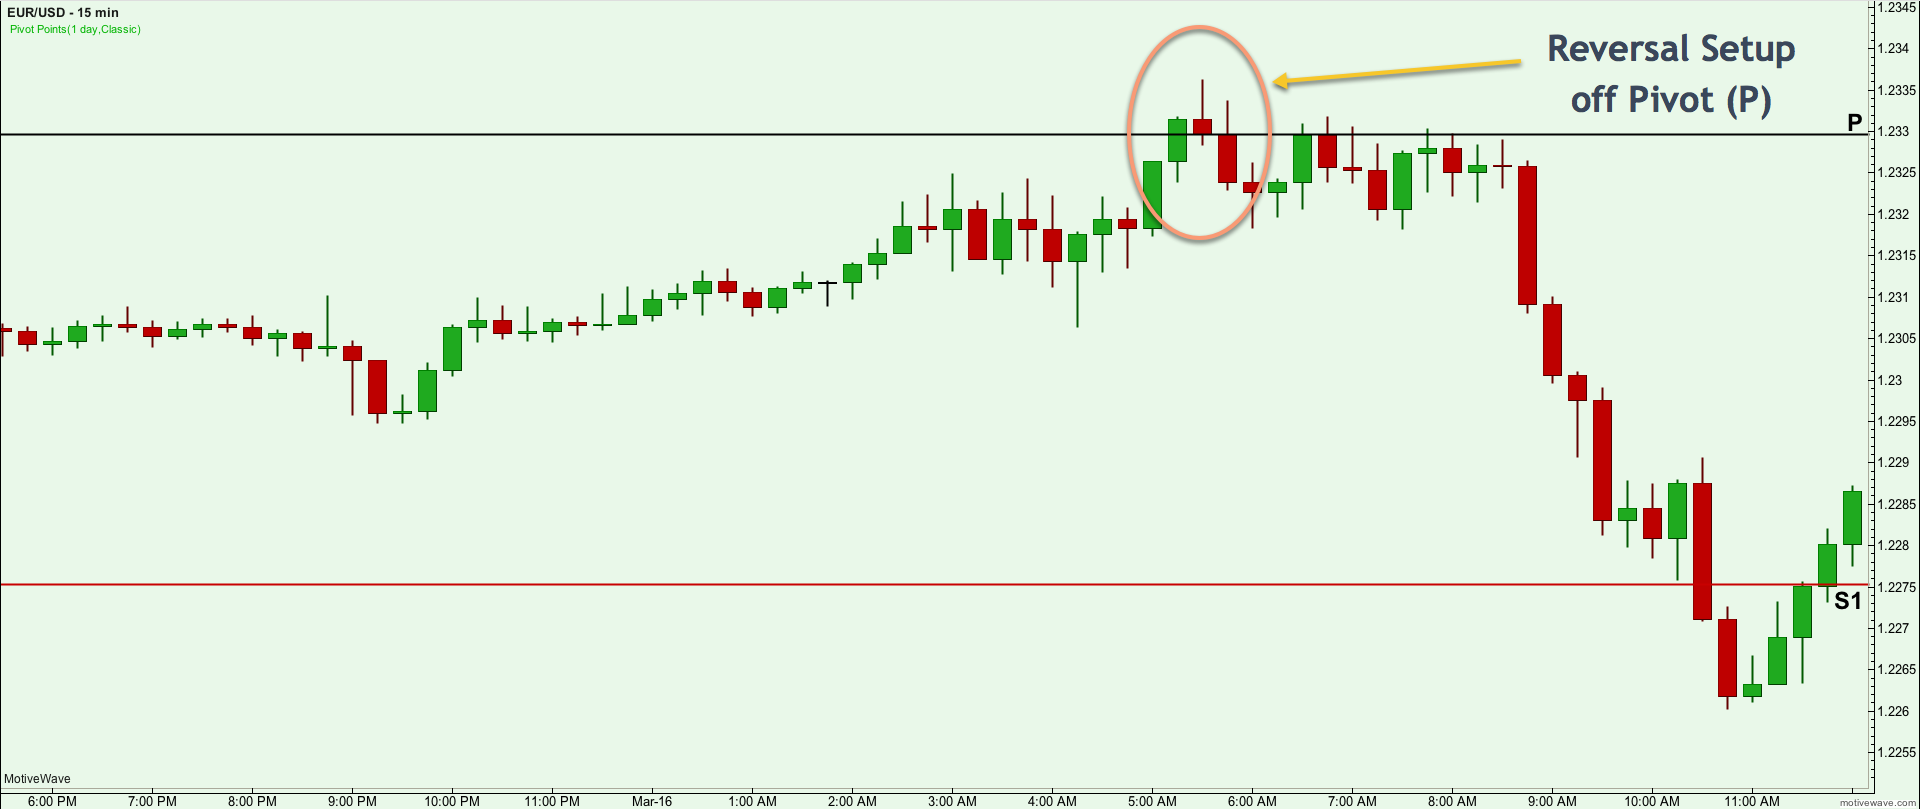
This chart highlights what a Pivot level reversal trade would look like. You will notice that price was moving steadily higher and then approached the Pivot (P) level. As soon as it hit this level, we saw a hammer candle form. And also after the following candle was completed, an evening star pattern was visible on the chart. The price retested the Pivot (P) level and dropped sharply lower afterwards.
Standard Pivot Points
Standard Pivot Points are also commonly referred to as Floor Pivots or Classical Pivot Points. These terms are often used interchangeably, but the important point to remember is that they are the most common type of pivots that traders use.
The calculation of the Standard Pivots starts with the baseline Pivot Point (P). You can simply calculate (P) by taking the high, low, and close and diving that by 3. This is the center or mid-point from which the two support levels (S1, S2) and the two resistance levels (R1, R2) are calculated.
Here is the calculation for the Pivot Point (P):
Pivot Point (P) = (High + Low + Close) / 3
Once the Pivot Point (P) has been computed, then we can move on to compute the other values.
To calculate the first support level (S1) , we would multiple the pivot value by 2, and then subtract that from the high of yesterday.
Here is the calculation for Support 1 (S1):
S1 = (Pivot Value X 2) – Yesterday’s High
Next, we can move on to computing the first Resistance level (R1). To calculate R1, you would also multiply the Pivot value by 2, and then subtract that from the low of yesterday.
Here is the calculation for Resistance 1 (R1):
R1 = (Pivot Value X 2) – Yesterday’s Low
Now we have the first level of support and resistance, next we would calculate the second level of support and resistance. The second level of support (S2) will be lower than (S1), and the second level of resistance (R2) will be higher than (R1).
To calculate the second level of Support (S2), we would need to subtract the difference between the High and Low and then subtract that from the Pivot value.
Here is the calculation for Support 1 (S2):
S2 = Pivot Value – (High – Low)
The second level of Resistance is computed in a similar fashion. To get the result for R2, simply take the difference between the High and Low and add that to the Pivot Value.
Here is the calculation for Support 1 (R2):
R2 = Pivot Value + (High – Low)
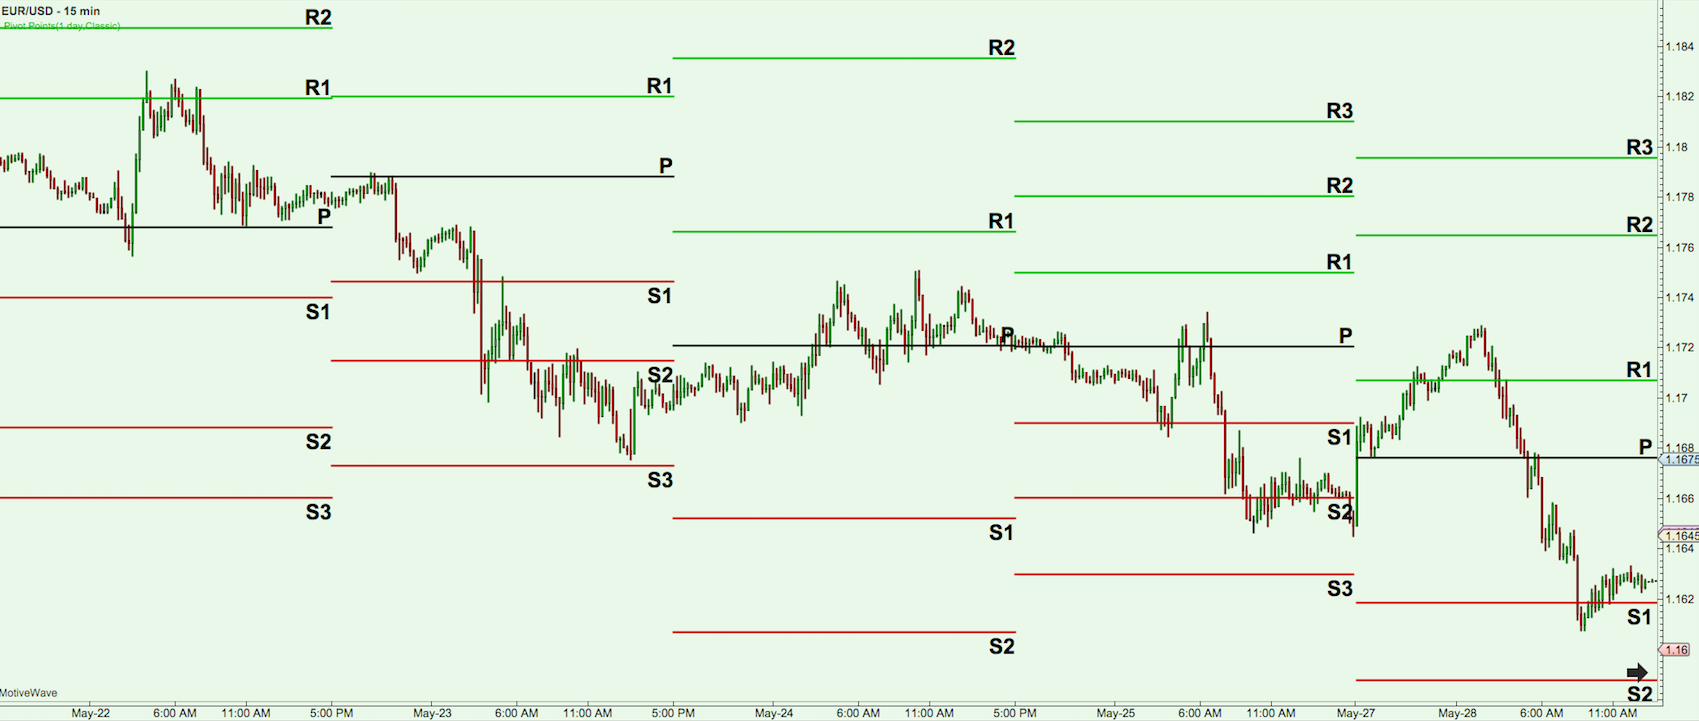
The chart above shows five days of activity for the EUR/USD pair using the 15 minute time series. The standard pivot point indicator is also plotted on the chart. You will notice the Resistance levels marked in green, the Support levels marked in Red, and the Pivot (P) levels marked in black. Notice how many of these areas saw reactions as price approached the levels.
Woodie’s Pivot Points
Now let’s turn our attention to Woodie’s Pivot Points. Woodie’s Pivot Points are calculated as per below:
R2 = PP + (High – Low)
R1 = (2 X PP) – Low
PP = (High + Low) + (2 x Closing Price) / 4
S1 = (2 X PP) – High
S2 = PP – (High + Low)
As you may have noticed the Woodies Pivot calculation is quite different than the standard pivot points formula. One of the primary differences is that the Woodie’s formula puts more weight on the closing price. Notice that the Pivot Point (PP) calculation involves multiplying the closing price by 2, and then adding the High and Low. From this you would divide by 4 to get the PP level.
This might sound a bit confusing at first, but essentially it works similar to an Exponential Moving Average, where the latter data is weighted more heavily than the earlier data. Also as a side note, you will often find in the FX market that the opening price is the same as the closing price. This is due to the fact that FX markets trade 24 hours a day.
Camarilla Pivot Points
Camarilla Pivot Points were invented by Nick Scott in the late 1980’s. They are similar in concept to Woodie’s in that they use the prior day’s closing price and range to compute the levels.
But instead of 2 Resistance levels, and 2 Support levels, the Camarilla equation calls for 4 resistance levels and 4 support levels. Add to that the Pivot Point level, and there are a total of 9 levels plotted for Camarilla. Also, an interesting part of the Camarilla equation is that a special multiplier is included in the formula.
Let’s take a look at the Camarilla Pivot point formula:
R4 = Closing + ((High -Low) x 1.5000)
R3 = Closing + ((High -Low) x 1.2500)
R2 = Closing + ((High -Low) x 1.1666)
R1 = Closing + ((High -Low x 1.0833)
PP = (High + Low + Closing) / 3
S1 = Closing – ((High -Low) x 1.0833)
S2 = Closing – ((High -Low) x 1.1666)
S3 = Closing – ((High -Low) x 1.2500)
S4 = Closing – ((High-Low) x 1.5000)
As you can see, we have a total of 4 Resistance levels, and a total of 4 Support Levels. Many intraday traders utilize the Camarilla levels to fade price moves when then reach the R3 or S3 level.
The idea is that the markets are cyclical in nature, and that a strong price move from the prior session, should tend to revert back within its value range the following day. Stops could be placed at the R4 or S4 levels. If, however, price action continues beyond the R4 or S4 level, then a stop and reverse can be initiated in anticipation for a strong trend day and continued price move beyond the R4 or S4 level.
Fibonacci Pivot Points
Fibonacci studies such as retracements, extensions, and projections are quite popular in the Forex market. The primary Fibonacci levels that traders watch most closely are the 38.2% and 61.8% retracement levels.
But did you know that you could incorporate these Fibonacci levels into a Pivot Point calculation as well? In fact, it is very similar to the Standard pivot points, with the additional inclusion of the 38.2% and 61.8% and 100% ratios.
Here is the formula for calculating Fibonacci Pivot Points:
Resistance 1 = Pivot + (.382 * (High – Low))
Resistance 2 = Pivot + (.618 * (High – Low))
Resistance 3 = Pivot + (1 * (High – Low))
Pivot Point = (High + Low + Close) / 3
Support 3 = Pivot – (1 * (High – Low))
Support 2 = Pivot – (.618 * (High – Low))
Support 1 = Pivot – (.382 * (High – Low))
So, for Fibonacci pivot levels, we start by computing the pivot point as we would the standard pivot point, using H+L+C / 3. Then we would multiply the prior days’ range with the specified Fibonacci ratio. Finally, you would either add the result to the pivot point to calculate the Resistance levels, and you would subtract the result from the pivot point to compute the Support levels.
Demark Pivot Points
Demark Pivot points were introduced by Tom Demark, a famous technical analyst and trader. Demark Pivots are very different from other types of Pivot Points that we have discussed thus far.
These pivot points have a conditional nature based on the relationship between the opening price and the closing price. Demark uses the number X to compute the upper resistance level and the lower support line.
Here is how you calculate Demark Pivot Points:
If Close > Open, then X = (2 x High) + Low + Close
If Close < Open, then X = High + (2 x Low) + Close
If Close = Open, then X = High + Low + (2 x Close)
Pivot Point = X/4
Resistance 1 = X/2 – Low
Support 1 = X/2 – High
Demark Pivot Points place more emphasis on the recent price action. Many Demark traders use Demark Pivot Points in conjunction with TD lines to find intraday support and resistance levels in the market. TD lines are much more objective than traditional trend lines. They are drawn from left to right based on the demand points in an uptrend and supply points in a downtrend. The objective is to find points along the TD line that are most likely prone to a breakout move.
Pivot Points and Technical Confluence
An important consideration for trade entry by many successful speculative traders is the concept of confluence. This is when a number of technical indicators or studies line up within a tight narrow range to provide a high probability trading signal.
Pivot Points can be combined with other technical factors to create a confluent trading setup. For example, let’s say that you plot a bullish trend line using the 30 minute chart. Also, you have added the Standard Daily Pivot point study on your chart. You can look to place a long trade when price rejects the trend line and starts to move up while simultaneously price is also breaking and pulling back to a daily Pivot level such as S1 or R1.
This type of confluent support provided by the up sloping trend line and the Pivot point level would strengthen the trade signal, since you would have two non-correlated technical studies providing you the same signal at a specific time.
This is just one example, but you can use a host of other studies to combine your pivot analysis with. Some of the more reliable confluent signals to trade with alongside Pivot points include horizontal support and resistance, trend lines, moving averages, Fibonacci Levels, Bollinger bands, and candlestick patterns.
And some traders actually prefer to use a combination of three different timeframes to find overlapping pivot levels. By incorporating the Daily, Weekly, and Monthly pivots, you would look for tight clusters. These areas are likely to be closely watched by many traders, and can provide for opportune mean reverting trade setups in many cases.
Let’s take a look at what trading confluence looks like using pivot points. Below you will see a chart of the EURUSD using the 15 minute timeframe. Notice that the price action was range bound for most of the period shown. We were able to draw a horizontal price support line on the chart. (marked in Blue).
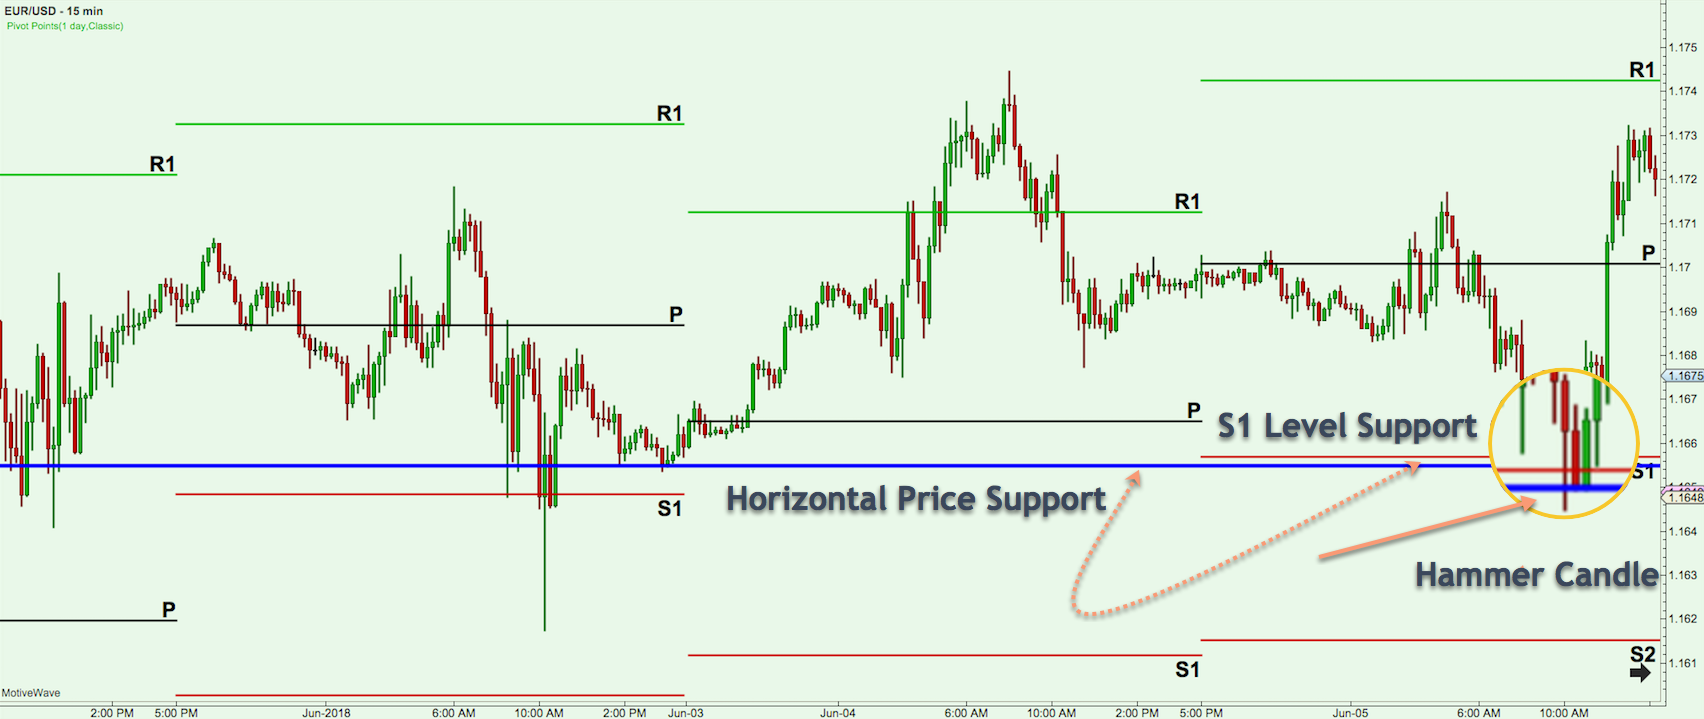
Towards the end of the price action on this chart, you will see that price was moving down, and hit the horizontal price support and the overlapping S1 level support. In addition to that, as soon as price converged on this level, we saw a nice hammer candle with a long lower wick. After the reversal candle formed, priced bounced out of this area and shot up above the Pivot level and almost reached the R1 level within a short span of time.
Pivot Point and Technical Confluence Trading Strategy
As we have touched on in the prior section, it is important to combine Pivot Points with other technical studies in order to create a high confidence trade setup. In this section, we will take a look at a Pivot Point trading strategy that incorporates the Daily Standard Pivot Point Indicator, 150 Period Moving average, and Fibonacci retracement levels.
This strategy will look for a recent test and bounce from the 150 period moving average that aligns with a recent bounce from a primary Fibonacci retracement and Pivot Point level. Once we have these conditions met, then we will enter into the trade on the close of a strong reversal candle.
The stop loss placement will be just beyond the swing point created by the reversal. Our exit on the trade will the next higher pivot point level in case of a long trade, and the next lower pivot point level in case of a short trade.
The chart below displays about three days of price action on the EUR/USD currency pair.
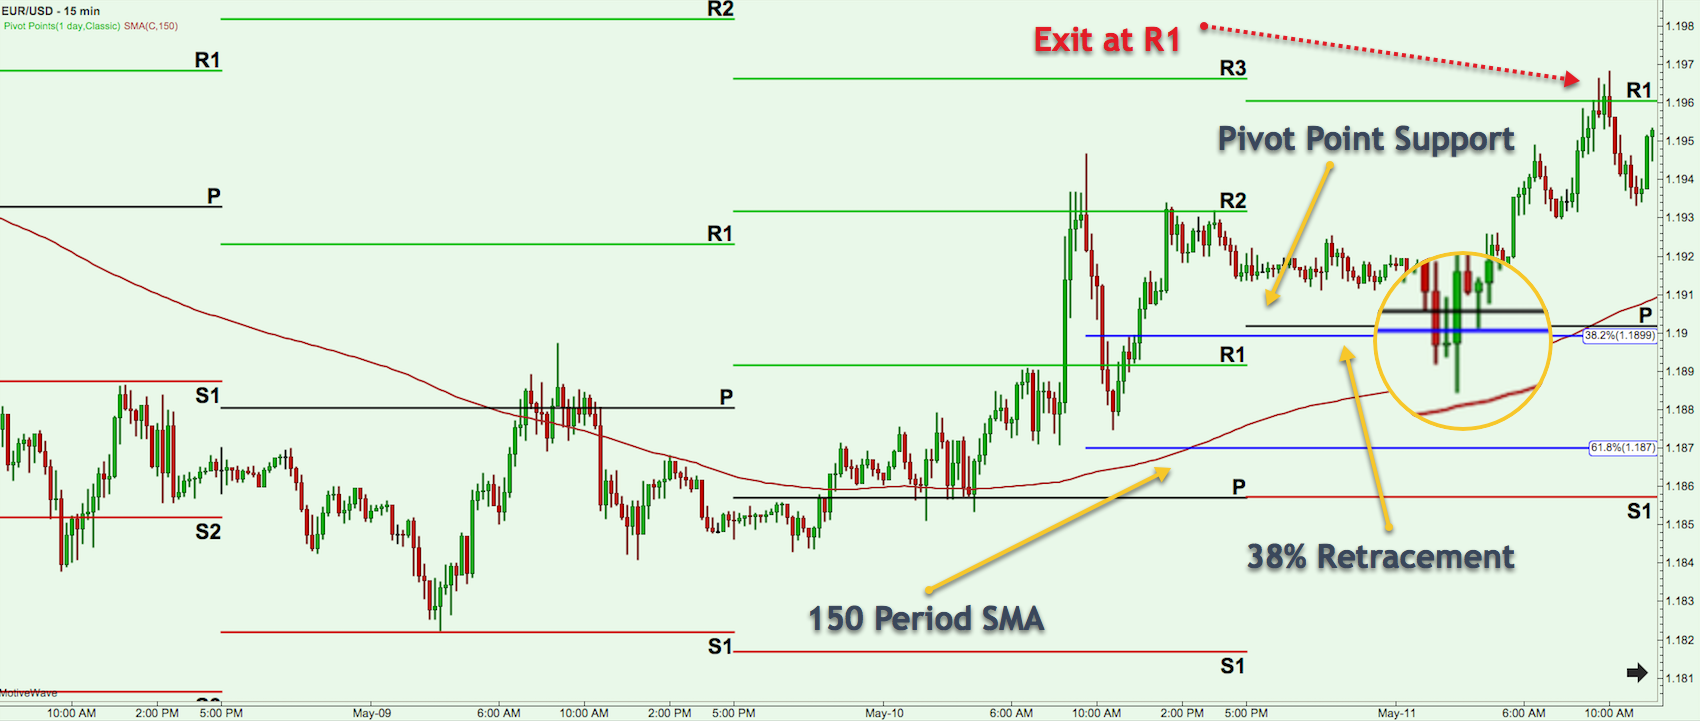
As you can see, price started off trading in a tight range for about two days. The 150 period Simple Moving Average (SMA) was headed down but soon price crossed it to the upside taking out taking out the Pivot (P) level, R1 level, and ultimately was halted at the R2 resistance level. Then price dropped back down sharply near the Pivot (P) level. We saw another bounce back to retest the R2 level, which contained the price action from a further price increase.
Afterwards prices started to decline slowly and in a much lower volatility environment. At this point, we could prepare for a test of the Pivot (P) level, which also coincided with a 38% Fib retracement measured from the major swing low two days earlier. Prices pushed below this zone but was rejected as it approached the 150 period SMA, which was slightly below the overlapping Pivot and Fib support area.
This was the setup that our strategy calls for, and as soon as prices closed higher in a decisive manner, we would enter a long trade. You will notice the large green bar within the magnified area. That would be our preferred entry point. The stop loss would be placed below the swing low created by this price rejection. And our target would be the next higher Pivot line, which in this case was the R1 level.
As you can see prices moved rapidly after testing this confluence support area and went directly to the R1 resistance area. As per our exit strategy, we would have had our take profit target just below this RI level.
Summary
In this article, we discussed the five major variations for the Pivot Point Indictor. They can be classified as Standard Pivot Points, Woodie’s Pivot Points, Camarilla Pivot Points, Fibonacci Pivot Points, and Demark Pivot Points. The most popular and widely used is the Standard Pivot point indicator. However, each variation has its following among forex and futures traders.
Obviously, the question arises as to, Which type of Pivot Point is the best to use? Well, the answer to that is not so clear cut. There will be times when certain types of pivot points adhere to price action better than others. But as a matter of preference, I generally like to use the Standard Pivot Points, as those are levels that most traders have marked and keep a close eye on. I find that they tend to have better price reactions. In any case, you should test each and see which works best for your preferred trading instruments.