Heikin Ashi candlesticks are a unique charting method which get attached to your standard price chart on your trading terminal. The chart will resemble a typical Japanese Candlestick chart, however there are nuances that make reading the Heikin Ashi candles a bit different than the traditional candlestick chart.
Below you will see what a Heikin Ashi chart looks like:
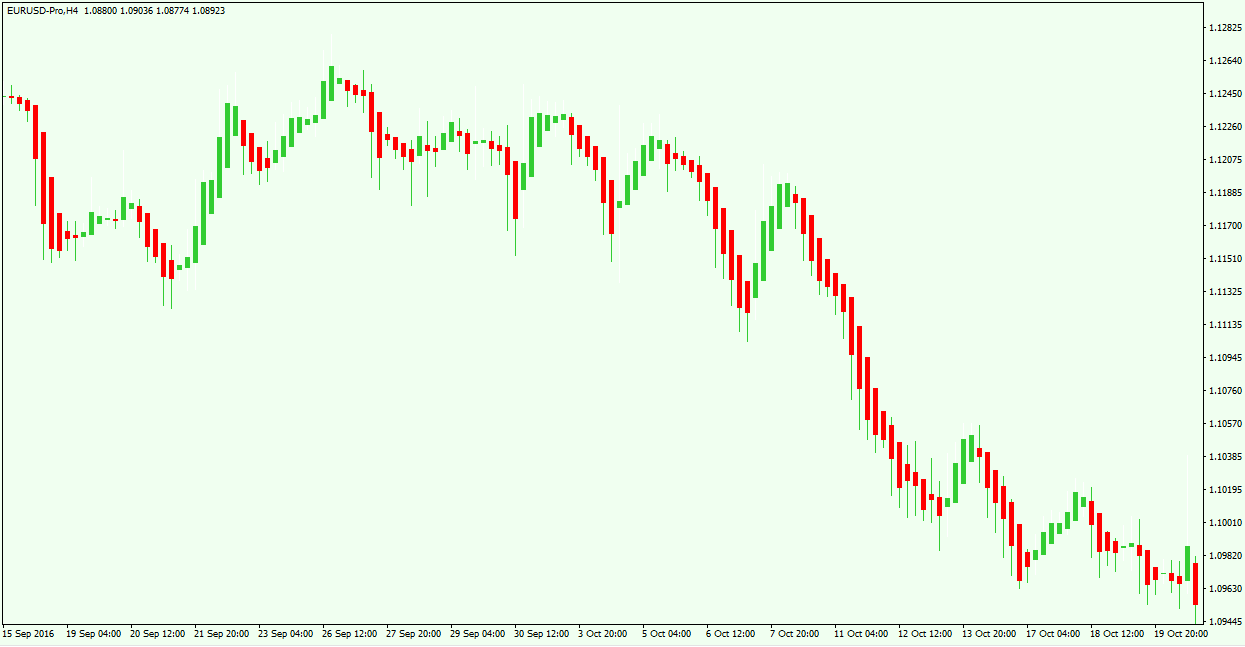
An untrained eye might not even recognize that this is not a standard Japanese Candlestick chart. As you can see, each Heikin Ashi candle has a body, and an upper and lower candlewick (shadow) – the same as with the Japanese Candlesticks. However, if you take a closer look you will notice that each of the Heikin Ashi bars start from the middle of the bar before it, and not from the level where the previous candle has closed. This is a major distinguishing factor between the two charting styles.
Heikin Ashi Calculation
Each Heikin Ashi candle has an open, close, high and low. Therefore, there are four segments of the Heikin Ashi formula:
The opening level of the Heikin Ashi candle equals the midpoint of the previous candle. If you refer to the chart example above, it is clear that every new candle starts from the middle of the previous one.
Open = [Open (previous bar) + Close (previous bar)]/2
The close of each Heikin Ashi bar equals to the average level between the four parameters – open, close, high, and low:
Close = (Open+High+Low+Close)/4
The highest point of a Heikin Ashi candle takes the actual high of the period. This could be the highest shadow, the open, or the close.
High = Max Price Reached
The lowest point of a Heikin Ashi candle takes the actual low of the period. This could be the lowest shadow, the open, or the close.
Low = Min Price Reached
Japanese Candlesticks Vs. Heiken Ashi Candles
The general idea behind the Heikin Ashi bars is that they smooth the price action. As a result, much of the noise shown in traditional Japanese Candlesticks is eliminated with Heikin Ashi charting. Now let’s compare the price chart using a Japanese Candlestick chart and a Heikin Ashi chart:
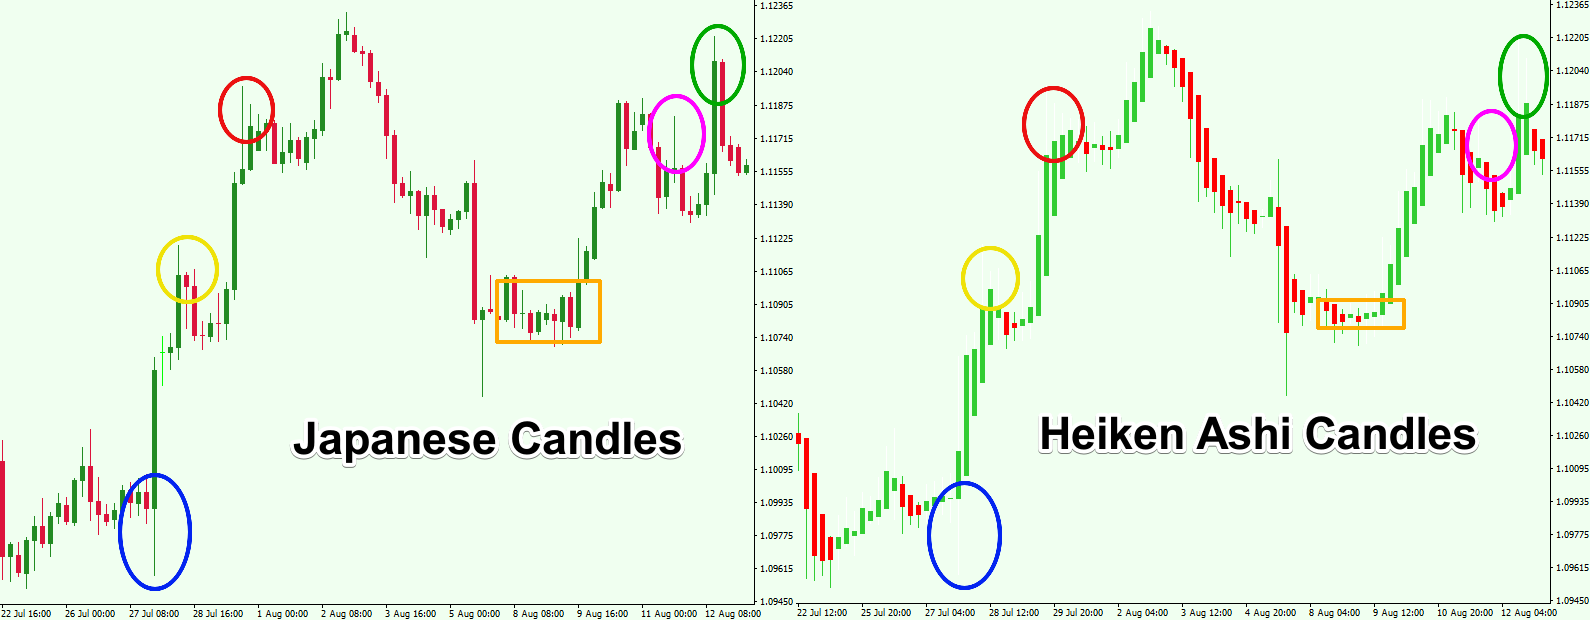
On the left side you see a chart composed of Japanese Candles. On the right side we have a chart made up of Heiken Ashi candles. The charts look pretty similar, however, the Heikin Ashi chart is smoother, don’t you think? Referring to the colored circles on the chart you see the main differences between the two charts. Notice that the Heiken Ashi chart isolates some of the noisy price action.
As a result, some Forex traders prefer to use the Heiken Ashi candles in order to isolate the noise on the chart, which can provide for a clearer analysis of the price action.
Using Heikin Ashi
If your goal is to catch longer and persistent trends, then using a Heikin Ashi chart will help you toward that end. Trend detection is one of the main functions of this type of charting style. The Heikin Ashi trading style puts an emphasis on persistent trends. Small corrections and consolidations are left behind and they are barely visible on the chart. You will notice that when the direction changes on a Heikin Ashi graph, the price most likely starts a new move. This helps to distinguish between the potential beginning and the end of a currency pair trend.
Since chart noise is filtered, you basically see the naked trend. Using a trailing stop is a good trade management tool to pursue in a trending market. As a result, many traders combine the smoothing benefits of the Heikin Ashi chart with a trailing stop indicator to get the most of out a trending market condition.
Another way to use a Heiken Ashi graph is to look for chart patterns and apply price action rules. In most cases this works the same way as with traditional Japanese candlesticks. But you will find that Heiken Ashi chart pattern breakouts are sometimes more reliable than traditional candlestick charts.
Heikin Ashi Trends
As we have pointed out, the ease of trend identification is one of the major benefits of using a Heikin Ashi chart. With a Heikin Ashi chart you can confidently distinguish strong trends from unsustainable price action. Let’s take a look at some examples of trends – both bullish and bearish – using the Heikin Ashi price graph.
Bullish Heikin Ashi Trend
At first glance, the bullish Heikin Ashi trend looks like a normal Japanese candlestick trend. However, you will notice that the Heikin Ashi trend is built primarily by bullish candles and is absent of lower candlewicks. When the price is shooting up, the price action creates very little to no lower shadows.
Below you will see a strong bullish trend on a Heikin Ashi chart:
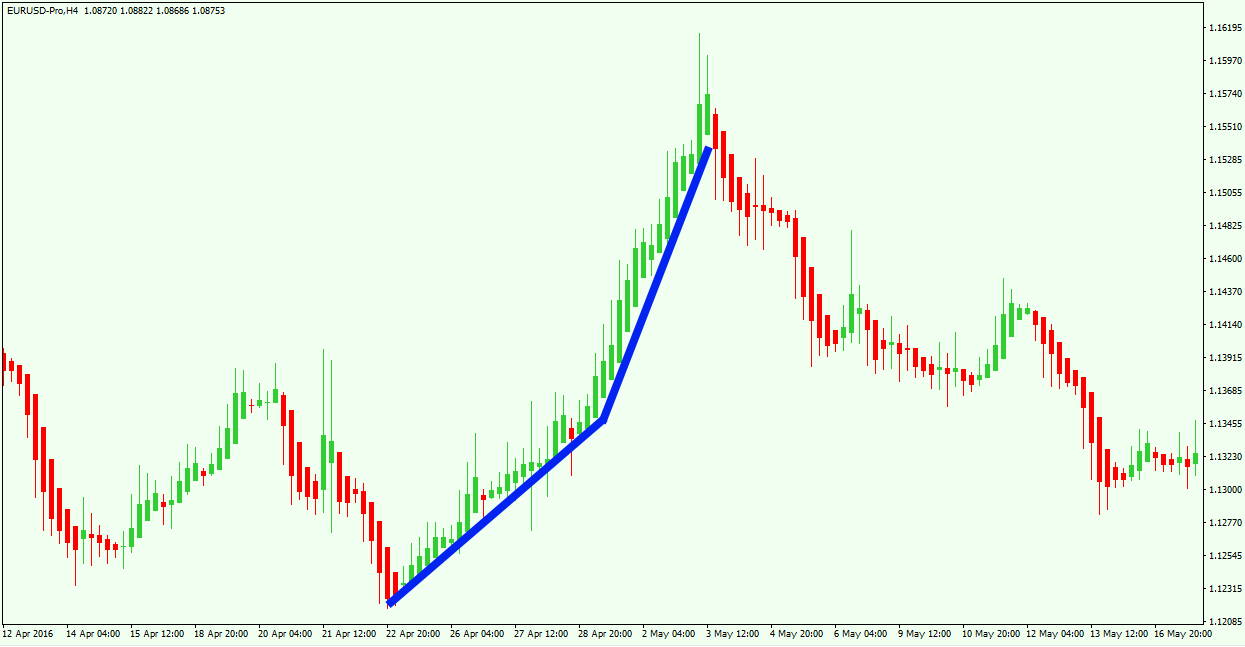
See the strong bullish trend that is marked in blue. Notice that there are only a few lower candlewicks on the way up. This means that this bullish trend is very strong.
Bearish Heikin Ashi Trend
The bearish Heikin Ashi trend has the same functions as the bullish one but in the opposite direction. This means that it is built mainly by bearish candles. Also, a strong bearish trend on the Heikin Ashi graph has very little to no upper candle shadows. Now let’s see how the bearish Heikin Ashi trend appears:
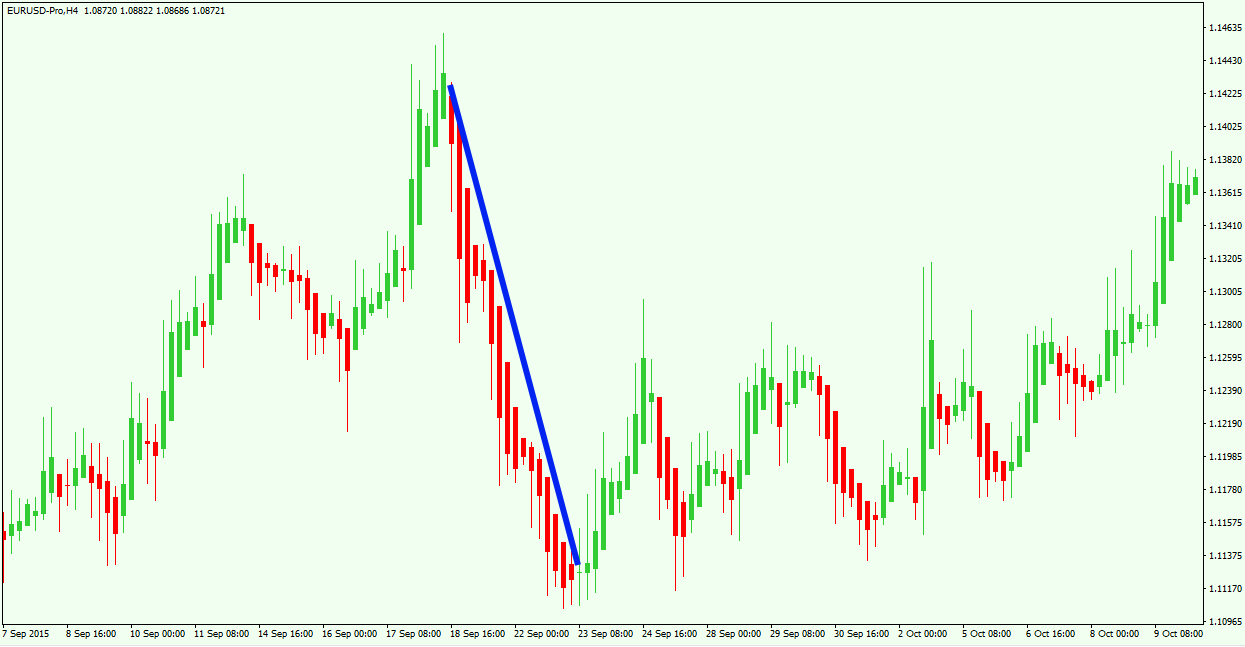
This time we have noted a bearish trend on a Heiken Ashi chart. The decrease is marked with blue on the image above. See that the bearish price action has no upper candle wicks. This indicates that the declining momentum is very strong.
Heikin Ashi Patterns
Now we will discuss three patterns which are commonly found on a Heiken Ashi chart.
Doji
The first pattern we will start with is the Doji reversal candlestick. The Doji candle appears when the price closes at the same level where it opened. As such, the candle has no body and it essentially looks like a dash. The Doji, when it appears after a directional move, has a reversal potential and indicates that the price action is stalling and might be poised to start a counter trend move.
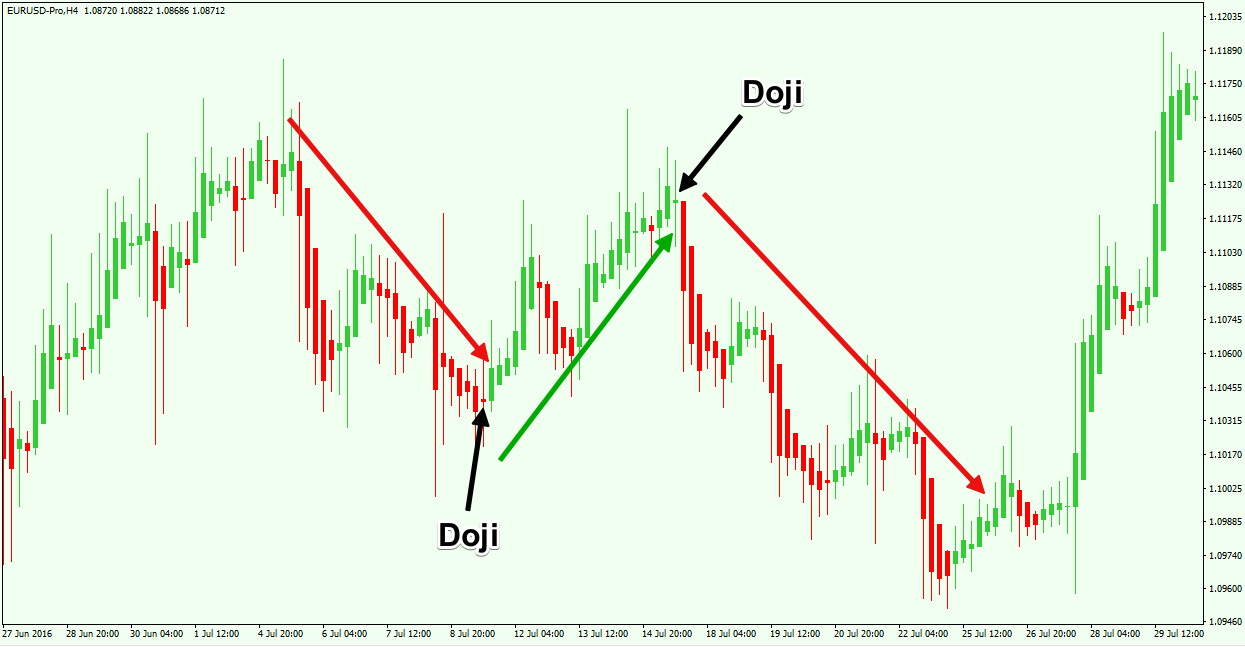
Above you see a Heikin Ashi chart, which shows three price swings – bearish, bullish and bearish again. The first starts the bearish price swing down. At the end of this price swing, we see a Doji candle. The direction reverses afterwards. Then comes another Doji candle pattern at the top of the bullish move. The price action reverses again to start a fresh bearish move.
Triangles
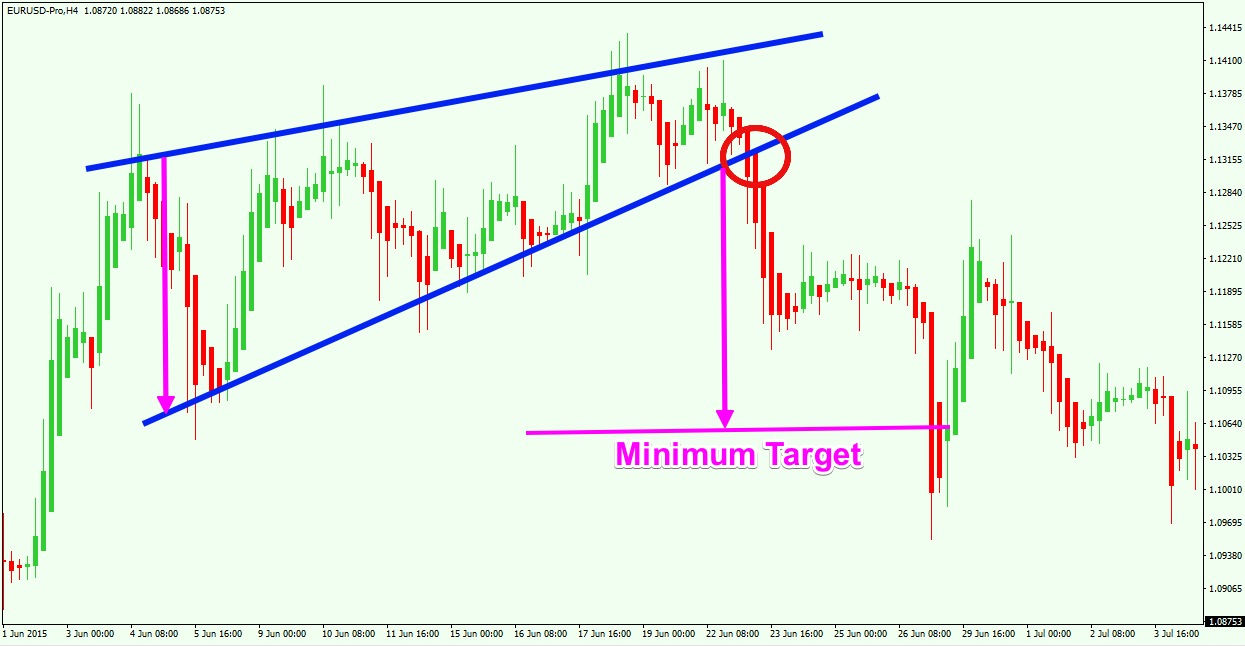
Triangle patterns are commonly found on the Heikin Ashi chart as well. The important point here is to follow the direction that the price action breaks through. If the Heikin Ashi price action breaks the upper level of the pattern, this signals that the increase will likely be extended. If the price action breaks the lower level of the triangle, then we anticipate the price to start a new bearish move.
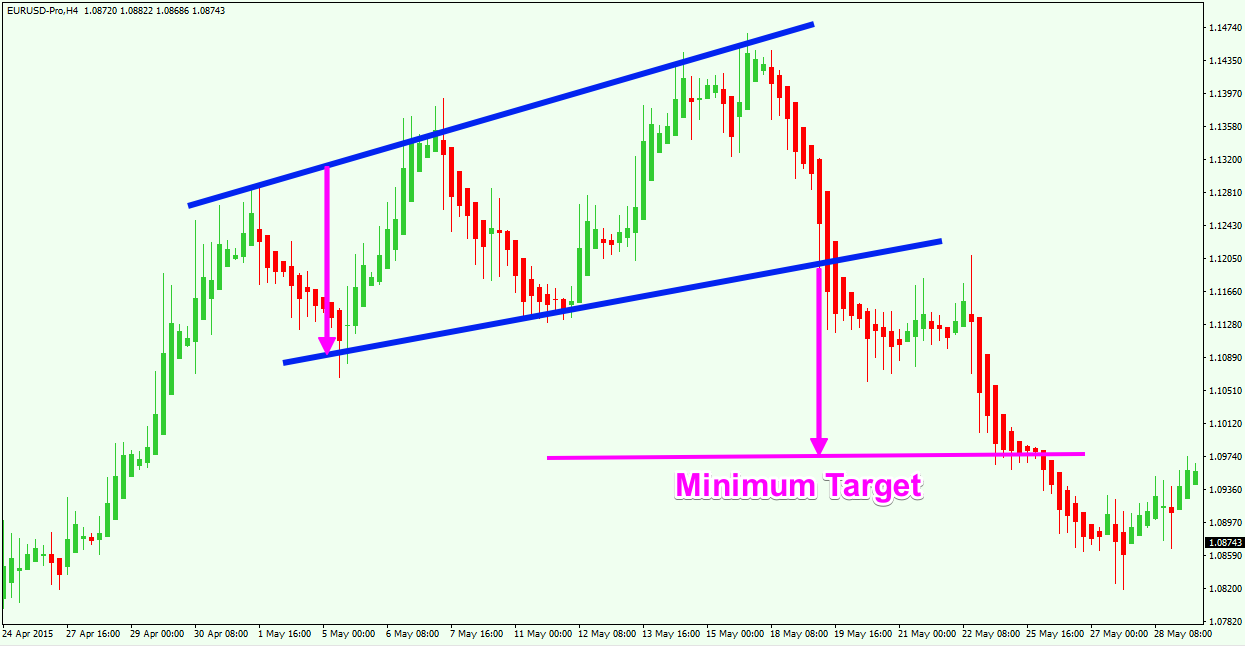
On the chart above, you can see an Expanding Triangle pattern (blue). Then the price action breaks the lower level of the triangle and completes the minimum target of the pattern, based on the measured move calculation.
Wedges
The other pattern that is often found on the Heikin Ashi chart is the Wedge pattern. There are two types of Wedge patterns – Rising Wedge and Falling wedge.
It is important to mention that the Rising Wedge has bearish potential. Contrary to this, the Falling Wedge has a bullish potential. Let’s take a look at how a Wedge looks on the Heikin Ashi chart:
In the chart above, we have a Rising Wedge chart pattern. The price breaks the lower level of the Wedge to start a fresh bearish move. The minimum target gets reached within a couple of bearish price swings.
Heiken Ashi Indicator for MT4
One way to display a Heikin Ashi chart is by using a MetaTrader 4 chart terminal. The MT4 platform has the smoothed Heiken Ashi indicator built in. To pull it up you can simply click on insert > indicators > custom > Heikin Ashi. Then the indicator will replace your original price chart.
In some cases, the default MT4 colors of the Heikin Ashi candles are red for bearish and white for bullish. If you are using a white or other very bright color for your chart background, you won’t be able to see the bullish candles. If this happens, simply open the settings of the Heikin Ashi add-on and change the color for the bullish candles to green, or whatever other color you prefer.
How to Trade with Heiken Ashi
Heiken Ashi charting is very powerful when combined with price action analysis. Look for the emergence of new trends, or for the reversal of already existing ones.
Look for support and resistance levels and important swing points, and keep in mind that these could act as future turning points on the chart. Chart and candle patterns should always be considered for the opening and the closing of trades.
Always use a stop loss order conformed to a level prior to your entry point. You can always replace the regular stop with a trailing stop order as price moves in your favor.
Hold your trades until the price action clues you in to a potential trend reversal. Also if the Heiken Ashi price action creates a relatively large candle which is opposite to your trade, you might want to exit the position. As we said, most of the noise is filtered on the Heikin Ashi charts. Thus, a big opposing candle is likely to indicate a shift in sentiment.
Heiken Ashi Chart Analysis Examples
Let’s take a look at a couple of trading examples which can help you better understand trading with Heikin Ashi.
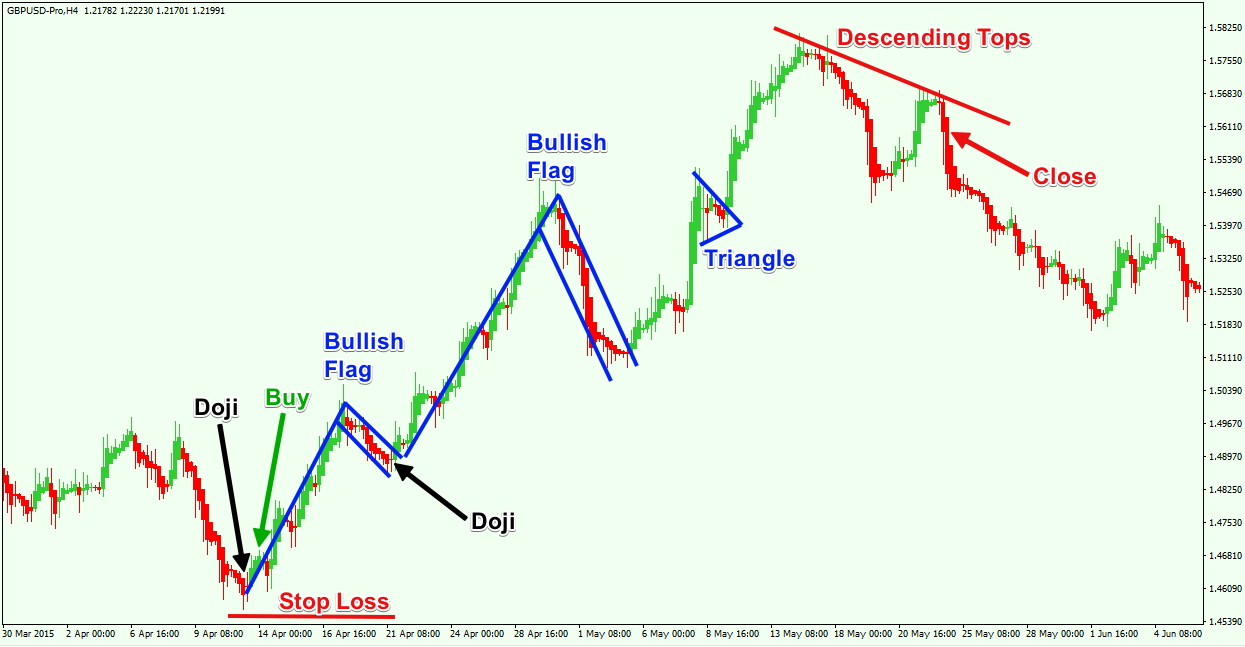
The chart above is the H4 chart of the GBP/USD Forex pair for April – May, 2015.
You see a bearish trend at the beginning of the chart. Suddenly, a Doji candle appears and the price action reverses. You have a buying opportunity when the price reverses after the Doji candle. The stop loss of your trade should be located below the lowest point created at the time of the reversal. The optimal place of the stop is shown with the red horizontal line at the bottom of the chart.
A Doji candle after the down move on the Heikin Ashi chart implies that the price action is likely to reverse or at least stall the downtrend. A big bullish impulse appears afterwards. Then the price reverses. Notice that the reversal resembles a bullish Flag pattern.
At the end of the flag we see the creation of another Doji candle. The price action breaks the upper level of the Flag afterwards and shoots up again. The scenario repeats afterwards. A new flag appears and a new breakout occurs through the upper level. A third bullish impulse is created. On the way up the price consolidates in a triangle. The upper level of the triangle gets broken and the price resumes the bullish move.
The exit from the trade comes when the Heikin Ashi price action creates Descending Tops on the chart. This pattern implies that the overall bullish trend might be reversed.
Let’s now dissect another example of trading with Heiken Ashi candles:
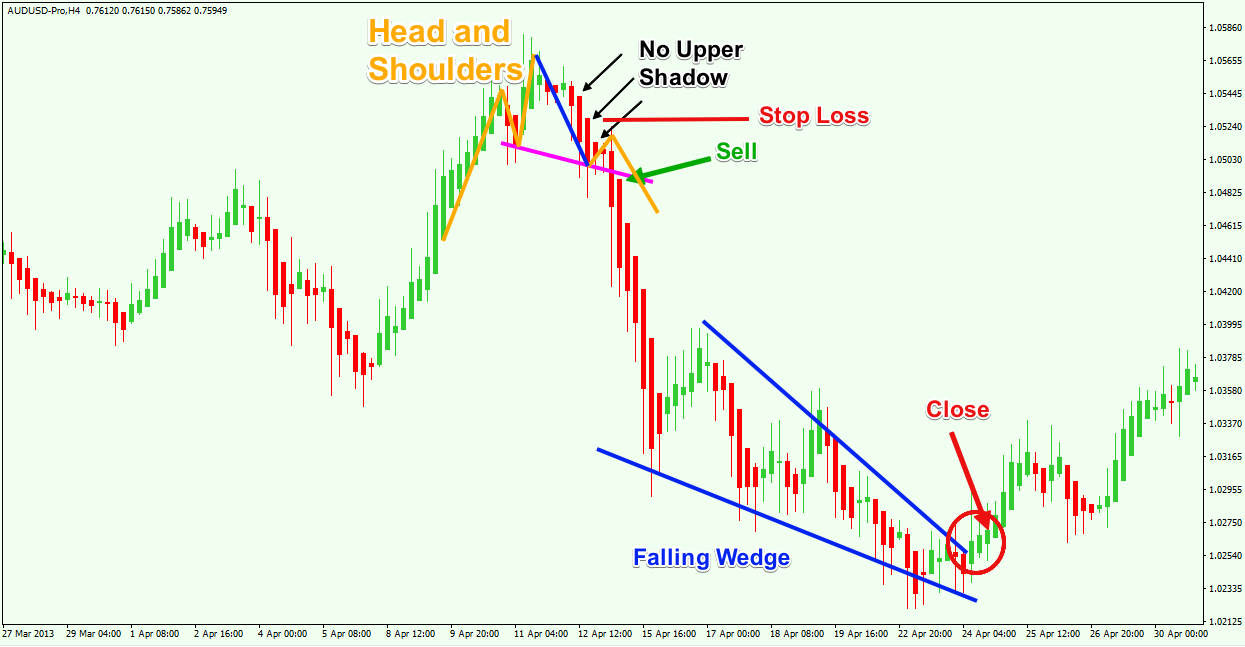
This time we have the H4 Heikin Ashi chart of the AUD/USD Forex pair for March – April, 2013. The chart shows how to apply the Heikin Ashi technique in a short trade.
The orange lines on the chart show a Head and Shoulders chart pattern. Also note the magenta colored neckline plotted. Prior to the creation of the second shoulder we see that the Heikin Ashi price action creates three bearish candles with no upper shadow. This implies that the bullish trend might be in jeopardy. There is a nice short trading opportunity on the chart at the moment when the price action breaks the neck line to the downside.
The stop loss order of this trade should be placed above the second shoulder of the pattern. This is shown with the red horizontal line on the graph.
The price action enters a sharp bearish trend afterwards. The measured move target was completed quickly, but you may not want to close the trade when the price is still trending sharply in the bearish direction. Here it would have proved to be better to hold the trade for further profit.
Suddenly, the price action decreases the intensity of the bearish move. The sharp decrease turns gradually into a Falling Wedge chart pattern. The exit from the trade should come at the moment when the Heikin Ashi price action breaks the upper level of the Falling Wedge pattern.
Notice that both trades were completed using pure price action analysis and nothing else. This is absolutely possible and usually the best method for trading with a Heikin Ashi chart.
Conclusion
- Heikin Ashi is a unique chart type, which consists of candles with a specific calculation.
- The Heikin Ashi Formula consists of four calculations, which respond to Open, Close, High, and Low:
- Open = [Open (previous bar) + Close (previous bar)]/2
- Close = (Open+High+Low+Close)/4
- High = Max Price Reached
- Low = Min Price Reached
- Despite the different calculation, the Heikin Ashi bars look similar to Japanese Candlesticks. The untrained eye might even mistake the two charts for one another.
- The Heikin Ashi chart puts emphasis on the average price action and in this manner on trends. This type of chart smoothes the price action and filters the chaotic peaks and troughs and the price action in general.
- Benefits of using Heikin Ashi:
- The Heikin Ashi chart helps a trader to catch a bigger trend rather than a small price move.
- The candles put emphasis on persistent tendencies rather than small fluctuations.
- Since the Heikin Ashi show naked trends, they can easily be pursued with a Trailing Stop order.
- There are two important aspects to keep in mind on a Heikin Ashi chart:
- Bearish Trends – They are created almost exclusively by bearish candles. Strong bearish trends tend to have no upper shadows in the candles.
- Bullish Trends – They are created almost exclusively by bullish candles. Strong bullish trends tend to have no lower shadows in the candles.
- Some of the common patterns formed on the Heikin Ashi chart include:
- Doji Reversal Candlestick
- Triangle Patterns
- Rising Wedge and Falling Wedge Patterns
- Every Heikin Ashi trading system should include price action rules:
- Look for Support and Resistance levels.
- Look for chart patterns for potential breakouts.
- Hop into emerging trends and exit on slowing trends.