Chart patterns are essential parts of Forex trading technical analysis. One basic on-chart formation is the 123 reversal setup. The 123 chart formation is quite common and appears at the beginning of many every price reversals.
What is the 123 Pattern Setup
The 123 chart pattern is a three-wave formation, where every move reaches a pivot point. This is where the name of the pattern comes from, the 1-2-3 pivot points. At first sight, there is nothing particularly special about this chart pattern. After all, every price move in the market will create a pivot point occasionally right? Yes, but if you have the ability to identify and confirm the 123 pattern, it can help you predict potential reversals.
How Does the 123 Reversal Pattern Setup Look Like
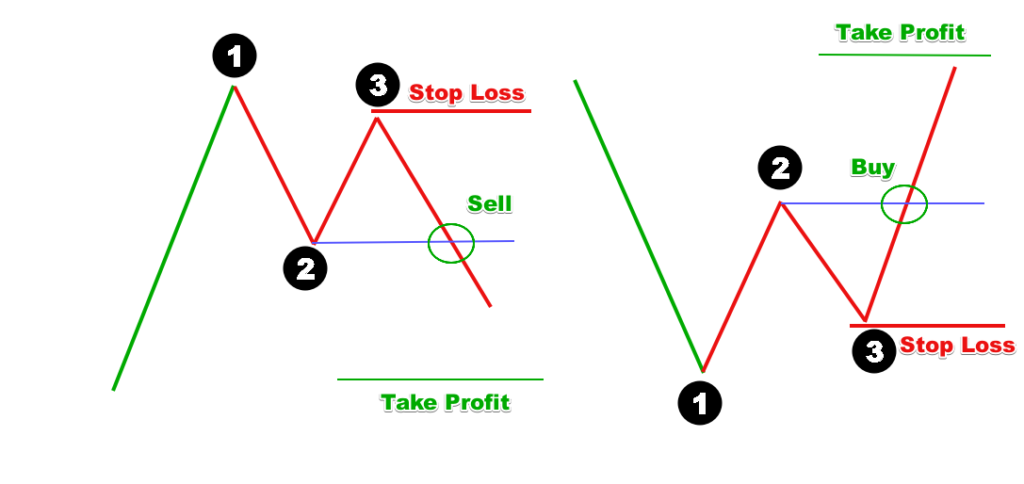
Here is how the 123 reversal pattern appears:
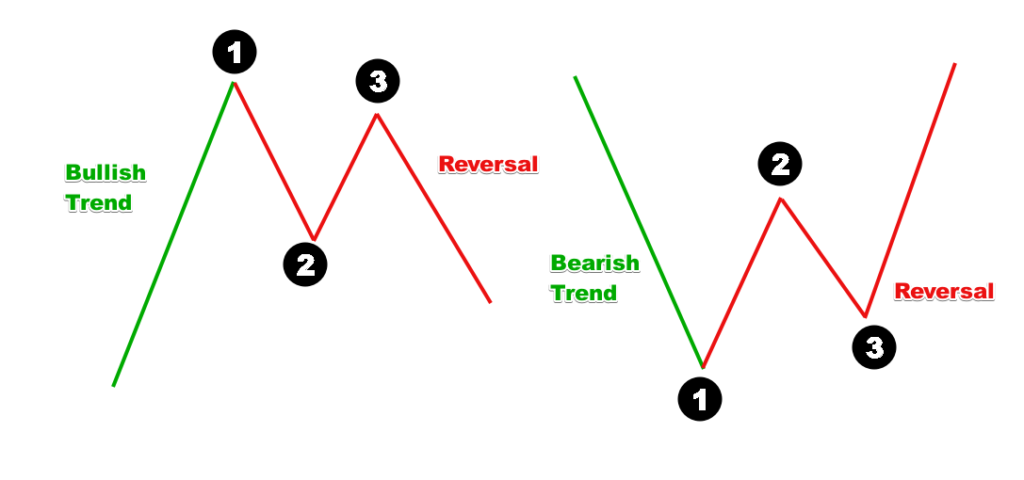
These are the two versions of the 123 reversal pattern. In the first case we have a bullish trend, which reverses into a bearish direction. In the other case, the bearish trend turns into a bullish move.
As you probably notice, the parameters of the 123 trading pattern are the same as with the double top and the double bottom chart patterns. In fact, when approached as a reversal pattern, the 123 setup is indeed either a double top or bottom.
Structure of the 123 Chart Formation
There are three waves associated with the 1-2-3 pattern and one confirmation move. They form three pivot points and a confirmation level.
Pivot Point 1
This is the turning point during a trend. The beginning of every trend correction is a potential Pivot Point 1. If the 123 chart pattern is valid, then the price is very likely to break its previous trend line after creating Pivot Point 1.
Pivot Point 2
The next turning point is very likely to form outside of the previous trendline or channel. This is a good indication that the trend might be ready to end and reverse.
Pivot Point 3
Pivot Point 3 is crucial for the confirmation of the 123 reversal chart pattern. The reason for this is that it is the last component of the setup. In a valid 123 reversal pattern, that point would not exceed Pivot Point 1. Worst-case scenario, it would be at the same level. Pivot Point 3 moving close to Pivot Point 1, but not reaching it is an indication of a stronger 123 reversal pattern setup.
Confirmation Level
The confirmation level is the area, which tells us “Hey! This might be a good opportunity to enter the market based on a valid 123 reversal!” Its location is at the same level as Pivot Point 2. If the price breaks this level, then the pattern is said to be confirmed.
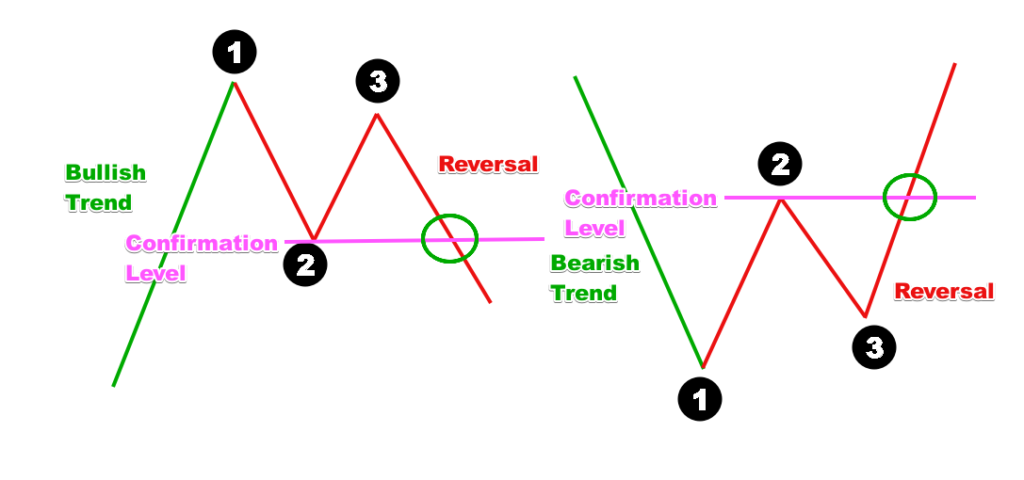
The sketch above gives an example of a reversal confirmation of the 123 chart setup. The confirmation of the pattern is shown by the green circle, when the price breaks the Pivot Point 2 extreme.
Target Level
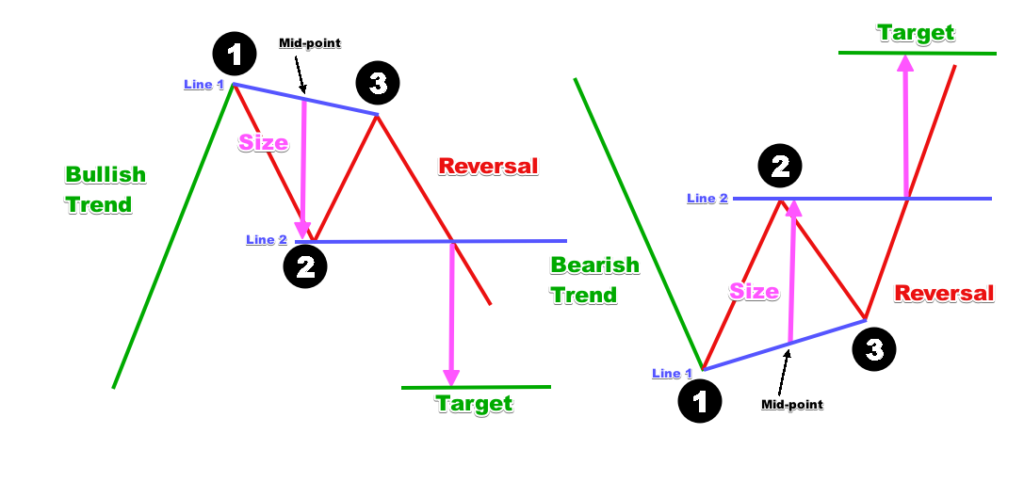
Your target level during a 123 trade should be at a distance equal to the size of the 123 chart pattern. Applying it from the start of the confirmation level will give you your approximate target level.
Measuring the size of the 123 Forex trading pattern
To measure the size of the pattern, you will need to build a couple lines yourself.
Line 1 should connect Pivot Points 1 and 3.
Line 2 is the horizontal level at Pivot Point 2.
The size of your 123 pattern equals the vertical distance between Line 2 and the midpoint of Line 1.
The two purple lines are Line 1 and Line 2 respectively. The pink arrows apply the size of the 123 chart pattern after the price confirms the setup. The green horizontal lines show the area, which we expect the price to enter.
123 Chart Pattern Stop Loss
Always use a stop loss order when trading the 123 chart pattern or any other pattern. Your stop loss order should be placed in the area of Pivot Point 3. Sometimes, volatile market conditions can push the price to go beyond Pivot Point 3 for a short period. Then, the price will return and reverse again. You don’t want to get your stop activated due to this volatility. That’s why the smarter approach here is to put your stop slightly beyond that level.
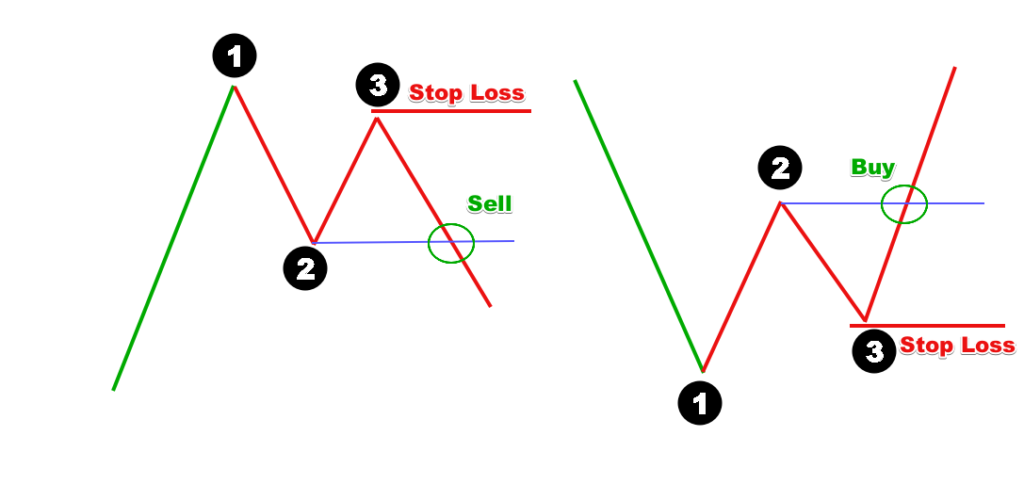
The red horizontal lines on the sketch above show the best area for your stop loss order when trading the 123 reversal pattern setup. If the pattern is bearish, the stop loss should go above the top of Pivot Point 3. If the pattern is bullish, then you should place the stop order below the bottom of Pivot Point 3.
Below, we have also added the approximate area of your take profit order during a 123 trade. Again, this level is calculated using the measured move technique described earlier. You now have all the relevant trading levels for the 123 reversal chart pattern.
123 Pattern Trading Strategy with an Oscillator
The 123 reversal chart pattern combines well with a technical oscillator. The reason for this is that oscillators can help signal extreme values, which can provide confirmation of trend reversals. The idea is to match a reversal signal from the 123 reversal setup with a reversal signal from an oscillator indicator.
Let’s take the Relative Strength Index (RSI Indicator) for example.
If we have a bullish trend and the chart is forming a potential 123 reversal pattern, we will be looking for an overbought signal from the RSI. This way we will attain a stronger reversal signal, which is likely to bring a higher success rate for our pattern.
Contrary to this, if the trend is bearish and we spot a 123 reversal pattern, then we will try to match this signal with an oversold indication from the RSI.
Another signal from the RSI that we can take is the regular divergence signal. Matching 123 signals with RSI divergences will give us a higher probability trade on the 123 reversal pattern.
Also, it’s important to use price action analysis to improve your decision making. After all, the knowledge of another chart pattern emerging can always come in handy.
Let’s take a look at an example of the 123 forex strategy.
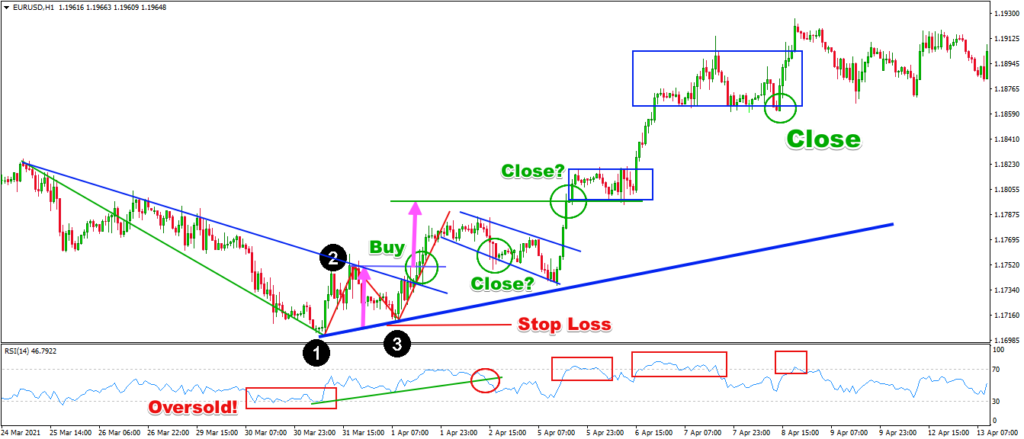
Above you see the H1 chart of the EUR/USD currency pair. At the bottom of the chart, you see the RSI indicator.
The black 1-2-3 dots show the Pivot Points of our 123 chart pattern. Also take note of the formations outlined in blue on the chart. They represent some other chart patterns that we will use during our trade analysis.
Here is what happens:
We spot a bearish trend on the chart (blue bearish line). At the beginning, it might be hard to spot the first two Pivot Points on the chart. However, when the price closes a higher bottom at Pivot Point 3 and then closes a candle above the blue bearish trend line, this triggers some bullish thoughts. At the same time, the first rectangle on the RSI indicator shows an oversold market condition.
Then, suddenly, we see that the price breaks the trigger line of the 123 chart pattern, which we could take as a long signal.
We place a stop loss order below Pivot Point 3 and a take profit order at a distance equal to the size of the pattern (pink arrows).
See that the price doesn’t hit our green take profit line at first. Instead, we see a correction with the shape of a Flag chart pattern (blue bearish channel). Note that at the same time the RSI indicator breaks its green trend line, but it hasn’t reached an overbought area.
Notice that the stop loss order is still intact.
Later on, the price breaks the flag in the bullish direction and hits our take profit line. If you are not trading with a take profit order and relying on price action alone for collecting your profit, here is how you may have analyzed the price action.
The price continues into another correction that is horizontal and then shoots up again. At the same time, the RSI gives a strong overbought signal. The market starts consolidating and we see a candle closing below the lower level of that consolidation. This is a strong signal for closing the trade here.
If you closed the trade at the target line, this would have equaled a profit of around 45 pips.
If you didn’t close at the target level and decided to hold the trade further based on bullish price action conditions, the profit would have equaled 108 pips in this case.
The interesting thing about this trading example is that the 123 reversal chart pattern acts as a double bottom. And we trade it very similarly to a double bottom chart pattern.
The 123 Pattern Setup as a Continuation
Although we are approaching the 123 chart setup as a reversal, it could also act as a continuation pattern. In other words, it could give us a signal that the trend is not reversing. Instead, we might be looking at a flatter correction, which could trigger a new move in the same direction.
Let’s get back to the three pivot points.
After the pattern forms Pivot Point 3, changing the direction of the price, there are two cases, which we need to consider:
Case 1 – Potential Trend Reversal
This is what we already discussed – the 123 pattern as a reversal. The price can break the level at Pivot Point 2, confirming a potential reversal. This will trigger our reversal trade.
Case 2 – Potential Trend Continuation
This is another consideration. If the price fails to break the level at Pivot Point 2, or breaks it slightly and then reverses quickly, then this was most likely a flatter correction. The breakout in Pivot Point 3 will give us a signal that the trend is resuming. In this case you should consider trading in the direction of the previous trend.
123 Continuation Trade Stop Loss
If you are trading the 123 pattern as a continuation formation, then your stop loss order should go beyond Pivot Point 2.
Target of the 123 Continuation Pattern
You should measure the size of the pattern building Line 1 to connect Pivot Point 1 and Pivot Point 3, and Line 2 horizontally through Pivot Point 2. The vertical distance between Line 2 and the midpoint of Line 1 will give you the size of the pattern.
However, since the pattern confirmed a continuation, we need to apply its size in the direction of the continuation. You should take Pivot Point 3 as a starting point of your target.
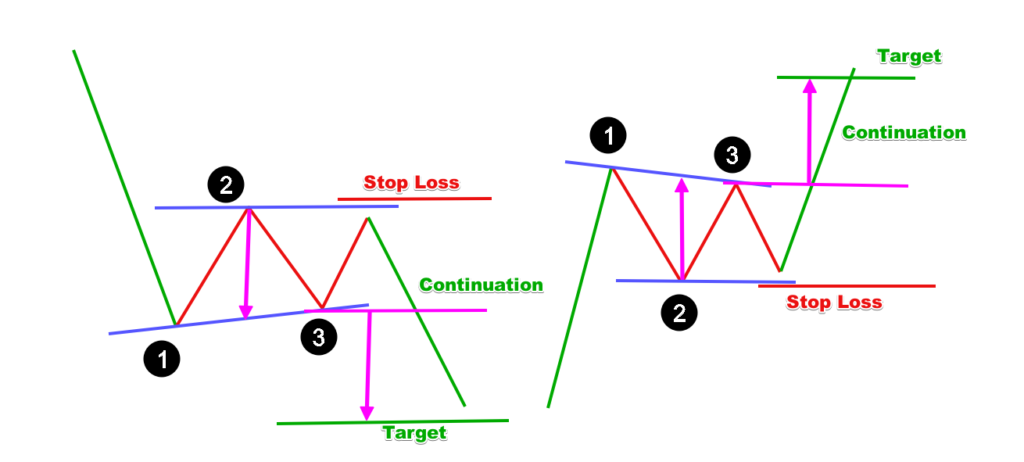
In many cases, the continuation version of the 123 chart pattern will have the characteristics of a wedge, a flag or a triangle.
Trading Strategy with the 123 Continuation Pattern
Let’s apply this variation on the forex 123 pattern strategy with the RSI indicator.
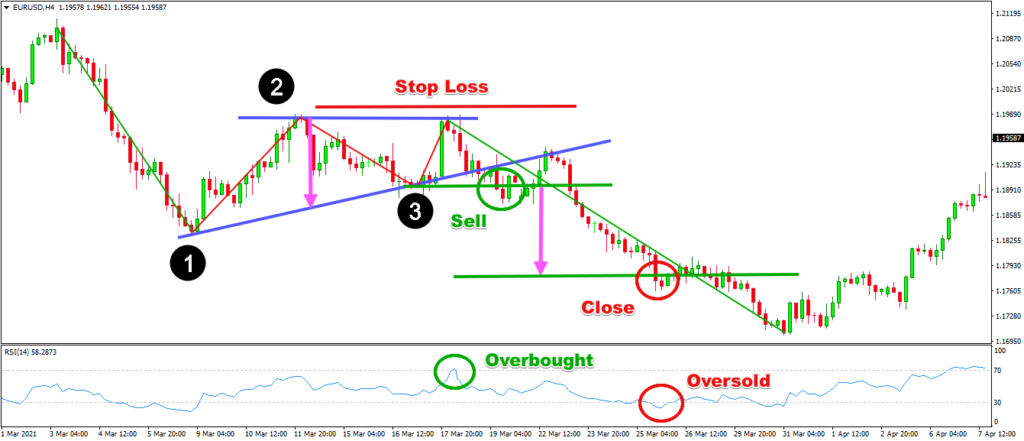
We’ll look at the 4 hour chart of the EUR/USD. Again, we have the RSI indicator at the bottom of the chart.
We have a bearish trend at the beginning of the chart. Then, the price starts consolidating. We confirm the presence of Pivot Points 1, 2, and 3. However, this time the price fails to break the resistance at Pivot Point 2, turns around and breaks the level at Pivot Point 3. In this scenario, we suspect that the 123 trading pattern is very likely to act as a continuation here, and not as a reversal.
At the same time, the RSI indicator gave us an overbought signal, which confirmed the bearish idea on the chart. This is a good opportunity to sell.
The stop loss order should go above the level of Pivot Point 2. We should apply the target downward, starting from the confirmation level at Pivot Point 3. We do this by measuring the size of the pattern and applying it starting from the confirmation level as shown with the pink arrows.
After the confirmation signal, the price creates a correction and turns the support at Pivot Points 1 and 3 into a resistance, which gives an even stronger short signal.
At the time when the target is met, the RSI indicator is giving an oversold signal, which is a good reason to close the trade.
The interesting thing here is that when acting as a continuation, the 123 pattern here resembles an ascending triangle chart pattern. And we trade it as such.
Conclusion
- The 123 chart pattern is a appears frequently in the price action and is often a reversal signal.
- The 123 setup consists of three pivot points.
- The confirmation of the 123 reversal pattern lays at Pivot Point 2. The target when trading a 123 formation is at a distance equal to the size of the pattern, applied beyond Pivot Point 2. Your stop loss should go beyond Pivot Point 3.
- The 123 reversal trading pattern has the structure of a double top or a double bottom.
- The 123 chart pattern combines well with an oscillator – the RSI for example.
- Combining price action techniques comes in handy when using 123 setups.
- The 123 setup could also work as a continuation pattern.
- As a continuation setup, the confirmation of the pattern lays at Pivot Point 3.The target in a 123 continuation forex trade lays at a distance equal to the size of the pattern, applied beyond Pivot Point 3. The stop loss order should go beyond Pivot Point 2.
- The 123 continuation chart pattern has the structure of a triangle, a wedge pattern or a flag pattern.