The Commodity Channel Index is an indicator used in the technical analysis of the financial and forex markets. The CCI indicator, short for commodity channel index is a momentum based indicator and belongs to the oscillator group of technical indicators.
Invented by Donald R. Lambert, the indicator’s workings and details were first published in a technical analysis journal called Commodities in 1979. Mr. Lambert was not a trader, but rather came from an academic background. He had degrees in mathematics, statistics and accounting, which helped him in formulating the commodity channel index.
Mr. Lambert developed the commodity channel index to identify the cycles in the commodity markets. This is where the indicator partly gets the name “Commodity.”
Although the commodity channel index indicator was developed to analyze the commodity markets, it is now widely used across multiple assets; from stocks and ETF’s to futures and spot forex.
As a momentum based indicator, the CCI index belongs to the oscillator group of indicators. Such indicators typically move around fixed values and can depict changes in volume or momentum. The most common values of the oscillator range from 0 to 100, or -100 to +100.
Such indicators are typically placed in the sub-window below the price chart. Indicators like the CCI index are used in forex trading to mainly identify overbought and oversold conditions in the market, but it can also be applied in various other ways as well.
Aside from identifying the overbought and oversold conditions (OB/OS), you can also use the CCI in fx trading to measure the strength of the trend. Alternately, forex traders also use the cci indicator to warn about extreme market conditions (when trends are the strongest or weakest).
Many beginners in forex trading usually apply a technical indicator using a uniform set of rules. Traders then apply the rules blindly regardless of whether the markets are trending or ranging. No wonder then that most beginners complain that indicators such as the commodity channel index do not work as expected.
What many do not know is that indicators such as the cci index can behave completely different to changing market conditions. Therefore, using them in a standard way will not result in optimal results.
This lesson will help to clear any confusion you might have about using the cci indicator or a cci trading strategy. It will also help you to understand the math behind how the cci indicator values are calculated.
You will also learn how to properly read the technical signals from the forex cci indicator. Last but not least, you will know how to apply this knowledge and how to improve your technical analysis when using the commodity channel index indicator.
What is the CCI indicator?
The CCI indicator or the commodity channel index indicator, as we have just learned is an oscillator. The CCI indicator oscillates between fixed levels of +100 and -100. Other settings that can be used are +200 and -200 with a lookback period of 14. When the forex cci indicator rises above the standard +100 or falls below -100, it signals overbought and oversold levels in the market. Below is the cci indicator in Metatrader. It is one of the many standard indicators that are available by default, so you do not have to download any custom indicators.
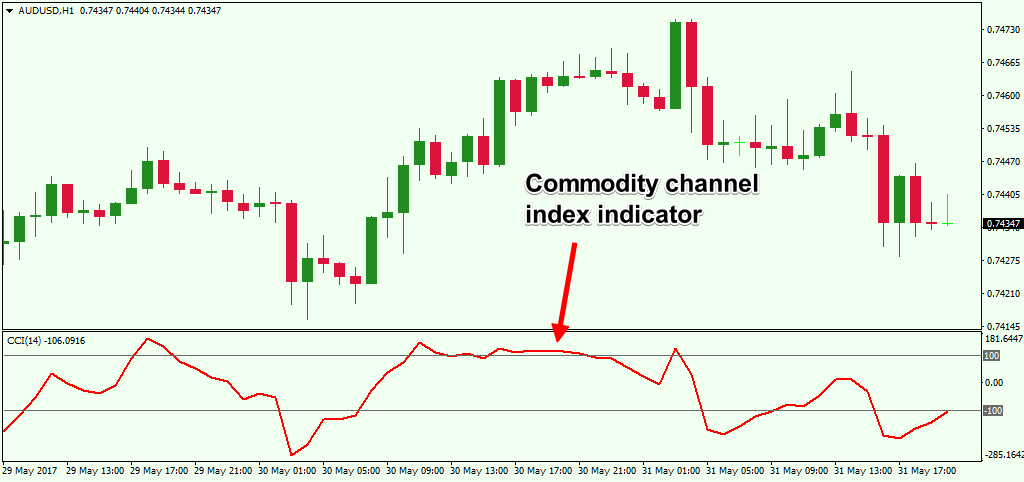
Figure 1: The Commodity Channel Index indicator
The forex cci indicator belongs to the group of oscillators that measures momentum.
But what is momentum?
In physics, momentum is described as the quantity of motion in a moving body. Momentum is measured by mass and velocity. You might now be asking, how a concept in physics made its way into the forex markets? When it comes to the financial markets, forex for example, momentum takes a slightly different meaning. However, the overall concept remains the same. In finance, momentum is described as the tendency for a security’s price that is rising, to continue rising or a falling price to continue falling.
Let’s go through a simple illustration of momentum. Imagine you are riding a motorbike. When you increase the accelerator, you put some effort (the engines begin to draw more gas, and the pistons drive the machine). After a while your motorbike starts to speed up. Now, even if you ease back on the accelerator, the momentum that was built, will continue to keep the motorbike moving forward (even without any effort). At some point, as momentum starts to wear off, your motorbike starts to slow down as well. Eventually your motorbike comes to a standstill.
The cci forex indicator simply calculates and visually depicts how fast prices are rising or falling. The speed at which the price of a security rises or falls will tell you whether price will continue moving in that direction or not.
Of course, when momentum wears off, you can expect price to pull back; either make a correction or reverse trend completely or even move sideways.
It is as simple as that.
Understanding the CCI indicator settings
The CCI indicator has three variables that you can change.
- Period
- Type of price
- Levels
Period: The period in the cci indicator setting is used to set the number of look-back periods. The standard cci setting is 14 periods. This value can be changed based on the forex cci strategy that you use.
Type of price: The type of price is a drop down that you can select. The standard setting is Typical price. Typical price is simply the average of the High, low and close.
Typical price = (H+L+C)/3
Levels: Last but not the least, are the levels in the cci indicator. By default, the levels are set to -100 and +100. These values can of course be changed as well.
In Figure 2, you can see the CCI indicator in the metatrader trading platform. We use only the default values to keep things simple.
We have the standard forex cci indicator with the default settings which is a 14-period lookback period. This serves as the basis for calculating the cci data for the past 14-periods. (If applied on the daily chart this would be 14-days or if applied on a 1-hour chart, this would be the past 14 hours).
The typical price, which is the High Low Close average is used as per the original cci calculation and the values of +100 and -100 are set for the cci indicator.
What we can observe is that when the cci index rises above +100, it indicates strong upside momentum (price will continue moving in the same direction). Similarly, when the cci indicator falls below -100, the indicator suggests strong downside momentum and signals a continuation in the decline in price.
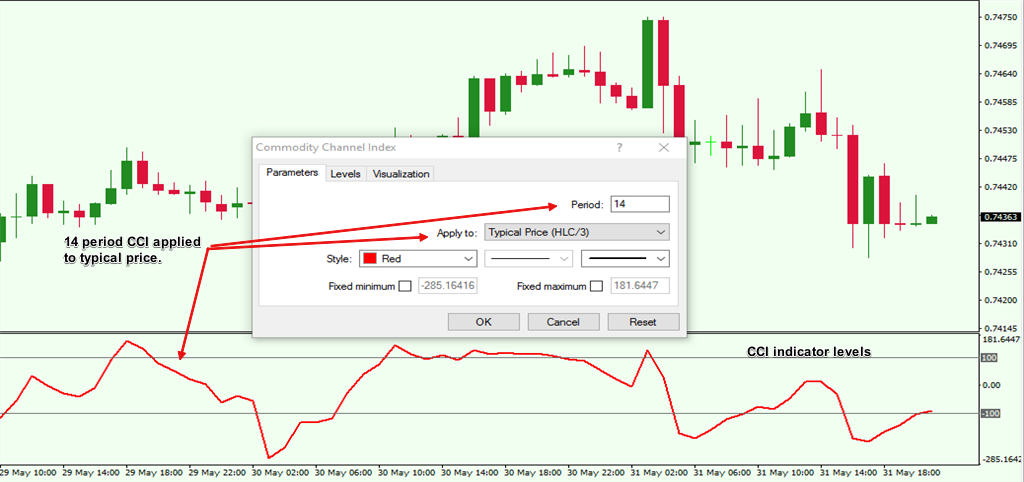
Figure 2: CCI indicator in metatrader with default settings
Understanding the cci calculation
So far we have learned what momentum is, and how the cci indicator is used to signal the momentum in price. Now, it is time to understand the cci calculation to get a complete view of how the indicator plots the values.
The cci indicator uses the following mathematical expression to calculate momentum:
CCI = [(Typical Price – 20-period SMA of the Typical Price) / (0.015 x Mean Deviation)]
Typical price = (High + Low + Close)/3
20-period simple moving average (SMA) is the simple moving average of the typical price for the past 20 periods.
0.015 is a constant that is used to adjust or smooth the CCI values so that it falls within the -100 and +100 values
Mean deviation is derived by subtracting the 20-period SMA value of the typical price from the typical price. The values are then summed up and divided by the total number of periods, (which is 20).
If the above calculations look a bit complicated, do not worry. The main takeaway you should concern yourself with is that the CCI indicator uses the typical price and measures it against the 20-period simple moving average value.
The result is then divided by the constant (0.015) so that the CCI falls within +100 and -100 most of the time and the mean deviation shows how far price has deviated from its mean price.
Generally, when momentum in price is strong, you can expect a deviation from the mean price. As long as the momentum exists, price will continue moving in that direction (rising or falling).
But, when momentum slows (as shown by the CCI value above +100 or below -100), you can expect price to revert to the mean. Or simply, a correction in the most recent price trend.
In summary, the CCI calculation measures how fast prices are rising or falling, by moving within the fixed levels mentioned.
Now that we understand how the cci indicator works, the next step is to know how the cci indicator is used.
What is the CCI indicator used for?
A CCI trading system can be built in the following three ways, depending on how the markets are behaving.
Using the CCI as a trend indicator
The CCI trend indicator can be used to signal the strength of the trend. When a trend exhibits strong momentum, there is a high probability that price will continue rising or falling.
This means you can expect price to continue in the same direction. So, the next time you want to know how strong the trend of a security is, simply look at what the cci indicator is suggesting.
Using the CCI as a trend indicator is ideal when combined with other trend indicators such as moving averages. This can help you to pick bottoms in a rally or tops in a decline. In other words, using the cci as a trend indicator, you can time your entries within a trend.
In figure 3, this is explained visually.
You have the 50 and 20 period exponential moving average (EMA) applied to the price chart. When the short term moving average (20) is above the long term moving average (50), it signals an uptrend.
Now, using the CCI indicator, you can see that the bullish momentum is renewed every time the CCI falls below the -100 level.
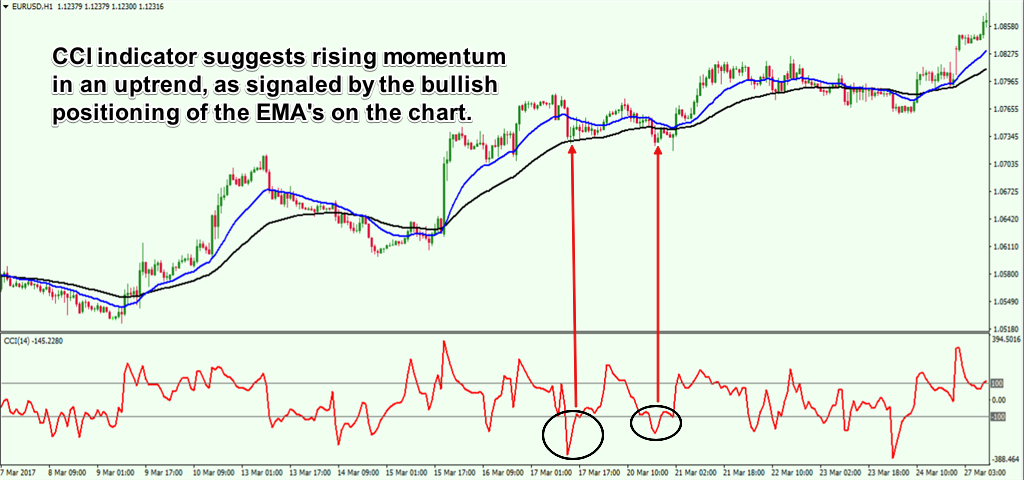
Figure 3: The CCI as a trend indicator
When the CCI indicator starts to rise back above -100, the bullish trend resumes, thus giving traders a good level to enter the trend.
How can you use the cci trend indicator? Using the cci as a trend indicator can help you to time your entries into a trend. Instead of buying at the top or selling at the bottom, which usually happens with most traders, the CCI index can signal to you when the best time is to enter a trend.
Using the CCI to spot divergence
As with most other oscillators, the CCI indicator can also be used to spot divergence. In this context, you can compare the price highs or lows to the CCI index values.
Generally, lower lows or higher highs (or higher lows and lower highs) in price should reflect in the CCI posting the same values. When there is a discrepancy when comparing the highs and lows, you can expect the cci divergence to result in a price correction.
When a cci divergence occurs, it usually coincides with a slowdown in momentum. And we know that when momentum slows, price will most likely stall or reverse direction.
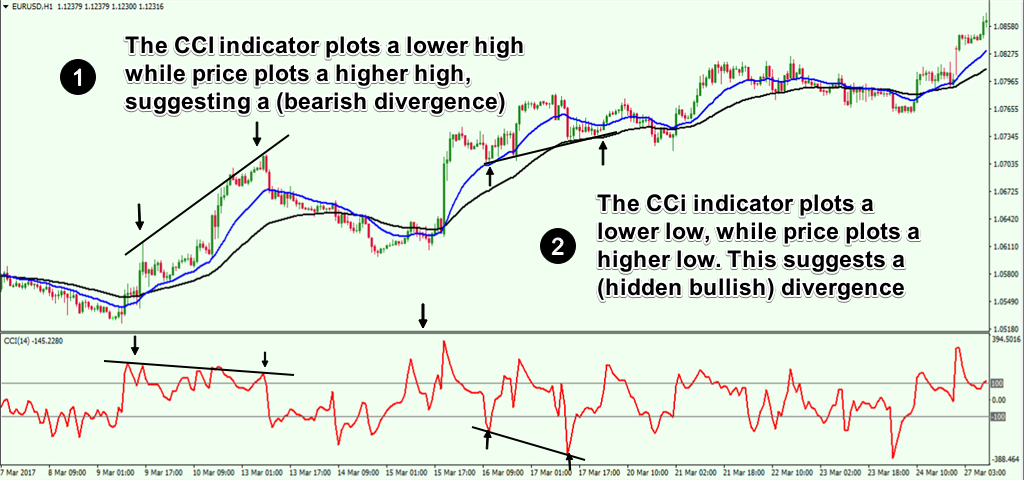
Figure 4: CCI divergence indicator
In figure 4, you can see the CCI divergence pattern at work. In the first instance, price plots a higher high. This should mean that the CCI indicator should also be plotting a higher high. Instead, we get a lower high in the cci index, which signals a regular bearish divergence.
This signals that the momentum is fading and therefore we can expect price to fall.
In the second instance, you can see something different.
Here, price plots a higher low, but the CCI plots a lower low. This is again divergence at work and suggests that the momentum is starting to rise again. For the above chart, this means that the currency pair is resuming its bullish trend.
How can you use the cci divergence indicator? The CCI can signal divergence to price. When this occurs, it is a warning to the trader that price is likely to undergo a correction.
In some instances, a trend change can also occur. Therefore, it is of utmost importance that traders pay attention when the cci divergence occurs.
Using the CCI to identify overbought and oversold levels
When the markets are range bound, the CCI can be used to signal overbought and oversold conditions. This can be especially useful for traders who want to trade breakouts or to trade within the ranges.
The best way to trade the overbought and oversold conditions with the cci indicator is to first identify a range or a sideways market. Once you do that, look for the highs and the lows that are established by price action.
Then, once price reaches the upper range, look for the CCI to signal exhausting momentum. This means that the CCI must be falling after rising above +100 level. Similarly, when the price is at the lower range, the CCI must be rising from -100 after initially falling below this level.
The range breakouts can be traded, when you can see price breaking past the previous range high and the momentum is strong. Here, the CCI will be rising above +100. To the downside, when price is breaking past the lower range, look for the CCI indicator values to fall below -100.
Figure 5 illustrates how the forex CCI indicator is used when the markets are moving sideways.
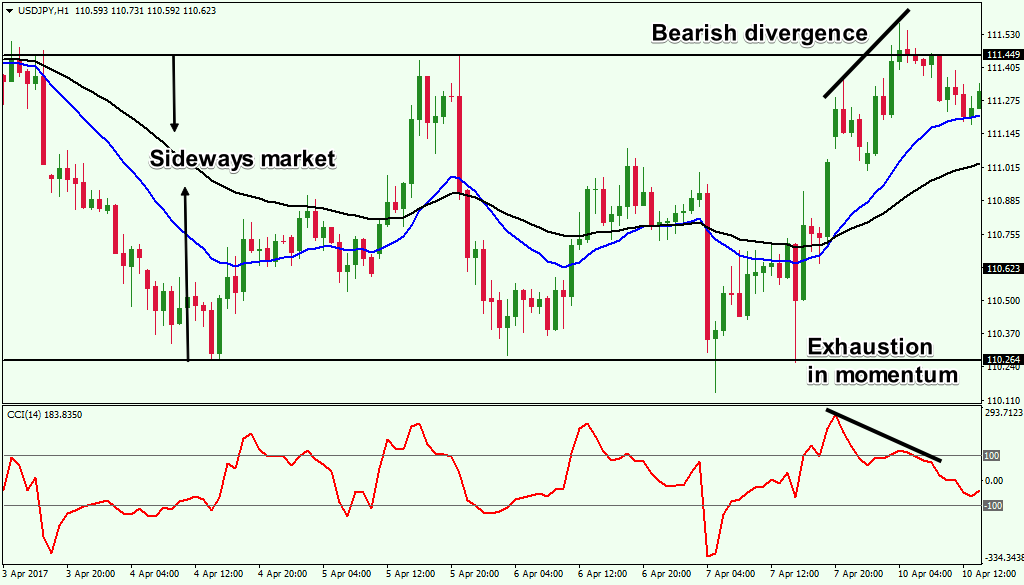
Figure 5: CCI indicator for overbought and oversold conditions
In Figure 5, we first plotted the horizontal range that was established by the markets. We can see that this is a range bound market.
The CCI’s application can be used to spot whether the momentum is sustainable for price to either breakout from the range or reverse near one of the two levels.
In the first instance, price attempts to rally to the range high. But notice the falling momentum as the CCI indicator turns back below +100. Furthermore, we also notice divergence in price. Combined, this information tells us that the market will most likely be moving back lower.
In Figure 6 below , we have extend the price action further.
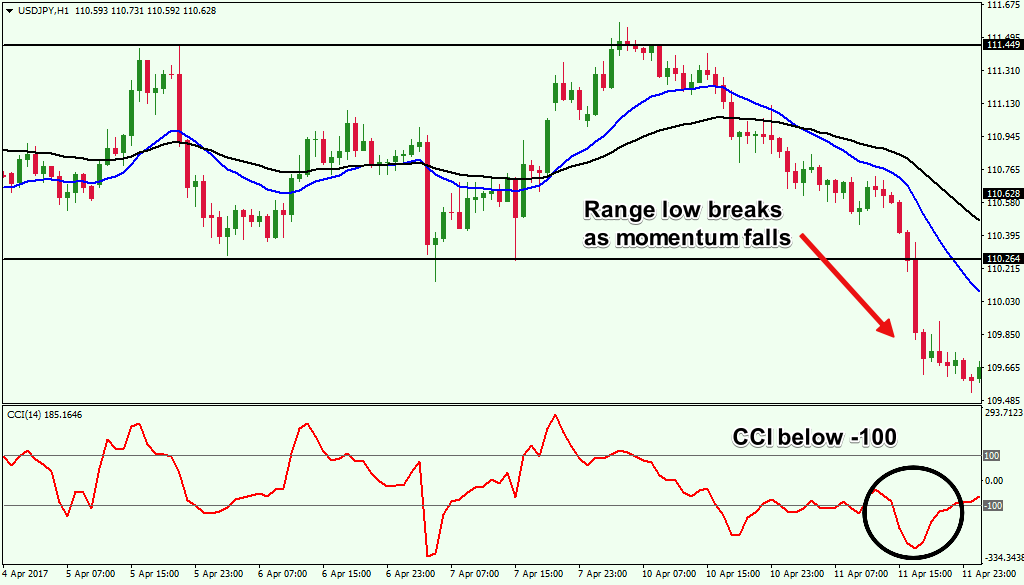
Figure 6: Price Breaks to the Downside with CCI Reading below -100
We can see the break of the lower range. In this case, notice how the CCI indicator falls below -100 and stays there. This signals a strong bearish momentum. Price continues to extend lower as a result.
A CCI forex trading strategy is generally used in one of the three ways outlined above. By considering how the markets are moving, you can use a CCI trading system accordingly and look at making an objective analysis of the markets.
Conclusion
As described in this article, the CCI indicator is a powerful tool that traders can use as part of their technical approach.
While the commodity channel index indicator might seem similar to most other oscillators, it is unique due to the fact that the indicator is used to measure price momentum based on the typical price. A typical price which considers the high, low and close price is a better measure of momentum than just closing price.
Closing prices are usually used with other oscillators such as the Relative Strength Index (RSI) and this is where the CCI indicator differs.
Having a good understanding of how to use a cci trading strategy can help traders in several ways. For one, you don’t have to look at adding more redundant indicators to your chart as we have learned how the cci calculation is done.
However, it is important to point out that the success in forex trading is only partly due to the trading system you are using. A cci trading system is no different. It is essential that other factors are also considered, including careful attention to your risk management and analyzing the underlying fundamentals that govern the price.