Among the wide variety of specific approaches within technical analysis, the use of technical indicators continues to be a popular approach. The simplicity and ease of using indicators as well as the diverse range of tools to choose from, means that many traders, from new traders right through to experienced pros, choose technical indicators for their versatility and effectiveness in analysing and trading the markets.
The majority of technical indicators focus on key areas such as momentum, trend direction, volume and volatility. While there are a great number of traditional indicators, the main ones simply focus on these four core areas. It is these indicators which form the foundation of the majority of technical indicator usage and within trading systems built around technical indicators, these tend to be the most widely used.
What Is the Mass Index Indicator?
In this article, we are going to focus on one indicator in particular, the Mass index Indicator. The MI indicator is an in-built tool which can be found on most trading platforms. We’ll walk through what the indicator is, how it’s calculated and how we can trade it, along with some special considerations to be aware of.
Mass Index Indicator
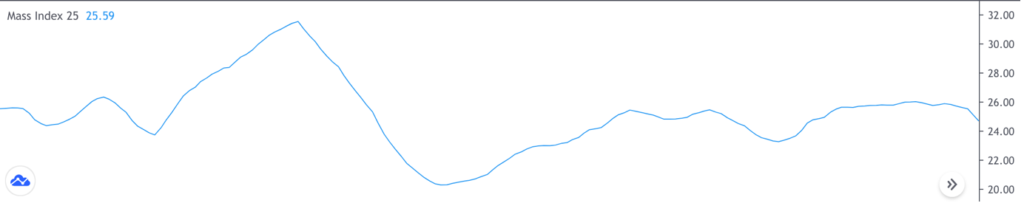
The MI indicator, shown above is what is known as a trading oscillator and is used to forecast the likelihood of trend reversals. The mass index calculation basically uses a 9-period exponential moving average of a specified range (highs to lows). The indicator then calculates a 9-period EMA of that value and divides the first value by the second. Finally, the indicator will add the values given for the specified number of periods which, as default standard, is set to 25 in the mass index settings.
Now, if that seems a little complicated, do not fear – the great thing is that the indicator performs this calculation for you and then plots the updated values as the indicator line shown on the image above.
So, now you know how the MI indicator is calculated, next you need to know what it is telling you and why it is useful. The premise of this indicator is that when the indicator line crosses above the 27 threshold and then crosses back below to 26.5, this suggests there is the risk of a trend reversal.
So, in some ways we can think of this indicator as being similar to the RSI or Stochastics, whereby the indicator crossing beyond a certain threshold highlights the risks of a forthcoming reversal.
Now, the key thing to point out here is that, unlike the RSI or Stochastics indicators which have thresholds both above and below, the MI indicator only has an upper threshold which is used to indicate a potential trend reversal in either direction.
So, if the market is moving higher and the indicator crosses above and below the threshold, this suggests the risk of a bearish reversal. Alternatively, if the market is moving lower and the indicator crosses above and below the threshold, this indicates the risk of a bullish reversal. So, it is only the 27 threshold which we need to pay close attention to.
Another interesting point is that the original developer of the indicator, Donald Dorsey intended this indicator to be used as a guide only. This means that the indicator is not to be used in isolation, merely as a warning signal for potential reversals.
Dorsey essentially conceived that the indicator would be used in conjunction either with other indicators or with other aspects of technical analysis. So, let’s now take a look at some different examples of how we can incorporate this indicator with other indicators and technical elements to identify trading opportunities.
How to Trade Using the Mass Index Indicator
The first mass index trading system we will look at is combining the MI indicator with basic support and resistance levels. Support and resistance levels are an incredibly simple yet effective way of framing and trading the markets. Support levels essentially highlight areas where there is demand in the market and offer us areas for potential buy trades. Resistance on the other hand highlight areas where there is supply in the markets and offer us areas for potential sell trades.
So, given that these levels highlight potential reversal areas where we can look to set trades and given that the MI indicator highlights a potential reversal in the market, this means we can look to highlight confluence between an MI indicator signal at a key support or resistance level to give us a trade entry.
Bearish Trade Example Using Mass Index Indicator & Resistance Levels
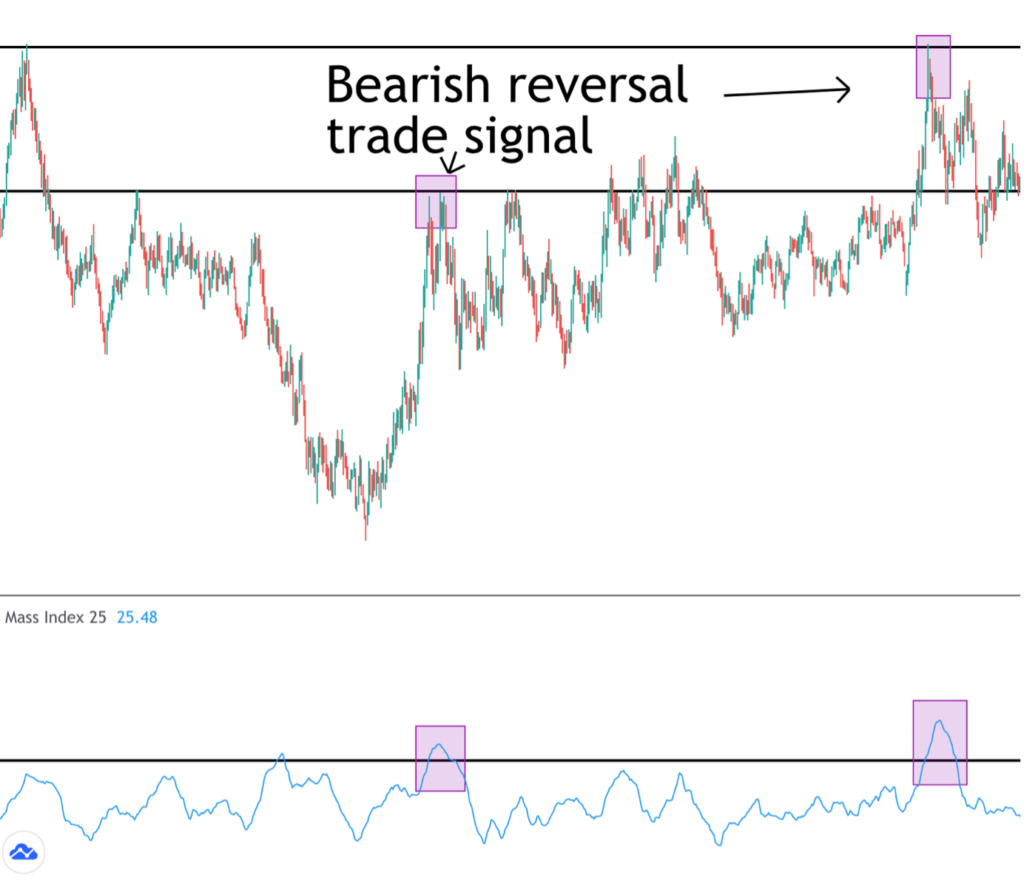
So, in the image above you can see a great pair of examples showing this mass index trading strategy in play. You can see that we have two big resistance levels marked up on our charts and highlighted are the two instances where price tests the resistance levels and is also accompanied by a reversal reading on the MI indicator.
So, in these scenarios we would mark up our resistance levels and then wait for price to test them, anticipating that we get a short (sell) opportunity. We then look for the MI indicator to confirm the trade by rising above and then back below the threshold. You can see these two instances highlighted on the chart above and the reversals which occur subsequently.
So, the way we would trade this set up is quite straightforward. We essentially look to enter the reversal as the MI indicator crosses back under the threshold. We then place our stop loss above the price-high registered at the reversal point and look to target a minimum of twice our risk.
Targeting a minimum of twice our risk is a standard practice that can be used across all trading strategies and setups and helps increase our chances of achieving and maintaining positive risk-reward in the long run, which increases our chances of success.
Bullish Mass Index Indicator Trade
Now, in the exact same way that we can employ the indicator when taking a bearish trade at resistance levels, we can also use the indicator in this way to take a buy trade at a support level. Once again, the important thing to remember is that we are looking to establish confluence.
So, in the bullish scenario, we want to see the market moving lower into a support level where we anticipate we will get a buying opportunity. We then want to identify a confluent bullish reversal signal on the MI indicator by seeing the indicator cross above and then back below the threshold. This creates our buy signal.
Bullish Trade Example Using Mass Index Indicator and Support Levels
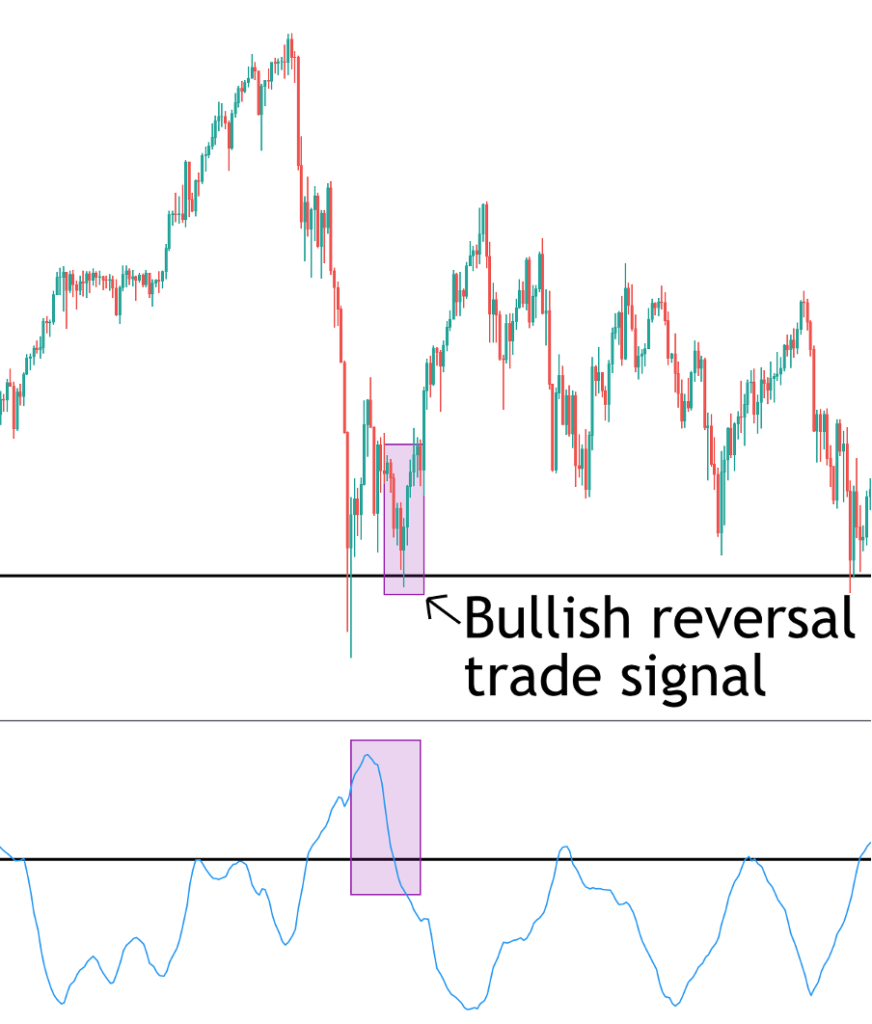
So, on the chart above you can see a great example of this mass index strategy at work. So, we have our support level marked up from the first big price low on the left. We then monitor the market as price comes back down to test the level and remember we are waiting to see the MI indicator cross above the threshold and then back below.
Now, the great thing about this example is that it really highlights just how powerful the MI indicator can be when used as part of a system like this. If we were looking to just trade the level on a standalone basis, we likely would have lost our buy trade as you can see that price blows through the level before reversing and trading back above. However, because we wait to enter until the indicator has crossed back below the threshold, we actually avoid this phase of the price action.
Additionally, you can see that price attempts to reverse first of all but fails and comes back down to test the level once again before we see our proper bullish reversal. However, once again the indicator keeps us out of this period of the price action because we don’t see the indicator crossing back below the threshold until a little later at which point, we get our proper reversal higher. So, this is a great example of how useful the indicator can be in helping us time our entries.
Combing MI Indicator with Other Indicators
Now, as we mentioned during the introduction to using this indicator, along with combining the MI indicator with simple technical analysis methods such a support and resistance, we can also combine the indicator itself with other technical indicators. Combining indicators like this is a great way to easily start to build trading systems. Using multiple indicators to measure and forecast the markets improves your chances of catching successful trade entries.
Obviously, with the wide range of trading indicators available it is important to pick your second indicator carefully. The best method is to look to combine your favorite indicators. So, if you already have a particular indicator which you like using, look to see how you can incorporate this indicator with the MI indicator.
Using Parabolic SAR with Mass Index Indicator
Alternatively, one indicator which works particularly well with the Mass Index trend indicator is the Parabolic SAR indicator. The reason these two indicators work so well in conjunction with one another is that both indicators highlight potential reversal points. While the MI indicator is an oscillator which plots its reading in the sub panel of your price chart, the parabolic SAR indicator actually prints directly onto your charts.
Essentially what the SAR indicator does is highlight the level in the market which price needs to break to confirm a reversal. So, when price is trending higher the indicator will plot dots onto the chart below the current price level, this highlights the level price needs to break to confirm a bearish reversal.
Similarly, if the market is trending lower, the SAR indicator will plot dots onto your price chart above the current price level. This highlights the level price needs to break to confirm a bullish reversal.
Hopefully now you can understand why this indicator works so well with our MI indicator. So, we have the parabolic SAR indicator plotting the specific price level which price needs to break through confirming a reversal and we know that if the MI indicator crosses above and back below the threshold, this indicates a forthcoming reversal. So, the confluence of getting two of these signals together is a pretty powerful reversal signal that can provide for some really great trading opportunities.
Bearish SAR & Mass Index Trade Example
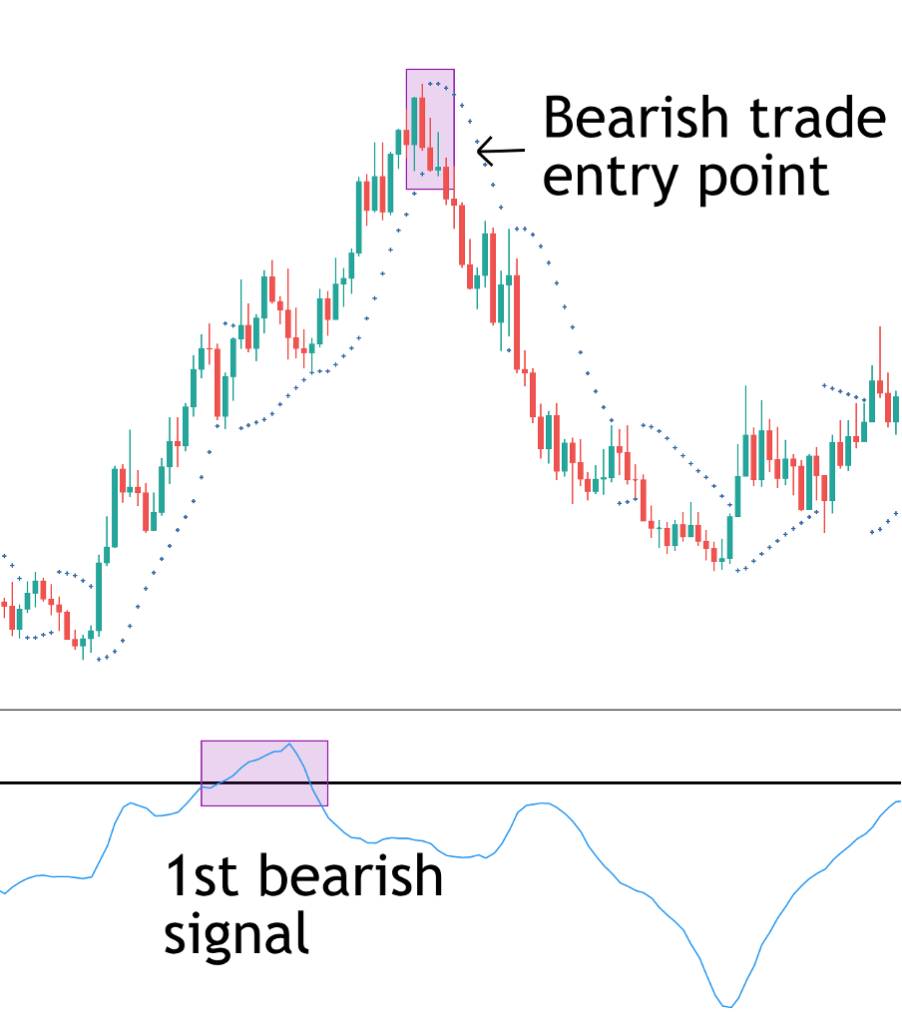
So, in the chart above you can see a really great example of this dual indicator system in play. You can see that initially price is trending higher with the SAR indicator highlighting this by plotting dots below the ascending price action. This shows us the level price would have to reverse below to signal a bearish reversal.
Now, you can see that midway up the move the MI indicator crosses above and below the threshold. This indicates to us that a bearish reversal is potentially coming. The most important thing here, and it’s a great example of why Dorsey (the man who developed the indicator) wanted it to be used with other methods and not as a stand-alone system, is that price continues to trade higher after the MI signal.
However, as we keep tracking price action we can see that shortly after we get the MI signal you can see that price keeps trading higher, however we then see a reversal lower and price breaks through the SAR level and the dots shift above price action, showing us that the market has now entered a bearish mode. So, at this point we have our confluent signal.
The MI indicator highlights the potential bearish reversal we need to be on the lookout for and then the reversal below the SAR level confirms the level and gives us our trade entry point. So, once price breaks through the SAR reversal point, we can go ahead and enter a short trade. We then place our stop above the price high formed ahead of the reversal and look to target a minimum of twice our risk as usual.
Alternatively, given what we know about the SAR indicator (that price has to break above the dots to confirm a bullish reversal) another way we can manage this trade is to keep the short trade open until price breaks above the SAR dots. This gives us the opportunity to potentially catch a longer trade if a fuller reversal develops.
Bullish SAR & Mass Index Trade Example
So, in exactly the same way that we use the MI indicator with the SAR indicator to highlight bearish trades, to find bullish trades we just switch the logic around slightly. So, for a bullish trade we want to see price initially trending lower as highlighted by the SAR indicator plotting reversal points above the price action, telling us where price needs to rise to in order to confirm a bullish reversal.
We then monitor our MI indicator and wait to see it cross above the threshold and then back below. This warns us of a forthcoming reversal. The confluence of these two signals occurring at the same time gives us our bullish entry point.
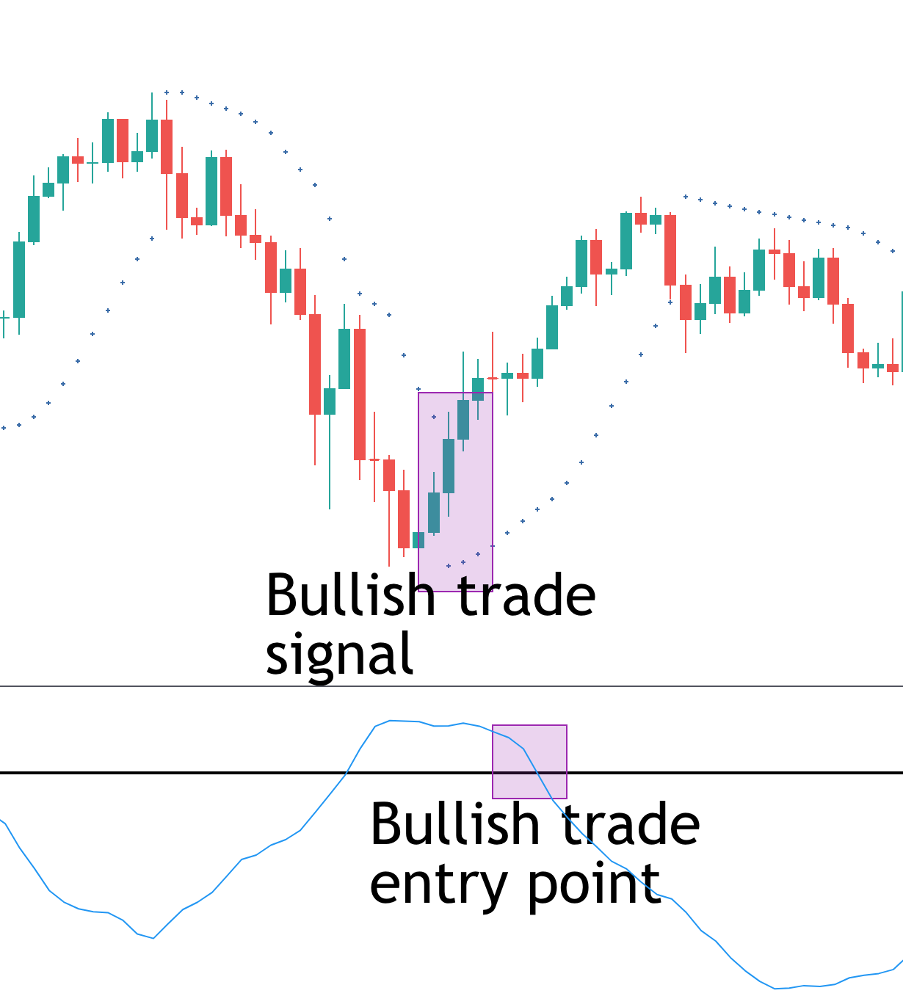
So, looking at the chart above you can see an example of this system in place. So, price is trending lower initially with the SAR plotting dots above the price action. We then see the MI indicator cross above the threshold. We can then see at the point that the MI indicator crosses back below the threshold, giving us our bearish mass index signal, price has broken above the SAR indicator points, confirming the bullish reversal.
So, once we have these two signals in place, we can go ahead and enter our buy trade, capturing the reversal higher. In this instance, the MI crossing back below the threshold gives us our trade entry point because the SAR has already crossed. So, remember, whichever indicator crosses first gives the signal and then the other indicator confirms the signal when it crosses. We only trade once both signals are present.
Conclusion
So, now we have looked at exactly how we can use the Mass Index indicator to trade in conjunction with basic technical elements such as support and resistance. We have also looked at a more advanced system, using the indicator in conjunction with the parabolic SAR indicator. Both systems are highly effective yet straightforward ways of incorporating this fantastic indicator into your trading.
The great thing about the methods discussed here are that they can be used with any trading instrument and on any timeframe. So, whether you like to trade stocks, forex, commodities or bonds and whether you are a higher timeframe swing trader or a short-term scalper, these methods using the mass index indicator will work just as effectively.