The money flow index indicator is a popular trading indicator that is quite useful in predicting market turning points. It has many similar characteristics to other momentum based oscillators but is unique in that it incorporates a volume component into its calculation. We will devote this article to discussing all aspects of the money flow indicator and present some ideas for effectively trading with it in the market.
Money Flow Index Indicator
The money flow index indicator, commonly referred to the MFI oscillator, is used to help measure the buying and selling pressure within a financial instrument. As with many other momentum based oscillators, the MFI oscillates between the values of 0 and 100. However, unlike many other traditional momentum oscillators, the MFI oscillator takes into account volume as well as price. Because of this, the MFI indicator can be viewed as a volume -weighted Relative Strength Index indicator.
This indicator provides many of the same types of trading signals that are the staple of most other technical oscillators. This includes providing overbought and oversold signals as well as regular bullish and bearish divergence signals. Generally, for the overbought trading signal, the MFI reading should reach a level above 80, and for an oversold trading signal, the MFI reading should reach a level below 20.
As for the MFI divergence signals, a bullish divergence would occur when the price makes lower lows, while the MFI indicator is making higher lows. And similarly, a bearish divergence would occur when the price is making higher highs, while the MFI indicator is making lower highs.
The money flow index indicator is generally used as a reversal signal. That is to say that traders will seek to fade an uptrend when the MFI indicator reaches an overbought level or when a bearish divergence signal occurs. Similarly, traders will seek to fade a downtrend when the MFI indicator reaches an oversold level or when a bullish divergence signal occurs.
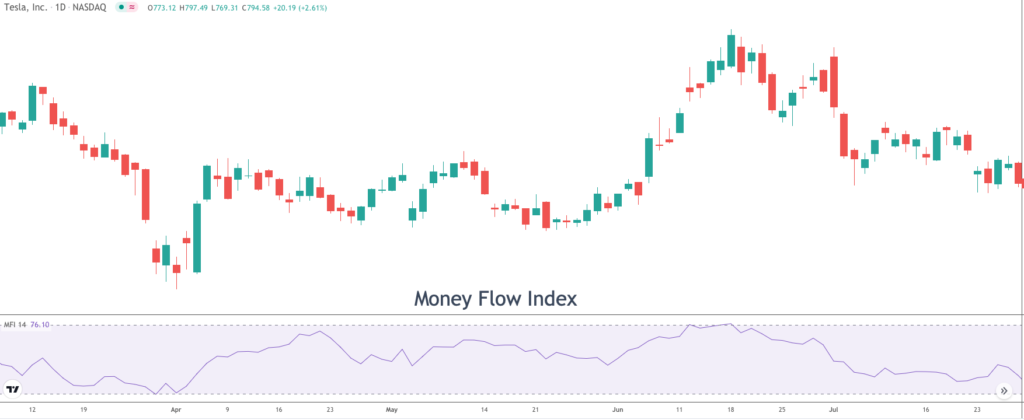
Below you can see an example of the money flow index indicator plotted below the price action. Notice how the price action displays mean reversion tendencies whenever the money flow index reaches an extreme level.
Money Flow Index Formula
Let’s examine the money flow index formula and calculation a bit closer.
First, we will need to calculate the typical price for a period. This is done using the formula below.
Typical Price = (High + Low + Close) / 3
So, if the typical price for today for example is greater than that of yesterday, this tells us that there is a positive Money flow. And inversely, if the typical price today is less than that of yesterday, this tells us that there is a negative Money flow.
Next, we will want to calculate the raw money flow. This can be done using the formula below.
Raw Money Flow = Typical Price x Volume
Afterwards, will move on to calculating the money ratio using the formula below.
Money Flow Ratio = (14-period Positive Money Flow) / (14-period Negative Money Flow)
Finally, we can compute the money flow index as follows:
Money Flow Index = 100 – 100 / (1 + Money Flow Ratio)
Although this calculation for the money flow index can be a bit confusing to understand, it’s important to try to grasp the inner workings of the indicator so that you can fully understand what it’s telling us. Luckily, the calculation itself will be performed quickly using your trading platform of choice.
Money Flow Index Signals
By now you should have a fairly good idea of what the money flow index indicator is and how it is computed. Now, we’ll move on to discussing the major trading signals that can be derived from the MFI. As we’ve touched upon earlier, the two primary types of signals provided by the money flow index indicator includes an overbought/oversold trading signal, and a bullish divergence/bearish divergence trading signal. Let’s now illustrate these various MFI signals further.
As a general rule an overbought condition occurs within the MFI when it reaches a level of 80 or higher. When such a condition exists, traders should seek opportunities to short the market in expectation of lower prices. Similarly in oversold condition when the MFI reaches a level of 20 or lower. When such a condition exists, traders should seek opportunities to buy the market in expectation of higher prices.
Some traders prefer to use the 90 threshold for the overbought level, and the 10 threshold for the oversold level. Although this is acceptable, many times the market will not reach these extreme levels prior to a reversal. As such the 80/20 thresholds generally provide for a better timing mechanism in most markets.
Nevertheless, these overbought and oversold signals work best when the market is trading within a well-recognized range or within a slightly trending market context. Traders should be careful of using the MFI overbought and oversold signal when the market is accelerating in one direction or the other or displaying strong directional tendencies.
Below you can see an example of the MFI money flow index indicator and the corresponding overbought and oversold signals that it has generated.
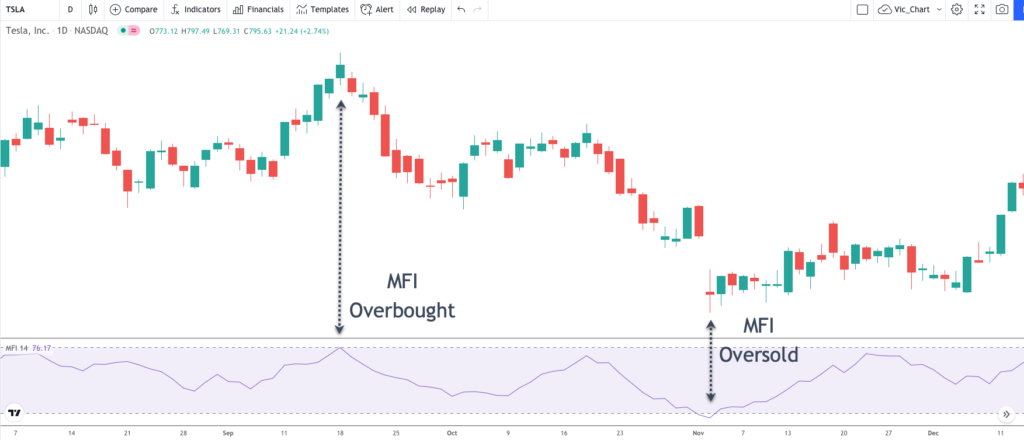
Notice the first MFI extreme reading which is an overbought signal. Prices were moving higher prior to the MFI overbought signal, and upon touching the 80 threshold, prices immediately begin to decline ending the short-term bullish price movement. The second MFI extreme signal is an oversold signal. Take note of the price action immediately following this oversold condition. Specifically, the downtrend is reversed as prices begin to move higher.
Let’s now look at the second type of trading signal that we can get using the MFI indicator. The MFI indicator can provide us an opportunity to go short the market when we can spot a bearish divergence pattern, or the opportunity to go long the market when we can spot a bullish divergence pattern. Remember, within the context of the MFI indicator, a bearish divergence occurs when the price is making higher highs, while the MFI indicator fails to confirm this price action, and instead makes lower highs.
Similarly, a bullish divergence occurs when the price is making lower lows, while the MFI indicator fails to confirm this price action, and instead makes higher lows. Traders can use a host of different momentum indicators to spot bullish and bearish divergence signals. However, the MFI indicator is particularly well-suited to spotting high probability divergence patterns on the price chart. As such, it is a preferred tool for many more experienced chart traders.
Below you can see a price chart illustrating a money flow index divergence signal.
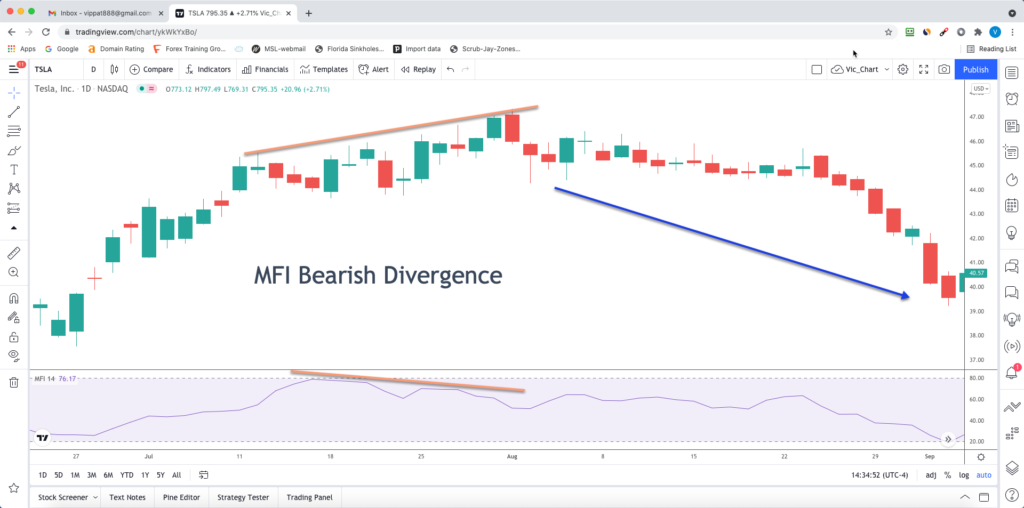
Notice how the price action starts off by creating a bullish uptrend. We can see a clear swing high, followed by a subsequent swing high, as shown by the orange trendline within the price action. During the same time the MFI index indicator is displaying non-confirming behavior. That is to say that the MFI indicator is creating lower peaks instead, creating a bearish divergence signal.
MFI Indicator Trading Strategy
Let’s now move on to creating a complete trading strategy using the money flow index oscillator. In order to keep things as simple as possible, we will illustrate a trading strategy that uses some very basic criteria for entering and exiting trades. This money flow index strategy utilizes two main components. The first of which is an overbought or oversold condition as presented by the MFI indicator. The second condition that will be incorporated into this strategy will be the presence of a hammer candlestick pattern for a buy signal, and a shooting star candlestick pattern for a sell signal. This is a mean reversion strategy that takes advantage of short-term price extremes. Let’s lay out the exact rules of the strategy now.
For a buy set up, the following conditions must be met:
- The market must not be trending strongly and should instead be trading in a relatively range bound manner.
- The MFI indicator must register of reading of 20 or below.
- Within three bars before or after the MFI indicator registers a reading of 20 or below, a hammer candlestick pattern must appear on the price chart.
- Upon the above conditions being met, a market order to buy would be placed immediately following the completion of the hammer candle.
- The stop loss will be placed at a distance that equals one half the entire length of the hammer candle.
- The target or exit point on the trade will be measured using the length of the entire hammer candle. More specifically, the target price will be the level equivalent to the height of the hammer candle.
For a sell set up, the following conditions must be met:
- The market must not be trending strongly and should instead be trading in a relatively range bound manner.
- The MFI indicator must register a reading of 80 or above.
- Within three bars before or after the MFI indicator registers a reading of 80 or above, a shooting star candlestick pattern must appear on the price chart.
- Upon the above conditions being met, a market order to sell would be placed immediately following the completion of the Shooting Star candle. The stop loss will be placed at a distance that equals one half the entire length of the shooting star candle.
- The target or exit point on the trade will be measured using the length of the entire shooting star candle. More specifically, the target price will be the level equivalent to the height of the Shooting Star candle.
MFI Indicator Strategy on Netflix
Now that we’ve taken the time to outline our MFI trading strategy, let’s go ahead and illustrate it on a price chart. For this example, we will be using the daily chart of Netflix, which can be seen below.
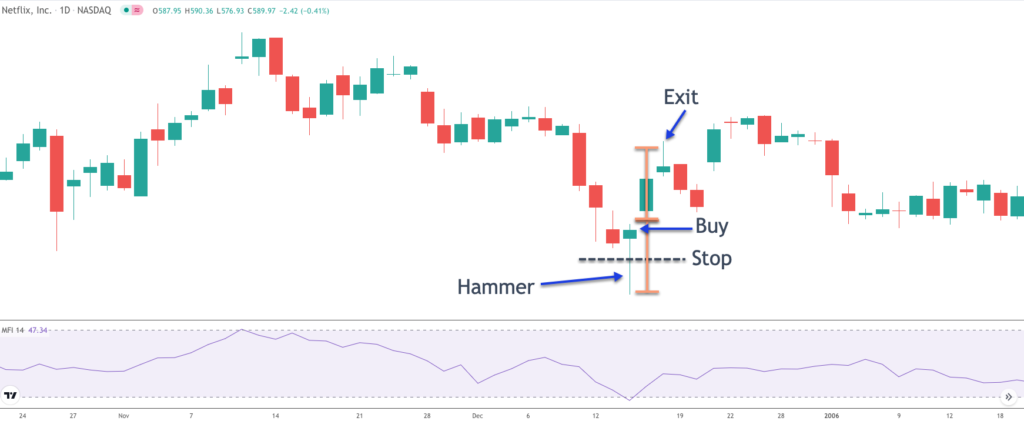
As we can see, the price of Netflix was oscillating back and forth in a relatively range bound manner. As such, the first condition for this set up has been met. That is to say that we can confirm that the market is not trending strongly, but instead displaying relatively range bound price behavior.
Toward the right side of the chart, we can see that the MFI stock indicator, which is shown below the price action, was moving steadily lower. Eventually, it registered a reading which was below the oversold threshold of 20. And so, with this occurrence our second condition for a buy set up has been met.
Now we must confirm the presence of a specific candlestick within three bars of the MFI oversold reading. Keep in mind this can be either before or after the actual MFI oversold condition being registered. If we look at the price chart once again, we can see that a hammer candlestick occurred concurrently with the MFI oversold reading, thus our third condition for a long trade set up has been met.
With all of the above conditions now being met, we would place a market order to buy immediately following the completion of the hammer candle. The stoploss would be placed at a distance that would equal one half the length of the hammer candle itself.
The take profit exit would be set at a distance that is equivalent to the length of the hammer candle. The length of the hammer candle can be seen by referencing the lower bracket next to the hammer candle. The upper bracket represents a one-to-one relationship of the hammer candle projected upward, which would serve as the take profit exit point.
Notice that prices move higher immediately following the buy entry into this trade. We were in no jeopardy of the price stopping us out, and we were able to successfully exit this trade with a profit within two days.
MFI Trading Strategy on SPY
Let’s now display this strategy on the SPY ETF. The SPY ETF is one of the most liquid instruments in the stock market, and because it is a broad market index ETF, it is an excellent candidate for applying this strategy. In fact, ETFs will generally perform better with this mean reversion strategy than individual stocks. So that is something that traders and investors should keep in mind when employing this MFI system in the market.
In the chart below you can see the SPY ETF shown on the daily price chart. You will find the MFI technical indicator below the price action in the lower pane. Let’s start analyzing this price chart to see if we might have a viable trade set up.
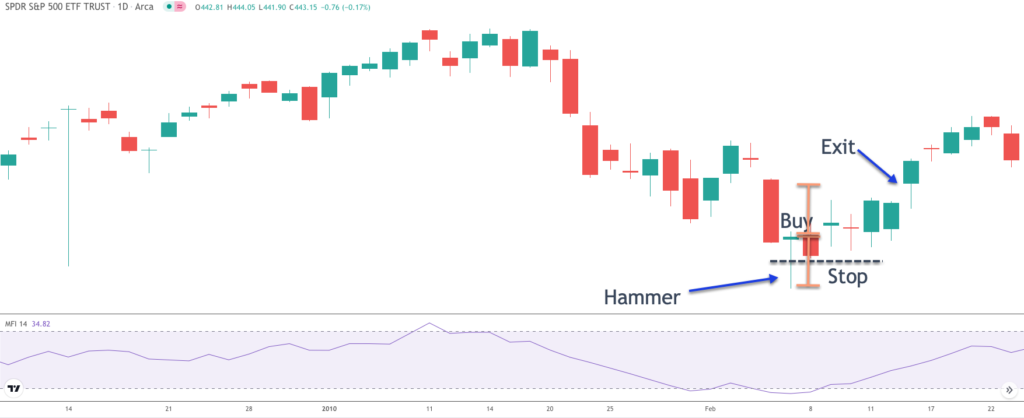
Looking at the price action we can see that there was a fairly sluggish price movement higher, which was followed by a sharper price move lower. As such, there is no clear overwhelming trend in the market at this time, and we can say that the market is trading in a fairly range bound manner up and down. This fulfills the initial condition of this strategy as we can confirm there is no clear dominant trend in the market during this time.
Towards the far right of the price chart, we can see that as prices were moving lower, the MFI indicator was also moving lower with the price action. Eventually, the MFI indicator reached a level below the 20 threshold before bouncing out of that area. Soon afterwards, the MFI indicator dipped below the 20 threshold once again, but this time, after two candles following the MFI oversold reading, we can see that a hammer candle formed on the price chart. As such, we would prepare to buy this market immediately following the close of the hammer candle.
You can see where that buy entry occurs by referring to the price chart. Also take note of the black dashed line which represents the stoploss level. Again, the stoploss level is placed at the halfway mark of the length of the hammer candle. Although it’s a bit hard to see on this chart, the price did move lower following our entry, but did manage to stay above our stoploss level. The exit on the trade was triggered six days following the hammer candle formation and entry. Again, the exit for this strategy is measured using the length of the hammer candle itself and projected upward using a one-to-one measured move.
Summary
The MFI indicator is an excellent market timing indicator when used in the right market context. It is very similar to the RSI indicator, but the MFI indicator also incorporates volume into its calculation. Some traders believe the MFI indicator to be a more robust and reliable oscillator compared to RSI. Although there is no clear evidence of that, it is certainly worth further investigation in the markets that you trade to see if you can get enhanced results using the MFI compared to other similar momentum oscillators.