Technical analysis relies on historical chart data to forecast eventual future events. Oscillators like the RSI indicator fall within a basic group of technical analysis tools. One of the most powerful functions of oscillators is the ability to identify price divergence. Today we will examine techniques for spotting and trading RSI divergence patterns.
What is the RSI Indicator?
…But first, a very brief explanation on oscillators. Oscillators are indicators that fluctuate between extreme high and extreme low values. They are very helpful to identifying overbought and oversold market conditions. The Relative Strength Index, also known as the RSI indicator, is a leading momentum indicator, which measures the intensity of fluctuation and price moves. It is a leading indicator, because it’s signals typically appear prior to the actual reversal event on the chart. The RSI indicator pane is shown under your chart and its line responds to the specific price action on the actual price chart.
Structure of the RSI Indicator
The RSI indicator consists of a single line that fluctuates between three areas, and the line fluctuates between the values of 0 and 100.
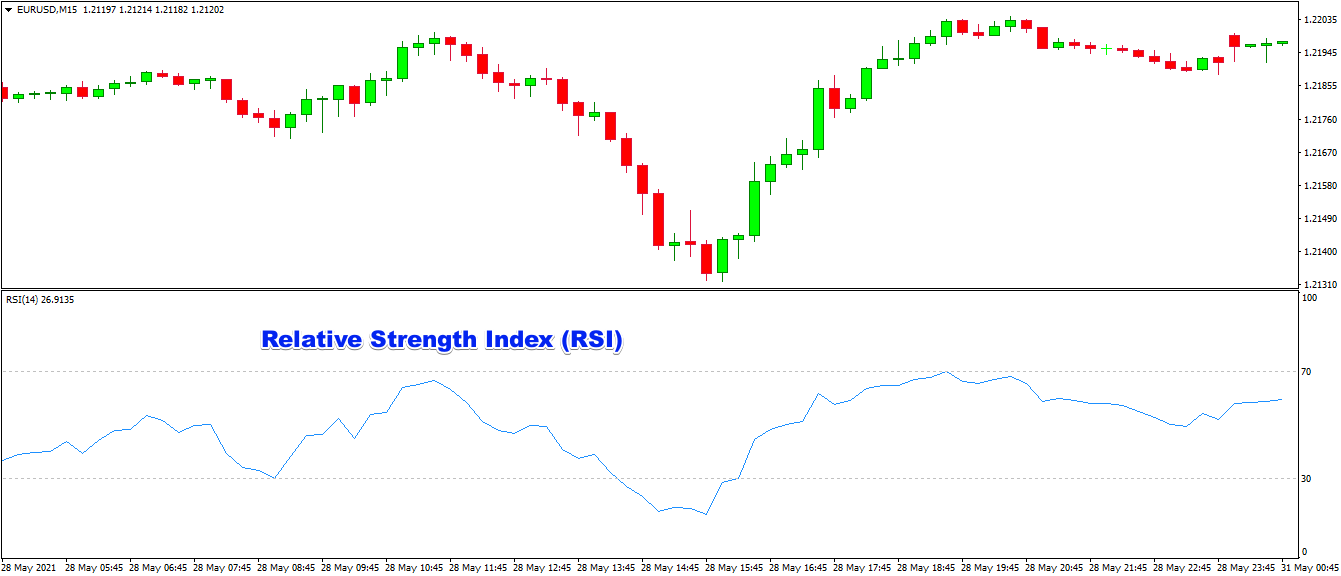
Oversold Area (0-30) – This area tells us that there are too many sellers in the market.
Neutral Area (30-70) – Nothing particular in this area.
Overbought Area (70-100) – This area tells us that there are too many buyers in the market.
Note that these are the default parameters of the indicator. If you want to get signals with higher accuracy, you can always narrow the overbought and the oversold areas, leaving bigger room for the neutral area. This will increase the success rate of your signals, but will reduce the amount of signals you get.
Calculating the RSI Indicator
First, we should outline that the default RSI setting takes into consideration 14 periods on the chart. For this reason, we will explain the RSI formula, taking into consideration the default RSI setup.
To get the Relative Strength Index, you will first need to calculate the Relative Strength (RS). Here is the RS calculation formula:
RS = (14 period EMA on the last 14 bullish candles) / (14 period EMA on the last 14 bearish candles)
EMA stands for Exponential Moving Average
If you change the default setting of the RSI indicator to 10 periods for example, here is how the RS formula look like:
RS = (10 period EMA on the last 10 bullish candles) / (10 period EMA on the last 10 bearish candles)
Now that you have the RS value, you can calculate the Relative Strength Index (RSI), applying the RS in the following formula:
RSI = (100 – (100 / (1 + RS)))
Then, you will get the Relative Strength Index for the current period.
Basic RSI Signals
The basic RSI signals relate to the position of the RSI line compared to the three areas of the indicator.
Overbought RSI Signal
If the RSI line is in the overbought area (70-100), this tells us that the buying intent was so high that the bulls might be exhausted already. For this reason, if the RSI line is in the 70-100 area, this tells us that the price might reverse, giving us a short signal.
Oversold RSI Signal
Opposite to this, having the RSI line in the oversold area (0-30 area) implies that the selling intent was so high that the bears might need a break. If the RSI line is in the 0-30 area, we have a long signal, implying that the price might reverse in bullish direction.
The RSI Divergence Signal
Spotting divergence on RSI is one of the most powerful functions of this indicator. The reason for this is that a RSI divergence is a more reliable signal than the overbought and oversold indications by themselves. You will constantly get overbought and oversold signals. However, the divergence is a rarer occurrence.
Generally, an RSI divergence means that the RSI indicator is moving in the opposite direction compared to the price. Therefore, while the price is moving, the RSI is telling us in advance to anticipate a change in the direction. We recognize two types of RSI divergence.
Positive RSI Divergence
We have a positive RSI divergence, when the price action accounts for lower lows and lower highs, while the RSI indicator is making the opposite – higher highs and higher lows.
The price keeps decreasing, while the RSI indicator starts increasing.
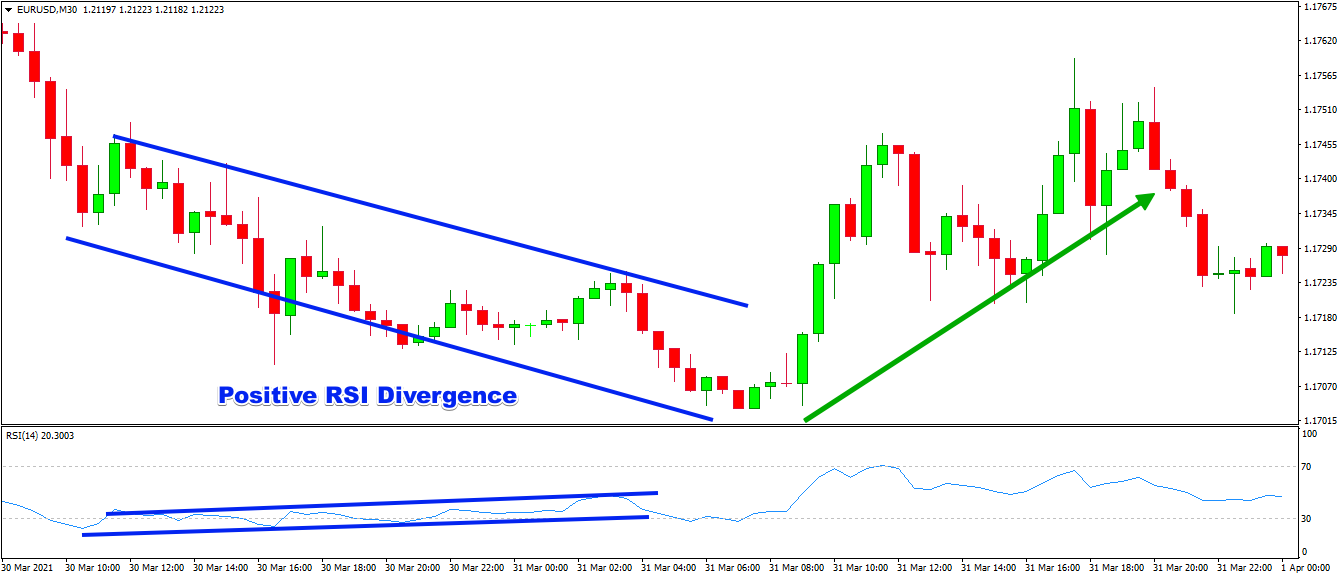
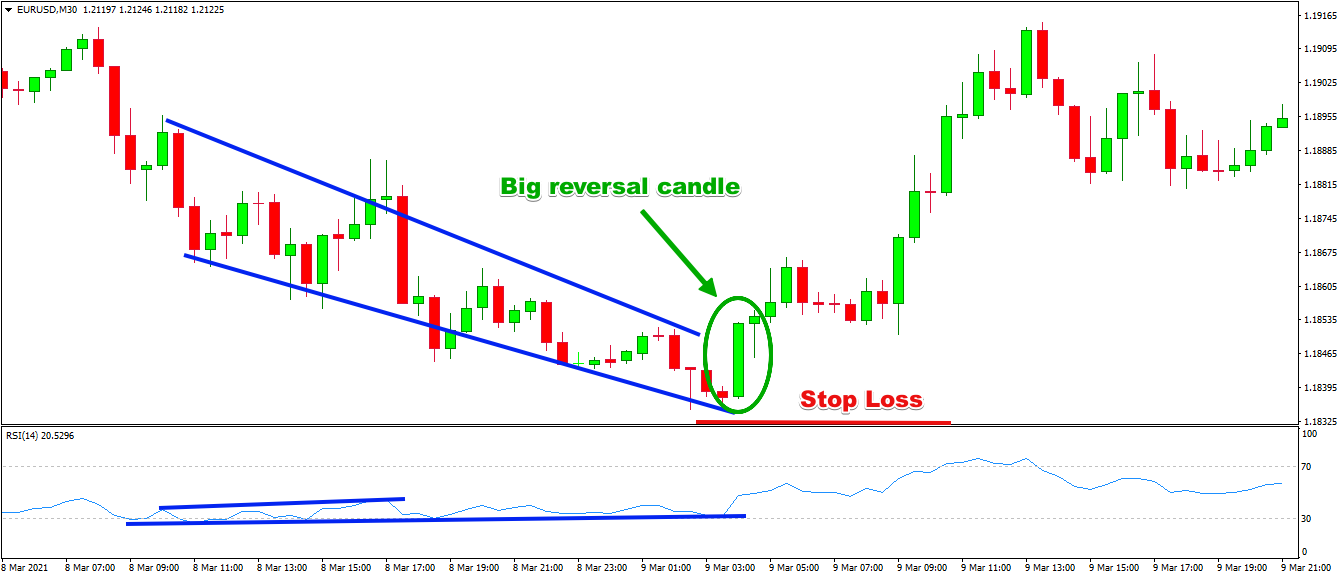
The image above shows a positive RSI divergence in MT4. The blue bearish corridor on the chart shows a price decrease – lower lows and lower highs. At the same time, the RSI indicator below the chart creates higher highs and higher lows, it increases. Not long after that we see a sharp price increase.
The other name for the positive RSI divergence is just a bullish divergence. It usually means that the bearish trend is at its end and the price is very likely to start increasing. A positive RSI divergence gives you a nice opportunity to trade the market in bullish direction.
Negative RSI Divergence
The negative RSI divergence is opposite to the positive divergence. It applies to bullish trends where the price closes higher highs and higher lows. However, the RSI accounts for lower highs and lower lows – the price increases but the RSI decreases.
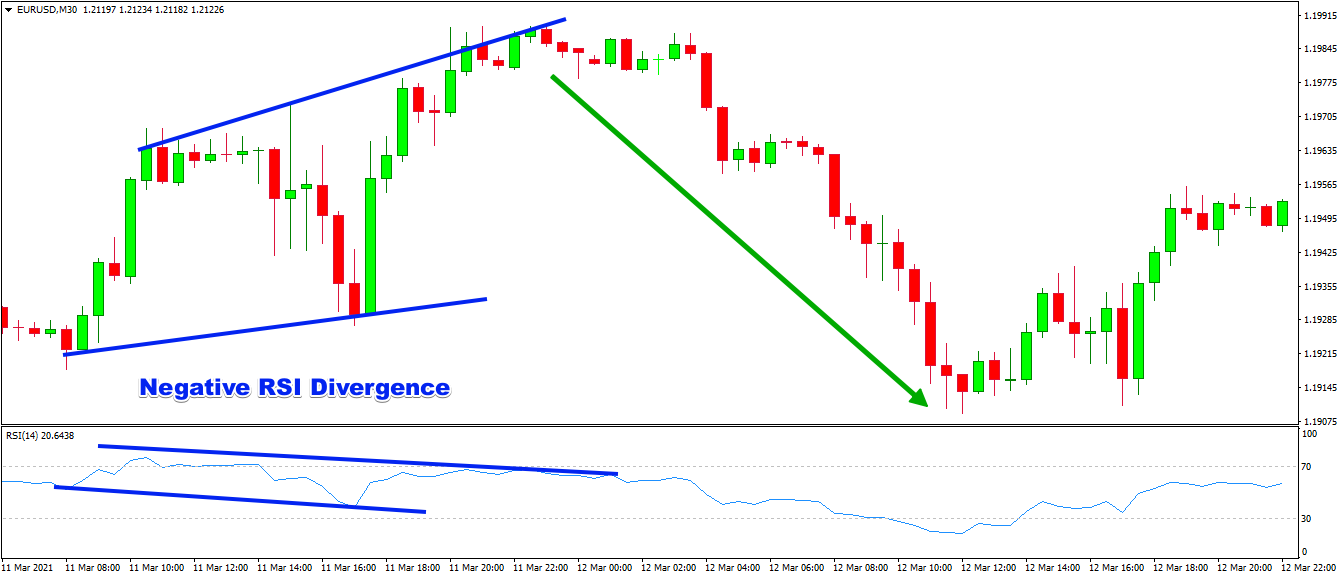
And here is the opposite scenario. The price action closes higher highs and higher lows, while the RSI indicator does the opposite – lower lows and lower highs, confirming a negative divergence. As a result, the price accounts for a sharp drop.
The other name of the negative RSI divergence is bearish divergence. The reason for this is that it hints for an upcoming bearish move, which you can tackle with a short trade.
RSI Divergence Trading
Next we’ll discuss some rules for trading RSI divergences.
Entering the Market on an RSI Divergence Pattern
Your entry point on an RSI divergence should come after the price action and the Relative Strength Index meet some conditions:
- You need to identify that the RSI is displaying a divergence. For this, you will need to confirm that the highs and lows within the RSI line are moving opposite to the price action.
- After you confirm the divergence, you will need to identify the presence of a price reversal. Not every divergence on RSI is a valid signal. There will be some fake signals. Thus, wait for the beginning of the actual reversal for a higher accuracy trade setup.
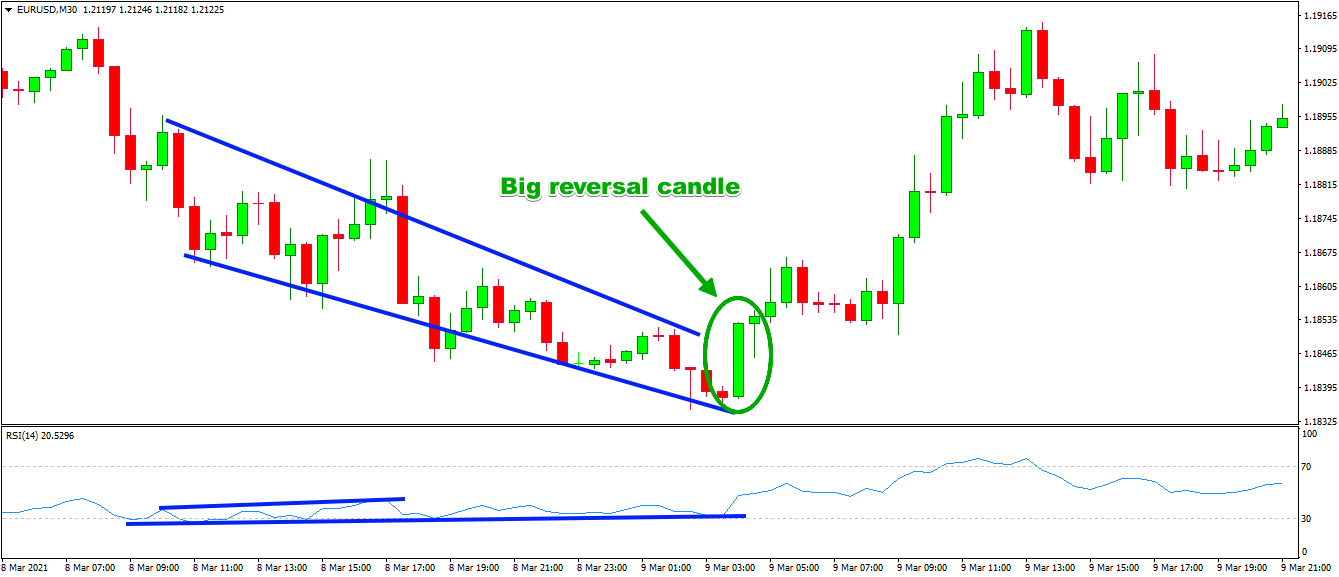
In the case above, we can take the big green reversal candle as the beginning of an eventual reversal.
In different cases, these two requirements will look different on the chart. Sometimes the confirmation of the reversal will happen with a single candle. Sometimes, you will need to spot an actual impulse and a correction to confirm it.
Stop Loss Order on RSI Price Divergence
You should always use a stop loss order when trading RSI divergence. Since you will get some fake signals, it is good that you stay protected during any bad trades.
A good place for your stop loss order will be the edge formed at the time of the price reversal. If it is a bullish divergence, you are looking to place the stop loss order below the bottom that the price forms at the time of the reversal.
If it is about a bearish divergence, then you are looking for a top. Place your stop beyond that edge to protect your trade and your bankroll.
Here is how the stop loss order applies to the previous case we took into consideration. If we take the big reversal candle as the beginning of a bullish activity, then the stop should go below the bottom created at the time of the reversal.
Exiting the Market When Trading RSI Divergence
Sometimes the price will enter into a big trend after reversing. Sometimes this might be just a short-term reversal of a prior impulse. You will need to decide for yourself what the most suitable exit point on the chart is. You should stay in the trade as long as you confirm that the price is moving in your favor.
If you use some extra technical tools on your chart, you may get a more precise exit signal for your RSI divergence trades. Also, don’t forget that you can always use the overbought/oversold signals of the RSI itself. It may help you determine your exit point in a better way.
Trading the RSI Divergence Signal with Price Action
Price action analysis is always a good technique when you are looking for extra confirmation on the chart. You should use any chart formation that you spot for bringing higher accuracy for your trade – trend lines, channels, chart patterns, candle patterns, etc.
The idea of this strategy is to confirm the presence of an RSI divergence and to match it with a price action signal. Then, you should hold the trade as long as the price action lets you or until you spot an opposite RSI signal.
Always use a stop loss order to protect your account balance.
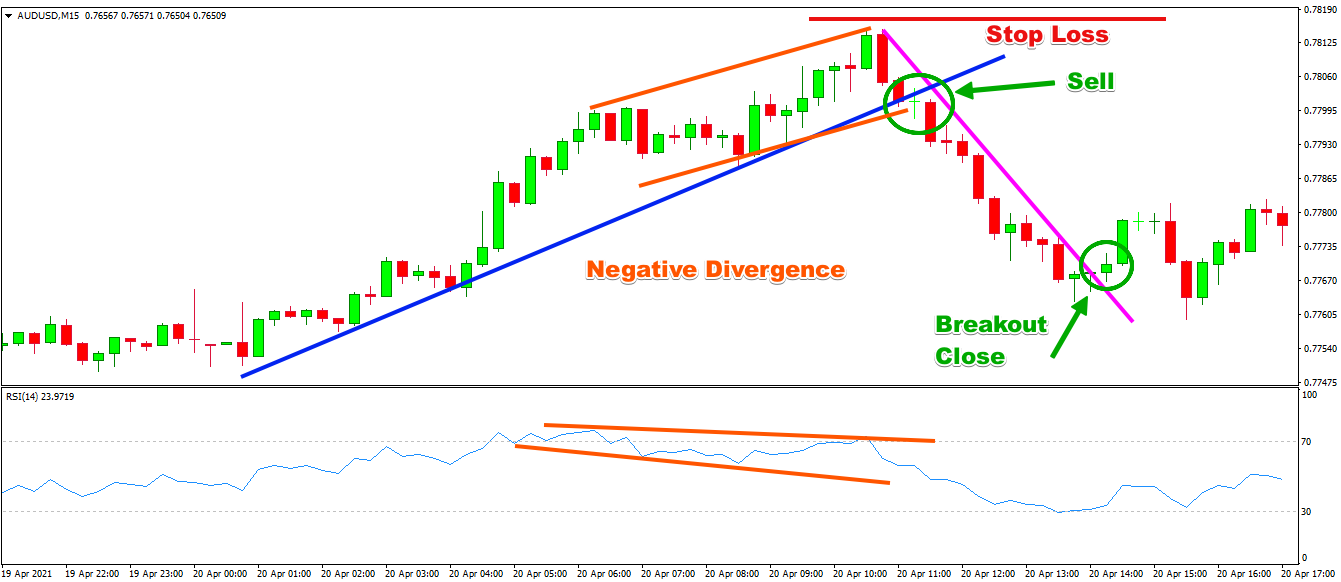
Above you see in the 15-minute chart of the AUD/USD Forex pair. We have the RSI indicator in its default parameters at the bottom of the chart.
This case begins with a bullish trend, which we have marked with the blue trend line on the chart.
The orange lines on the chart mark the higher tops and the higher bottoms of the price action. And the orange lines on the RSI indicator mark a negative divergence, shown by the RSI.
After we identify the RSI divergence, we see that the price attempts a reversal and tests the trend line in bearish direction. Suddenly, we see a breakout in the trend, which is the price action signal we need to go short.
The proper location of your stop loss order is above the top, created at the moment of the price reversal. We have marked the stop with the red horizontal line on the image.
Now, we follow price action rules to determine the exit point of our trade. The pink bearish line indicates the trend, which the price follows on the way down. Suddenly, a candle breaks this trend line in bullish direction, which tells us that this might be the end of the price decrease. This looks like a nice exit point and we close the trade collecting a profit equal to 31 pips.
Matching Divergence on RSI with another Oscillator
Another good strategy for trading RSI divergence is to match this signal with a signal from another leading indicator. A good oscillator for this case is the Stochastic.
So, we will enter the market on RSI divergence, confirmed by an extra signal from the Stochastic Oscillator. Then, we will hold the trade until we see one of the following:
- Opposite signal from the RSI
Or
- Opposite divergence from the Stochastic Oscillator
Note that we exclude the overbought/oversold function of the Stochastic as an exit signal. The reason for this is that the Stochastic Oscillator is much more dynamic than the RSI and can give many fake signals. Thus, the overbought/oversold signals from the Stochastic are not a good exit indicator, because they will often get you out of the market for no reason.
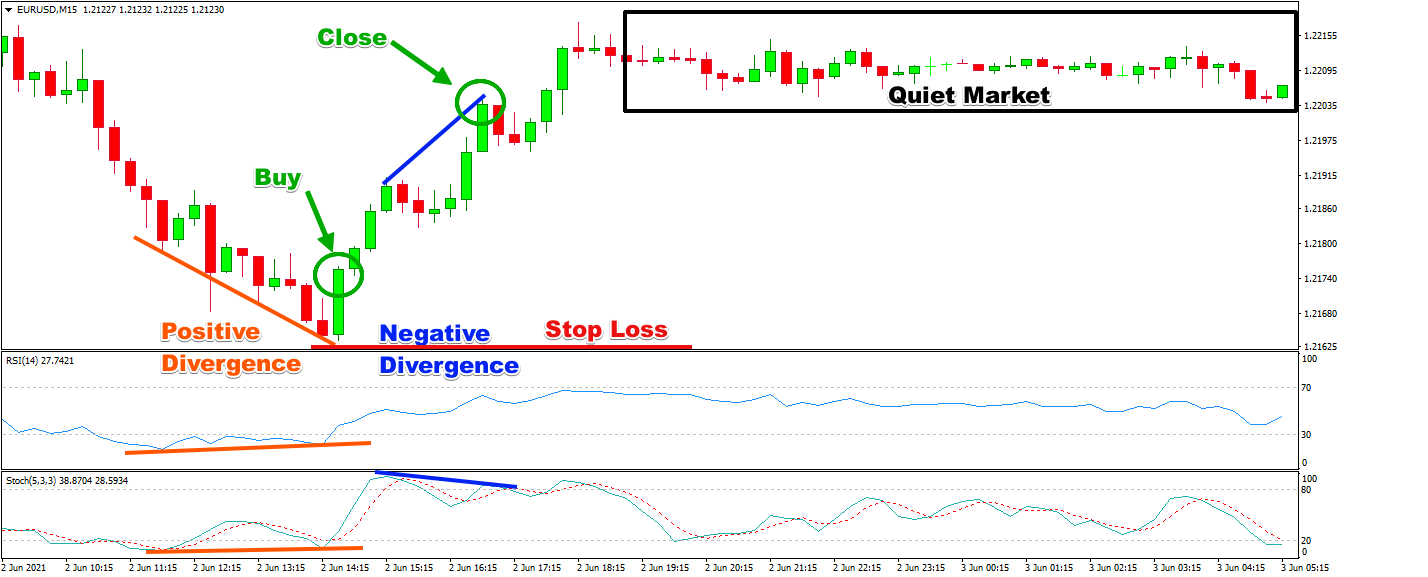
This time we observe the 15-minute chart of the EUR/USD Forex pair. We have the RSI indicator and the Stochastic Oscillator at the bottom of the chart.
Notice that this case begins with a bearish trend on the chart. Suddenly, both the RSI and the Stochastic Oscillator confirm the presence of a positive divergence. This is a strong double signal, which we cannot neglect, and we open a long trade on the first clearly expressed bullish candle on the chart.
We place a stop loss order below the bottom created at the moment of the reversal. We observe a couple sharper price increases, followed by an increase in both the RSI and the Stochastic.
The Stochastic Oscillator enters its overbought zone. However, this is a common signal and we don’t take it into consideration for a trade exit. However, the next top on the Stochastic Oscillator is lower than the previous one. At the same time, the price keeps closing higher highs. This means the Stochastic is giving us a negative divergence on the chart – our exit signal.
Conclusion
- Oscillators are one of the most basic technical analysis tools in Forex trading.
- One of the most popular oscillators is the Relative Strength Index (RSI)
- The RSI is a leading indicator.
- The RSI is a single line that fluctuates between an overbought, oversold, and neutral area.
- The default RSI setup is:
- Oversold area between 0 and 30.
- Neutral area between 30 and 70.
- Overbought area between 70 and 100.
- Takes 14 periods into consideration.
- To calculate the RSI, you will need to calculate the Relative Strength first:
- RS = (14 period EMA on the last 14 bullish candles) / (14 period EMA on the last 14 bearish candles)
- RSI = (100 – (100 / (1 + RS)))
- The basic RSI signals are:
- Overbought market condition
- Oversold market condition
- The more advanced and reliable signal is the RSI divergence, where we recognize two types:
- Positive RSI Divergence (bullish)
- Negative RSI Divergence (bearish)
- To enter the market on an RSI divergence indicator, you will need to:
- Identify an actual RSI divergence on the chart
- Identify the beginning of a price reversal
- Place a stop loss order at the opposite side of the edge at the moment of the reversal.
- There are no specific take profit rules when trading divergence. Hold the trade as long as the price conditions are in your favor or as long as your strategy lets you.
- The RSI divergence strategy works well with price action rules:
- Enter the market on an RSI divergence + a price action signal.
- Place a stop loss order at the opposite side of the reversal point.
- Hold the trade as long as the price action continues to confirm your trade.
- Another great RSI divergence strategy includes the Stochastic Oscillator.
- Enter the market on an RSI divergence + a signal from the Stochastic.
- Place a stop loss order at the opposite side of the reversal point.
- Hold the trade until you see an opposite RSI signal or an opposite divergence from the Stochastic Oscillator.