 Many of the technical analysis techniques commonly used by modern day forex traders had their origins in the early part of the last century, and a leading contributor to technical analysis theory was a famous stock trader by the name of Charles H. Dow.
You may already know of Dow as the trader who gave his name to the Dow Jones Industrial Index or DJIA equity index that is still often used as a stock market barometer in the modern era.
Known as The Charles Dow Theory, or more simply as Dow Theory, the market concepts and analysis methods historically credited to Dow have largely been replaced in common usage by later developments. One of the more popular among these is The Elliott Wave Theory that was developed by R.N. Elliott to build upon and expand some of the basic trend analysis concepts in Dow Theory into an overall theory of market psychology and how it influences price movements.
The following sections will explain Dow Theory, discuss its basic tenets, assumptions and applications, and describe how forex traders can use Dow Theory to analyze the currency market and make more informed trading decisions.
What is the Dow Theory, and How Did it Come About?
The Dow Theory originally evolved out of a series of editorial articles that stock trader Charles H. Dow wrote for publication in the Wall Street Journal over the period from 1900 until he died in 1902. These articles covered topics related to Dow’s views on how stock market price movements behaved and how that had implications for the prevailing business environment and its overall health.
Although Dow never finishing publishing the entirety of his market movement theory, some of his associates and supporters further expanded upon and developed what he had started.
Some of the more notable of these literary contributors to Dow Theory included Robert Rhea, who published “The Dow Theory” in 1932, and Richard Russell, who wrote “The Dow Theory Today” that came out in 1961.
Dow also originally formulated the Dow Jones Industrial Average or DJIA, as well as the Dow Jones Rail Index that has since come to be known as the Transportation Index, because he wished to use them as a gauge of current business conditions within those economic sectors as part of his analysis.
Although more modern theories of market price movement have largely taken its place, Dow’s theory was revolutionary at the time it was introduced and remains relevant to today’s financial market traders. Many of today’s predominant market theories were originally based on Dow Theory and use similar assumptions to derive similar conclusions. The next section of this article will explain what exactly the basic assumptions are that make up the foundation of Dow Theory.
 The Three Primary Dow Theory Assumptions
Charles Dow proposed three basic underlying assumptions or tenets upon which his theory of market price analysis is based.
Note that the very nature of an assumption means that such proposed market behavior does not necessarily hold true under all market conditions.
Such assumptions are not facts but are instead simplifications to the actual market reality faced by traders that tend to hold true and can be used to create theoretical implications that can in turn be used to base trading decisions on.
Basically, these tenets should ideally be considered to be general and simplifying principles that seem to apply in many cases when reviewing market behavior in which human psychology plays a substantial part in determining prices. With that key point noted, a discussion of these three key Dow Theory assumptions can proceed, and they are as follows:
Market prices evolve in three forms simultaneously. – The first among these fundamental tenets in Dow Theory is that movements observed in a market price tend to develop in three forms that occur simultaneously, although not in a random fashion. These forms are called the primary, secondary and minor price movements. Having an awareness of the existence of these forms means that they can be employed by a trader to first define what the present form is, and to then trade in concert with market trend while it is developing.
Price discounts all. – The second key component of the Dow Theory tenet is commonly expressed with the simple phrase: “Price discounts all.” What this means is that the market price at which a balance of buyers and sellers exists in equilibrium has been determined, in theory, by the net overall effect of all of the information currently available to market participants that seems relevant to that price. Such information might include fundamental economic data, news stories, geopolitical events, and any other information that might be considered by the market to be relevant to its current evaluation of the price, including the emotional state of traders and the risk of rare events occurring, such as natural disasters.
This important assumption notably tends to break down briefly while new information is being assimilated by the market, such as immediately after the release of a major economic number that differs substantially from what was expected by the consensus of market analysts.
Once the new information has been reflected in the market price or “discounted”, it again tends to reflect the current state of knowledge and sentiment among market participants.
History repeats itself. – The third and final major tenet of Dow Theory can be expressed briefly as: “History repeats itself”. The implication of this assumption is that traders can use techniques that have worked well in the past for market forecasting to estimate the level of market prices in the future. Market price movements have been closely studied over the events of the past century or so, and that information is readily available to traders for them to draw upon when considering the likely impact of future events.
This tenet might break down when an event occurs that has no recent historical precedent and for which the previous market impact is therefore not available to be studied and applied to the present event for predictive purposes.
Understanding Dow Theory and Trend Analysis
One of the most important parts of Dow Theory involves evaluating and predicting the direction of the trend that evolves in primary, secondary and minor trends. Trends in Dow Theory refer to persistent directional market price movements.
To determine the trend’s direction, a trader will first need to know what defines a trend, which can either be considered an up, upwards or bullish trend if its overall direction is higher, or a down, downwards or bearish trend if its overall direction is lower.
What defines an upward trend is a series of higher market highs or peaks seen along with a series of higher market lows or troughs. Conversely, a downwards trend has a series of lower lows and lower highs. Each movement from a trough to a peak is called a rally, while each movement from a peak to a trough is called a sell-off.
The schematic diagrams shown in Figure 1 below illustrate the general directional behavior of upwards and downwards trends that are themselves made up of successive rallies and sell-offs, or vice versa.
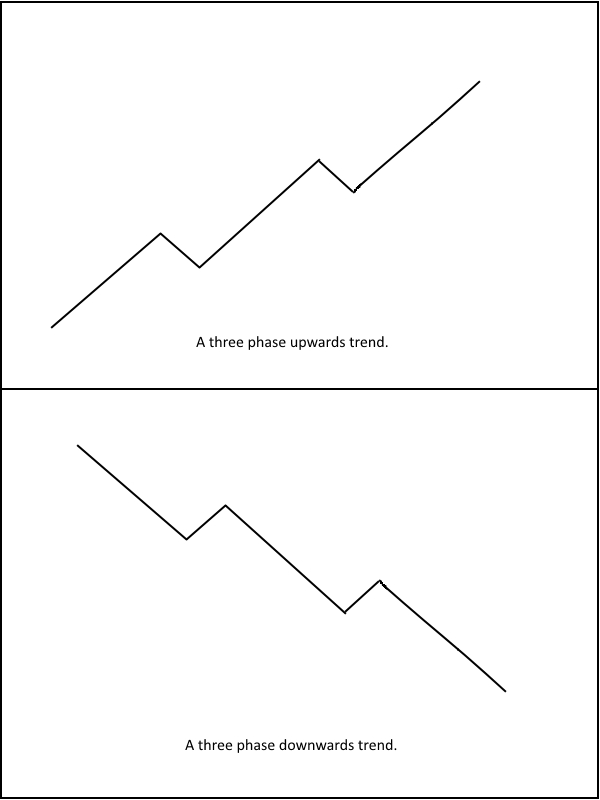
Figure 1: Schematic diagrams showing idealized three phase up and down trends.
Dow’s particular form of trend analysis typically requires a technical analyst to first identify the direction of the primary market trend. This longer term directional movement tends to last between one and three years at a time, although this can vary somewhat.
The next form of trend analysis requires the analyst to determine the secondary or intermediate trend, which generally moves in the opposite direction of the primary trend and is sometimes referred to as a market correction. Thus, if the primary trend for a particular market is higher overall, the direction of the secondary trend will be lower.
Conversely, markets with a downwards primary trend will show upwards secondary trends.
The secondary trend is shorter than the primary trend and tends to last between three weeks to three months. Also, the corrections seen within this intermediate trend type tend to range in length from between one third to two thirds of the primary trend’s preceding movement.
The last phase considered in Dow Theory is known as the minor trend. The duration of minor trends is the shortest and tends to extend up to several weeks in duration. Such minor trends form the small corrections seen within the secondary trend, and so they generally go in the opposite direction to it.
Although the minor trend is not of the greatest concern to most traders who use Dow Theory concepts, and often contains a significant amount of rather distracting noise, it should still be observed while firmly keeping in mind the bigger picture that comprises the secondary and primary market trends.
 The Three Phases of Dow Theory
Another important fundamental aspect of Dow Theory involves the three phases that the market enters into within each primary trend.
Within an upwards trend, these are the accumulation phase, the public participation phase, and the panic phase. In a downwards trend, they are called the distribution phase, the public participation phase, and the excess phase.
An upwards trending or bullish market generally starts with the accumulation phase that is characterized by the entry into the market of well-informed investors, also sometimes known as the “smart money”, who sense value at the bottom or lower turning point of the market and start to accumulate the traded asset cheaply. This phase comes just after the end of a downwards move and tends to commence with a price consolidation period as selling pressure fades, followed by a rise in prices.
The public participation phase comes next as public sentiment about the market improves along with the release of favorable fundamental information. This phase typically comes after the market fails to make a lower low and lower high, so a market reversal seems to be in place. More and more retail traders, technical analysts and investors start to enter the market, often pushing prices sharply higher in the direction of the trend. This phase typically lasts the longest and rises the furthest of all three.
The excess phase then concludes the upwards trend as buying interest starts to wane and the good news starts to age, although all investors typically want to buy this market at the outset of this phase.
Towards the end of it, the smart money begins to reduce their positions, often selling them to enthusiastic and even irrational retail buyers who are getting into the market late. Waning market momentum usually characterizes the top of the market as this final upwards phase ends and the start of a primary downwards trend then commences.
The ensuing downwards trend or bear market will begin with the distribution phase where the well-informed traders start to sell out their positions into what they see as an overbought market that may also show signs of price consolidation or a sharp peak followed by a drop. A new down trend can be confirmed once the previous up trend does not make a higher high and a higher low, indicating that a market reversal has taken place.
This tends to lead into the next public participation phase, which then takes the market considerably lower as the general public becomes aware of the change in market direction and business conditions look less favorable. Retail sellers become more numerous than buyers, so the market price falls. Technical traders often reverse their positions at this point and go short.
The downwards trend then concludes in the panic phase, where a sharp market sell-off or crash can take place very quickly in extreme cases. The end of this phase tends to be characterized by very adverse market sentiment, negative fundamental information, and a substantial preponderance of speculative short positions. At that point, the entire cycle begins anew as the smart money again senses value.
The Use of Volume in Dow Theory
Dow Theory also incorporates the use of several key indicators. The first is the use of indexes. For example, an index like the Dow Jones Industrial Average could be used as an indicator of overall market direction when trading in the stock market.
Another key indicator used by Dow was the volume traded in the market being analyzed. Trading volume can be used to confirm valid price movements, as well as to ignore spurious price movements that might have taken place in very thinly traded markets, like those occurring on major public holidays, for example.
Essentially, if the trading volume rises as the trend continues, then that confirms and tends to be supportive of the trend’s additional continuation. Conversely, when the trading volume falls as the trend continues, then that fails to confirm the trend and may well signal that a trend reversal is forthcoming. This is due to the fact that trading activity, as shown by the volume traded, is no longer actively supportive of that trend.
Just remember to keep in mind the basic fact that the majority of money traded needs to be moving along with a market price trend in order for it to continue.
Using Dow Theory Concepts in Forex Trading
Applying the basic ideas contained in Dow Theory in forex trading may already be familiar to many technical currency traders since they underlie many of the existing well-known trading techniques.
If you are new to trading, then becoming familiar with and then using Dow Theory concepts can really help you avoid some of the common pitfalls that novice traders often fall into, such as buying at tops and selling at bottoms. In these instances, the smart money is already trading in the opposite direction to the waning trend.
One good idea might be to perform market analysis using Dow Theory directly into your trading plan. This can help you avoid taking part in the especially dangerous excess or panic phases that markets tend to go through just before a major trend reversal takes place.
While shorter term traders like scalpers and day traders may not find Dow Theory particularly applicable to their needs, longer term currency traders can really benefit from performing a thorough market and Trade analysis using Dow Theory before pulling the trigger on entering or exiting a position.
As far as the modern relevance of Dow Theory in investment situations is concerned, one major problem most retail investors have is becoming too enthusiastic at the top of a market and too pessimistic at the bottom of a market. Many times this is due to the news media often whipping investors up into a frenzy. Understanding the key concepts of Dow Theory can really help these investors learn to trade along with the smart money, instead of following the crowd during a waning market move.