The McClellan oscillator is a unique technical indicator that is specifically designed and well suited for analyzing the stock market. We will dive into all the important aspects of this indicator, and detail some of the more common signals that it generates. Additionally, we will move on to building a complete trading strategy that revolves around the McClellan oscillator.
Understanding The McClellan Oscillator
The McClellan oscillator is a technical indicator that measures market breadth. In other words, the McClellan oscillator helps us to evaluate the current market sentiment and trend. It is primarily used on major stock market exchanges such as the New York Stock Exchange, or the NASDAQ.
The McClellan indicator takes into account the total sum of all stocks within an exchange. The oscillator is composed of the 19-day exponential moving average, and the 39 day exponential moving average. We would say that the oscillator is in positive territory when the 19-day EMA is above the 39 day EMA. Conversely, we would say that the oscillator is in negative territory when the 19-day EMA is trading below the 39 day EMA.
As a general guideline, when the McClellan oscillator is positive and has been moving higher, this is indicative of stock accumulation or a buying phase. When the McClellan oscillator is negative and has been moving lower, this is indicative of stock distribution or a selling phase.
The McClellan oscillator provides several different signals. Some of these signals include crossover signals, divergence signals, and breadth thrust signals. We will be discussing each of the signals in more detail in the coming sections, but for now, it’s important to recognize the primary types.
Crossover signals within the McClellan oscillator can clue us into potential trend changes. This occurs when the slower 19-day exponential moving average crosses above or below the slower 39-day exponential moving average. The McClellan oscillator divergence signal is also an important event that can signal a change in trend. A bullish divergence is set to occur when the price is falling, and the market is making lower lows, while the McClellan oscillator is rising and making higher highs. Similarly, a bearish divergence is said to occur when the price is rising, and the market is making higher highs, while the McClellan oscillator is falling and making lower highs.
As a breadth indicator, the McClellan oscillator can also provide insights into a sudden shift in market sentiment. This often occurs when the oscillator makes a sudden move higher. In this case, the signal would be a bullish breadth thrust. Alternatively, when the oscillator makes a sudden move lower, this signal would be considered a bearish breadth thrust.
Now although the McClellan oscillator can be a valuable tool within a stock trader’s arsenal, it’s essential that traders use other technical studies in conjunction with the McClellan oscillator to achieve the best results. This is because the McClellan indicator, just like any other technical study is not foolproof and can register false signals from time to time, particularly when the markets are highly volatile.
McClellan Oscillator Formula
Let’s now take some time to discuss how the McClellan oscillator formula works and how it is actually calculated. Below you will find the formula for the McClellan oscillator:
(19-Day EMA of Advances – Declines) – (39-Day EMA of Advances – Declines)
So, what does this formula tell us? Essentially, within this calculation we are subtracting the 39-day exponential moving average from the 19 day exponential moving average. It’s important to keep in mind that we are calculating the EMA by taking into consideration the net difference between the advancing issues and the declining issues.
So, when the oscillator is in positive territory, the 19-day EMA is trading above the 39 day EMA. And this is an indication that the aggregate number of advancing stocks are higher than the number of declining stocks. Conversely, when the oscillator is in negative territory, the 19-day EMA is trading below the 39 day EMA. And this is an indication that the total number of declining stocks are higher than the total number of advancing stocks.
Many traders use the McClellan oscillator as a trend identification tool. Moreover, when the McClellan oscillator is positive, these traders will often only look to take long trades and filter out any short set ups. Along the same lines, when the McClellan oscillator is negative, traders can opt to only initiate short trades and filter out any long setups. Doing so, will generally keep you aligned with the overall sentiment and trend of the current market.
Within the construction of the McClellan oscillator, you may have noticed that it is comprised of the exponential moving average variation. There are many different types of moving averages including simple moving averages, volume weighted moving averages, and more. The creators of the McClellan oscillator opted for the exponential moving average variation, because they felt that taking the most recent price action into account was of vital importance in measuring market breadth.
McClellan Oscillator Chart Analysis
Let’s now take a closer look at some of the trading signals generated by the McClellan oscillator. Let’s start off by examining what they McClellan crossover signal looks like.
Below you can see a price chart with the McClellan oscillator plotted in the lower pane.
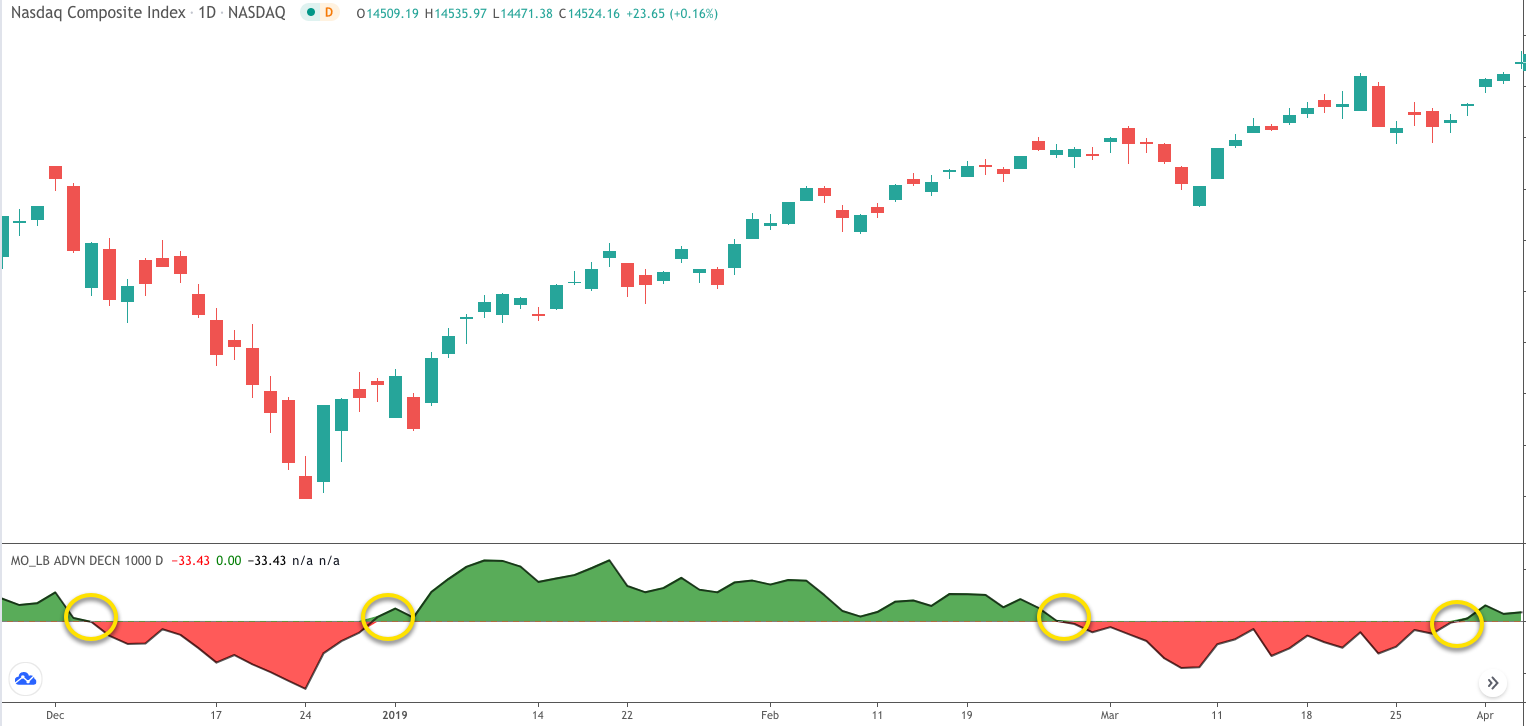
Notice how the indicator oscillates around the central horizontal level. A bullish crossover signal occurs when they McClellan oscillator moves above the center level from below. Similarly, a bearish crossover signal occurs when the McClellan oscillator moves below the center level from above. Although many traders do not utilize these crossovers as pure buy and sell signals, they can be used as such.
However, a more prudent approach would be to use these crossover events as warnings of potential changes in sentiment leading to a possible trend change. In other words, when the indicator moves from negative to positive territory, you may want to stay focused on buy set ups. And when the indicator moves from positive to negative territory, you may want to stay focused on sell setups.
Another popular use of the McClellan oscillator is to employ it as a divergence signal. The McClellan oscillator is a momentum-based indicator, measuring the net advances within an overall stock market exchange. As such, it can be quite effective at finding sentiment extremes based on divergence patterns.
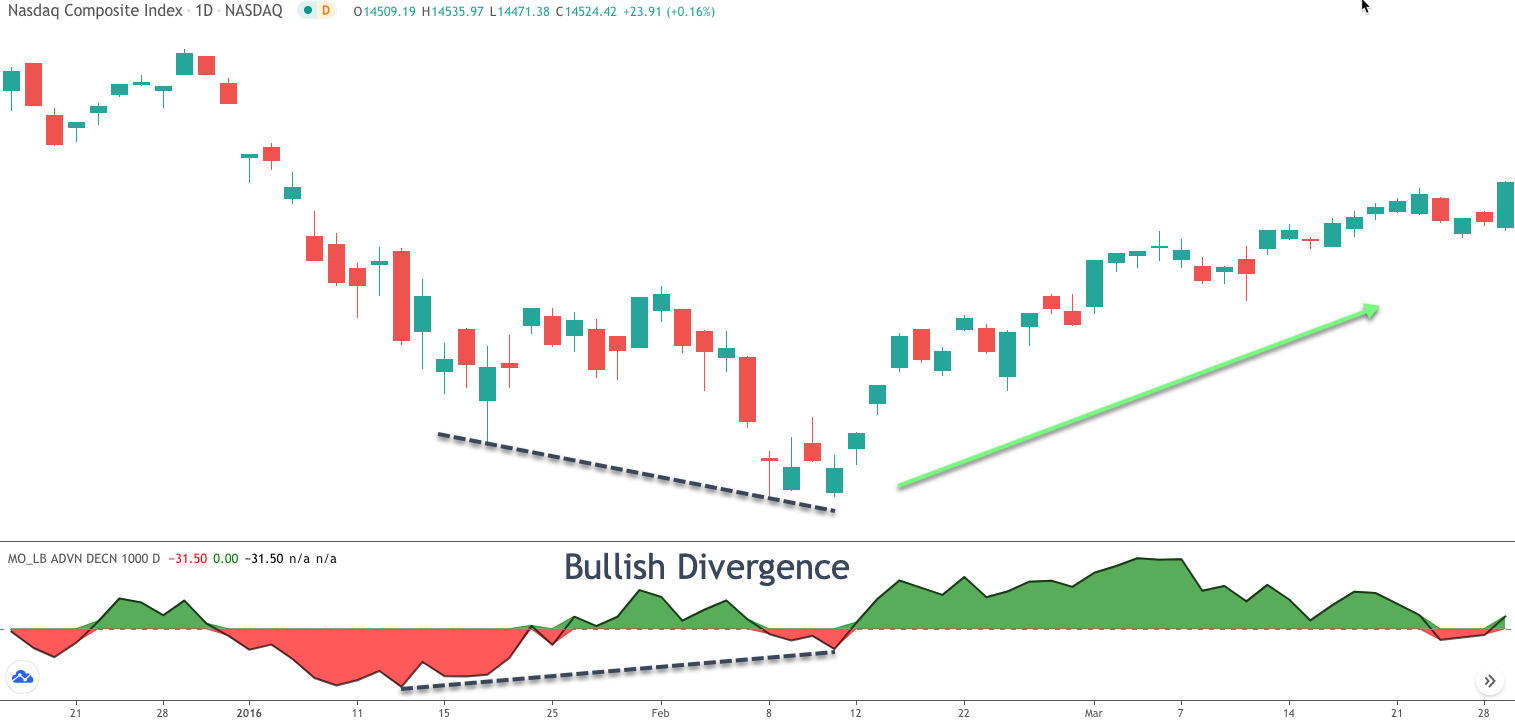
Specifically, when they McClellan oscillator is moving lower and creating lower highs, while the price action is moving higher and creating higher highs, this is an excellent indication of a waning uptrend that is likely to reverse lower. We refer to this condition as a bearish divergence. Similarly, when the McClellan oscillator is moving higher and creating higher lows, while the price is moving lower creating lower lows, this is an indication of a tired downtrend that may be on the verge of reversing higher. We refer to this condition as a bullish divergence.
Below you can see an example of a bullish divergence between the price action and the McClellan oscillator.
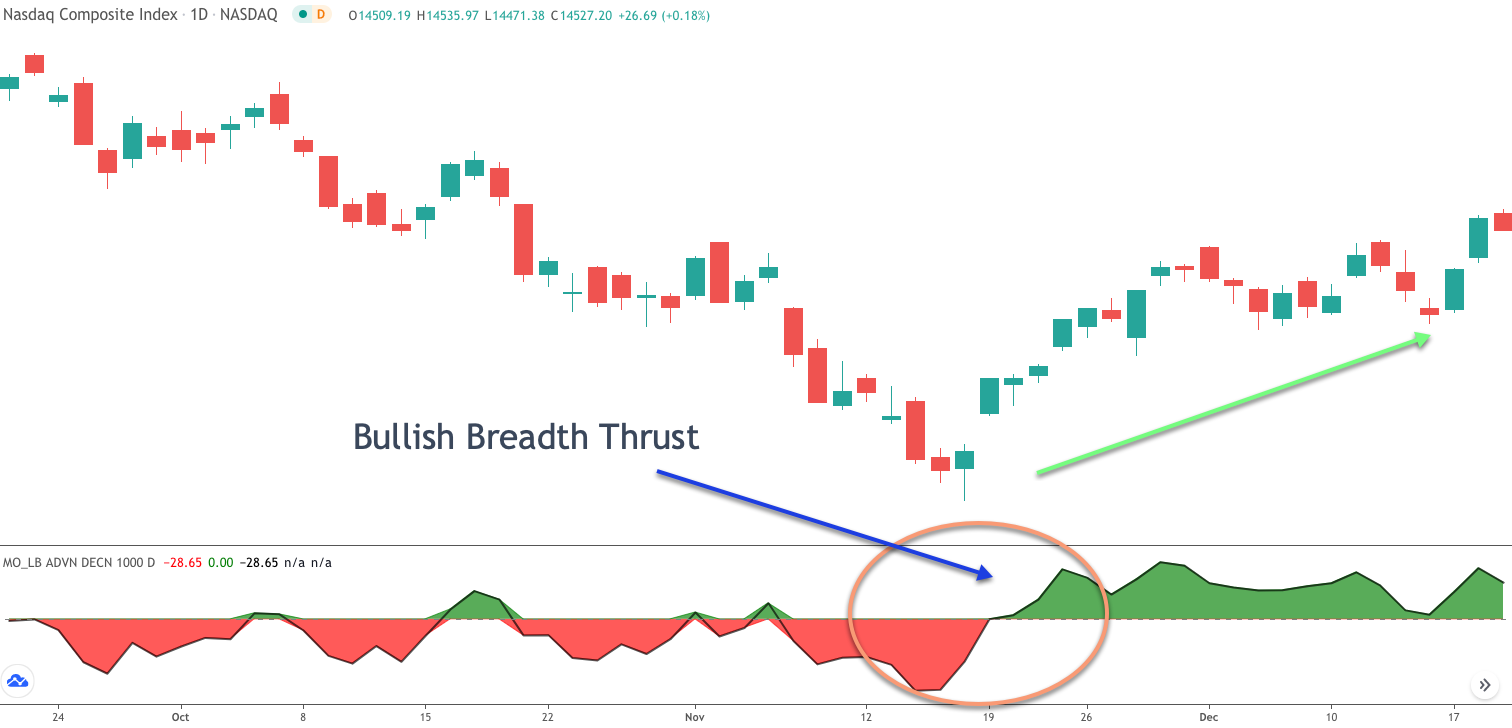
Last but not least, the McClellan oscillator can provide for a unique signal which are referred to as a breadth thrust. A breadth thrust occurs when the McClellan oscillator registers a sharp move, typically 100 points or more in one direction or the other. For example, if the McClellan oscillator makes a rather abrupt move 100 points higher, we would consider that a bullish breadth thrust, indicating heightened bullish sentiment. Similarly, if the McClellan oscillator makes a rather abrupt move of 100 points or more lower, we would consider that a bearish breadth thrust, indicating heightened bearish activity.
Below you can see an example of a bullish breadth thrust in the McClellan oscillator.
McClellan Oscillator Trading Strategy
By now you should have a good foundational understanding of the McClellan oscillator and the different types of signals that it provides. We will now move on to constructing a trading strategy using the McClellan oscillator. This is a fairly simple and straightforward trading method that can be employed in any major market index.
It’s important to note that this strategy is a long only strategy, meaning that it will only initiate trades based on buy signals. Although you could incorporate short trades into the mix, it is not advisable since the mechanics of the strategy relies heavily on short-term retracements within a larger uptrend. The nature of rallies within the context of a downtrending stock market is quite a bit different and as such is not an optimal use of this strategy.
So below you will find the outlined rules for this long only McClellan oscillator strategy.
- The market must be exhibiting and uptrend, which will be objectively measured by the 200 period simple moving average, SMA. Price must be trading above the 200 SMA.
- The McAllen oscillator must display a bullish divergence prior to a bullish crossover in the indicator.
- Enter a buy order at the market when the McClellan oscillator crosses from negative to positive.
- The stoploss will be placed below the lowest swing low preceding the buy entry signal.
- The trade will be exited in full when they McClellan oscillator crosses from positive to negative.
As you can see, this is a fairly basic trading strategy, however, it is quite effective when all of the rules are followed in a disciplined manner and when it is applied in the proper market conditions. Essentially, the strategy is looking for minor pullbacks or retracements within the context of a larger overall uptrend. The 200 SMA is our directional trend filter, and the McClellan oscillator divergence set up is used to find potential inflection points where prices are likely to reverse its short-term downtrend.
McClellan Oscillator Trade Example 1
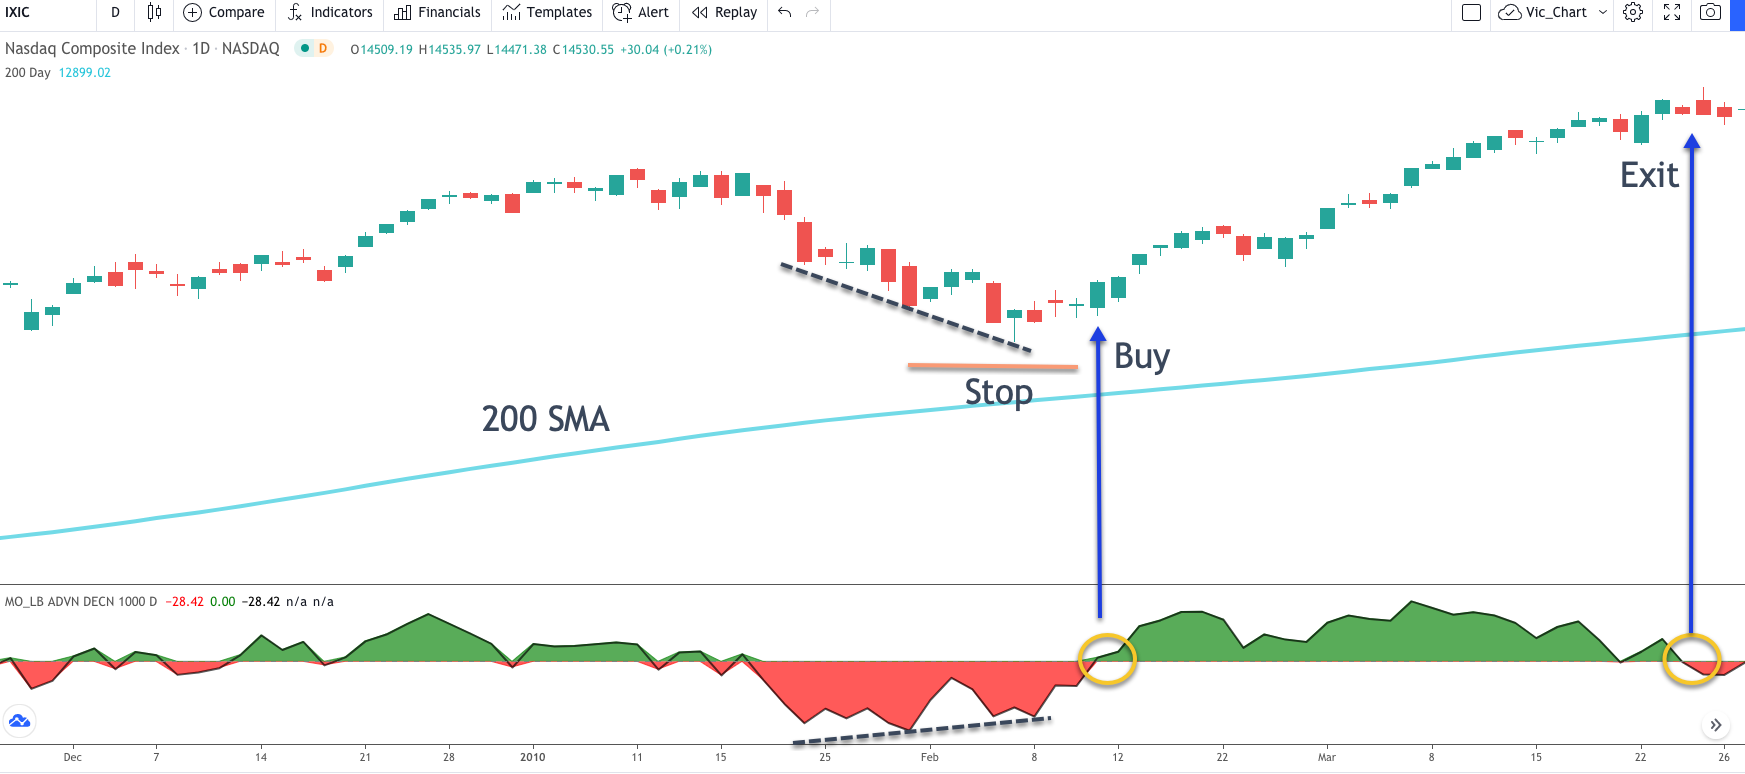
Now that we have outlined the rules for our McClellan trade strategy, let’s now see what a trade with the McClellan oscillator looks like on the price chart. Below you will find the daily price chart showing the NASDAQ composite index. The cyan line represents the 200 period Simple moving average, or 200 SMA. The McClellan oscillator is shown below the price action on the lower part of the chart. Whenever the McClellan oscillator is in positive territory it will be displayed in green, and, whenever it is in negative territory it will be displayed in red.
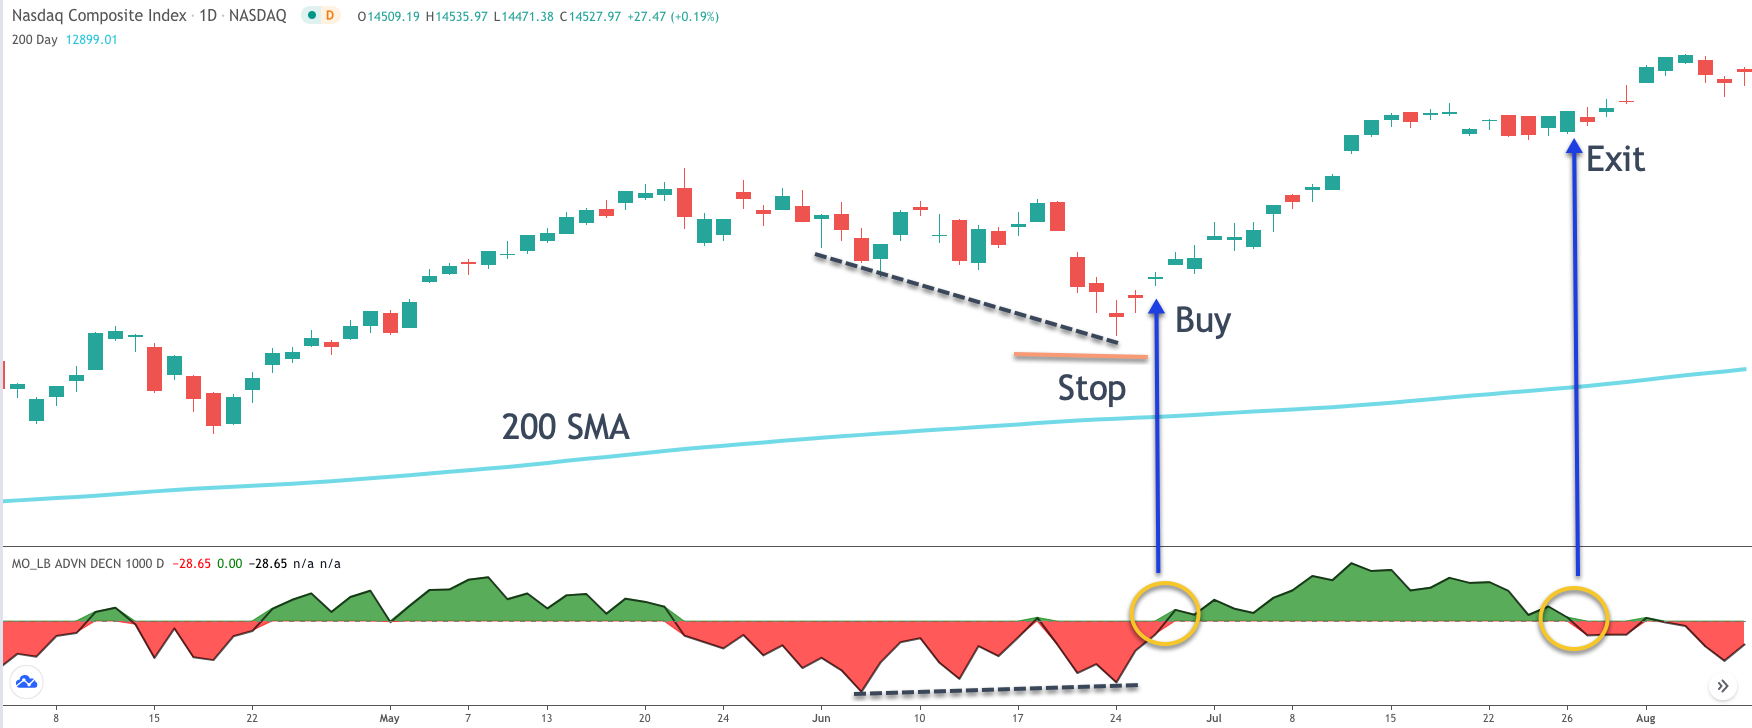
As we can see from the price action starting at the far left of the chart, prices have been moving higher in a steady manner. You’ll notice that the price action is clearly trading above the 200 SMA line. As such, our initial condition for this potential trade has been satisfied. As we move into the center portion of the chart, we can see that there is a minor price retracement that begins moving in the bearish direction. As we look closer at the price action and compare it to what’s happening on the McClellan oscillator, we can clearly see that prices are moving lower, creating lower lows, while the McClellan oscillator is moving higher, creating a bullish divergence in this case.
With these two conditions now being met, we could prepare for a possible long entry into this market. The buy entry signal occurs upon the bullish crossover in the McClellan oscillator. That is to say that we will want to wait for a positive reading on the indicator, which will be illustrated with a green background. If you draw your attention to the first yellow circled area on the McClellan oscillator, you will notice where that bullish crossover occurs. Following the blue arrow up to the price action will show you where the actual buy signal would’ve been initiated.
Now that the long trade has been initiated, we will immediately turn our attention to the most appropriate area for placing our stop loss. As per our strategy rules we will want to place our stop loss just below the lowest low of the most recent swing level preceding the buy signal. This level has been marked on the price chart with the orange horizontal line. Finally, we will want to watch the price movement closely and exit the trade when the time is right. Based on our trading rules, that exit signal will occur when the McClellan oscillator crosses back down into negative territory from above. This exit has been shown on the price chart with the blue arrow and can be referenced on the McClellan oscillator by noting the second circled area.
McClellan Oscillator Trade Example 2
Let’s move on to another example that illustrates the McClellan oscillator strategy in action. In this example we will be using the NASDAQ composite index as our market once again. The price chart below shows the daily price action on the NASDAQ. The cyan line represents the 200 SMA, and the McClellan oscillator is shown in the lower pane below the price action.
Looking at this price chart we can see that prices were moving higher in a stairstep manner starting from the far-left end of the price chart. The price was trading well above the 200 SMA, which demonstrates that a strong uptrend is present within this market. As we move towards the middle portion of the price chart, we can see that prices began to trade lower, though, the price was unable to break below the 200 SMA. This suggests that the market is still strong and that the minor pullback is more likely just that, a short-term bearish move in the context of a strong uptrending market.
As the price moves lower towards the 200 SMA support level, the McClellan oscillator begins to form a bullish divergence pattern. Notice the price troughs within the McClellan oscillator are situated progressively higher, while the price lows within the actual price action are progressing lower. This is a clear indication that the bearish price movement is most likely a short-term retracement, and one that is losing steam.
Based on our rules, we would wait for the McClellan oscillator to cross into positive territory following the bullish divergence pattern before entering our buy signal. Shortly after the clear divergence pattern forms, the bullish crossover event actually materializes. You can see that by looking at the first yellow circled area on the indicator.
Once we were positioned long into this trade, we would want to protect ourselves in case the market moves lower against us. And so, we will use a stop loss order. That stoploss order will be placed below the low of the most recent swing low preceding the buy entry as shown on the price chart.
We can see that immediately following the buy entry signal prices began to move higher quite steadily and the McClellan oscillator does a good job at keeping us in the trade throughout this entire bullish run. We would’ve exited the position when the McClellan oscillator crosses to the downside into the negative territory as can be seen by the second yellow circled area on the far right of the price chart.
Summary
In this lesson, we’ve discussed some techniques for how to trade with the McClellan oscillator. As we have learned, there are several different indicator signals that are generated from this important technical study. To recap, that includes the crossover signal, the divergence signal, and the breadth thrust signal. Of these, the divergence signal tends to be the most powerful and provides for the highest probability trade setups.
One big difference between trading the McClellan oscillator and many others is that the McClellan oscillator is designed as a market breadth indicator and is best used as a composite stock market sentiment study. It should be utilized on broad market indices rather than individual stocks or securities. The most common use of the McClellan oscillator is in analyzing the sum total of the NYSE stocks, and NASDAQ stocks. As a result, the McClellan oscillator is often referenced as the NASDAQ McClellan oscillator, or the NYSE McClellan oscillator.