 Economic data releases are an important part of the fundamental analysis process when trading Foreign Exchange. These data sets allow us to look at the current state of an economy and create forecasts for the near future. They also enable us to compare the economic strength of two currencies, giving us a fundamental picture of each economy of a currency pair. There are many types of economic data, some more important than others.
In this article we will have a look at the Retail Sales Report. For the FX markets, this data series is among the most important, and investors and traders pay close attention to its release because it makes up a significant portion of domestic GDP, and it is an indicator of price pressure as well as economic activity.
Definition of Retail Sales Data
Retail sales data is compiled differently according to each country and their bureau of statistics, some countries have private companies for some data and government offices for others. We will analyze the US retail sales data which is compiled & released by the US Census Bureau. This data measures total retail spending in stores & receipts across the nation and its monthly rates of change expressed as a percentage. This data covers sales for durable and non-durable goods ranging from food to autos at a retail level.
The data is divided into US Retail Sales and US Core Retail Sales which excludes autos and gasoline. The Auto and gasoline components are excluded as these two elements are often very volatile. The Census Bureau releases Retail Sales data, for month over month (MoM) and year over year (YoY) percentage changes. MoM data is the more important of the two as this data series is more likely to show a surprise or unexpected reading; markets are more likely to react to deviations from expectations. Other retail sales data sets, such as Core and Ex-Auto, are released as month to month changes only. Data is also collected for a Retail Sales Control Group MoM change; this group excludes autos, gasoline and construction materials. All retail sales data is released monthly, approximately two weeks after the target month.
 US Retail Sales Data
Retail Sales reports are compiled from data received by the Census Bureau from around twelve thousand stores, establishments, and retailers including online outlets. The firms are randomly selected according to certain criteria, for minimum size, business area, paid employees and geographical areas. These factors help avoid clusters; a new sample is chosen every 5 years or so. The data is used to extrapolate the trend for retail sales throughout the entire nation. Retail sales are adjusted for seasonal differences and number of trading days and holidays.
Data is collected for all types of goods, and online sales are also included. This includes restaurants and services related to the direct sale of goods, while other services such as financial, are not included.
US Core Retail Sales & Ex-Auto
This data series is released to show the impact autos, and gasoline have had on retail sales. Autos have a very large sticker price and may adversely affect the total of core retail sales as they are a large component of the series, around 25%. Auto data also includes items other than new cars, such as parts & repairs, as well as used cars, motorcycles, and recreational vehicles. Gasoline prices can be extremely volatile as there may be large changes at the pump due to crude oil price changes as well as supply and demand changes in gasoline.
Retail Sales Control Group
This data series excludes autos, gasoline and construction materials. This data is also used to construct the Personal Consumption Expenditure series, which is a gauge of inflation. Of the retail sales data sets, it may be one of the least influential on FX markets unless there is an extremely large deviation from forecasts, as this would mean expansion or contraction in the construction industry may be taking place.
The Importance of Retail Sales Statistics
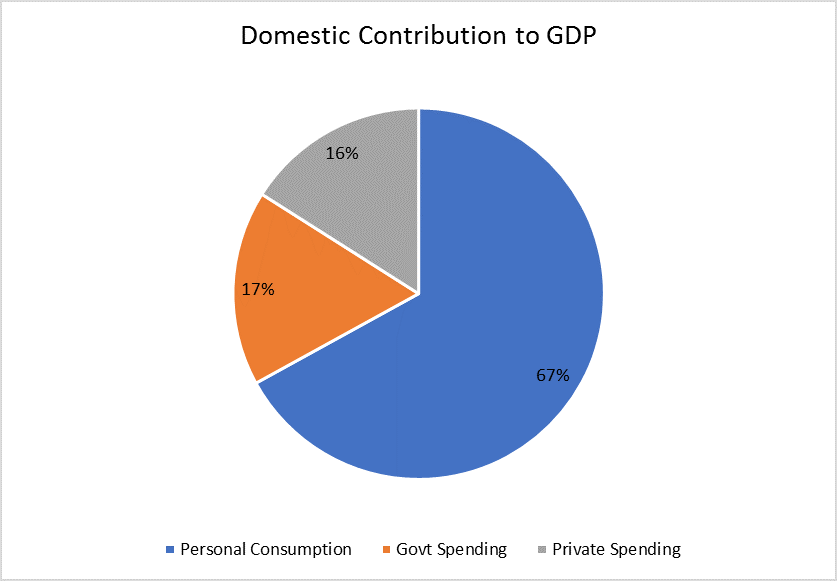
Retail sales are a strong indicator of the health of an economy and whether it is contracting or expanding. The importance comes from the fact that retail sales make up nearly one-half of personal consumption, which in turn accounts for nearly 70% of GDP. Retail sales in terms of direct economic activity account for almost one-third of GDP.
The percentage increases or decreases also give a good indication of how fast the economy is contracting or expanding. Very strong or weak retail sales can also put upward or downward pressure on prices. As retail sales surge, then upward pressure on prices may eventually take hold, especially if sales figures continue rising month after month. The same is true when sales are very weak, putting downward pressure on prices as consumers spend less, again when sales drop for a prolonged period.
This data set is used by various organizations government and non-government. In the US, it is used to calculate GDP by the Bureau of Economic Analysis, and it is used by the Labor and Statistics Bureau to calculate Consumer Price Indices and productivity measurements.
More importantly, perhaps, the Federal Reserve uses this data to determine trends in consumer purchases and therefore possible inflationary pressure. It is also used by market participants to get a picture on the general activity and the direction of the economy.
Retail Sales Date Provides Strong Correlation to Inflation
One of the main reasons retail sales data can move markets is the strong correlation it has to inflation. High numbers for retail sales will usually be accompanied by strong numbers in inflation. In the same way, rising inflation puts upward pressure on interest rates, so too does higher retail sales numbers. Traders consider higher rates as immediately bullish for a currency, with the lack of contrasting data, strong retail sales data should cause that currency to rally, at least near term.
There may be a lag between retail sales and inflation data, especially since the former is revised a month later for the final number, which is open to large variations. Large deviations from expectations in this data are common due to the variability of factors that drive retail sales. We mentioned above, autos and gasoline price’s influence on retail sales figures as driving large fluctuations in data. However, even something as simple as severe weather, for example, can be a cause for this data to be much lower than anticipated.
Volatile Data and Rolling Moving Averages
Monthly retail sales data can be very volatile, and some caution is often warranted. Not only can retail sales releases vary greatly from expectations but revisions of previous month’s data can also change significantly. Both factors can cause confusion or cloud the overall underlying trend on certain occasions. A widespread practice is to use a 3-month moving average of the MoM percentage changes rather than just the last monthly release.
Recently US Core Retail Sales has become the data set that is followed mostly by economists and analysts as this data set is less volatile. As mentioned earlier the fact this data excludes two components that distort the overall reading for retail sales contributes to a more reliable measure of economic activity and limits external factors that are related to commodity prices and auto promotions.
Revision of data can also have a significant impact on FX markets as some revisions can be considerably drastic. For example, in 2016 retail sales for February were revised from +0.2% to -0.3%, and in the following month March data was revised from -0.2% to +0.1%. This was a substantial variation from initial readings. However, as revisions are issued the same day and time as new releases, the impact of the market is derived from a combination of these numbers.
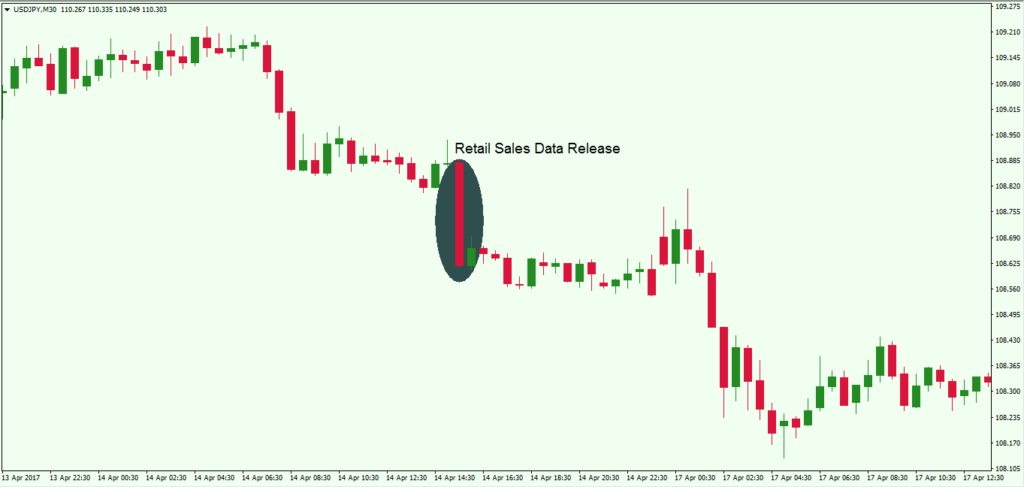
30 Minute Chart of USDJPY
The chart above shows what happened on April 14th 2017, after the retail sales release. Data for March MoM was released at -0.2%, which was closer to the lower-side of forecasts between -0.5% and 0.3%. The consensus, which is the average of forecasts at 0.0%, meant this number was weaker than expected. The revision of the previous month from an initial 0.1% to -0.3% was also a weak number. Generally speaking, weak retail sales data is bearish for the US dollar. The chart shows the USDJPY lost 265 ticks in the space of the first half-hour after the data release. We can also see how the price action remained in a fairly contained range running up to the data release. Usually, a strong number for retail sales, that is a number that is higher than expected should cause the US dollar to rally. While a weak number, lower than expected, should cause dollar to fall in price.
A quick analysis of retail sales data consists of comparing the released data to the consensus, then to the high/low range to see how far from consensus the data is. At the same time, you will be looking at the revised number for the prior month to see if has been revised in the same direction as the current month’s data. As in the example above, the current data was lower than expected and so to was the prior month’s revision lower.
The immediate effects of a data release can be seen as a knee-jerk reaction to the new information as it arises. But as this data set is subject to considerable revision and volatility from one month’s data to the next, it is extremely useful to also look at 3-month moving averages. The best way to build the average is using revised data only, so your 3-month average will be lagging by two months instead of one, but it will also be more accurate.
On the day of retail sales release, it is necessary to also look at the other data released alongside it. Retail sales figures are released together with inflation data, usually Consumer Price Index. This set of data is also important and must be incorporated into the analysis of retail sales data, compounding readings for both sets of data together with the revised readings for retail sales. Contradictions between the two data sets may arise, for example, higher than expected retail sales but lower than expected consumer price index. In these cases, price will usually be choppy initially, until the market figures out which data has more weight. Usually, the one that changed the most will dictate market direction.
Revised data usually has the upper hand on the data released for the current month, as this data is final and has been processed as being more representative of retail sales. The advanced release which is open to large corrections the following month has less weight than revised data. Therefore, even though in the case of a weaker than expected number for the current month, if the revised data for the prior month is much higher than was indicated initially, you should see the currency rally rather than decline. It is also possible that the differences cancel each other out and the market remains in a tight range instead of seeing an increase in volatility.
 Causes for Distortions in Retail Data
Retail sales figures are calculated following real US dollar prices; this means that when prices for commodities fall there will probably be a fall in retail sales figures.
The same amount of goods sold at lower prices will show a smaller increase or even a decline in retail sales, as the dollar amount of retail sales will be smaller. Changes in food prices, as well as other commodities, can greatly affect the data. For example, you can gather that changes in lumber or cotton prices should effect furniture or clothing prices. A way to get around the distortion of commodity prices to determine real activity in retail sales is by looking and evaluating the Consumer Price Index for commodities alongside the retail sales report.
Consequences of Changes in Retail Sales
Retail sales as we have seen, give indications on the general health of an economy and the likely corresponding inflationary pressure. Both are extremely important at a macroeconomic level, and therefore give central banks indications on defining monetary policy.
Obviously, central banks do not decide on monetary policy only using retail sales statistics, but they are an important part of the general analysis of the state of the economy.
Monetary policy is possibly the most crucial factor driving FX price change, as currencies with a strong economy and a higher interest rate will most likely appreciate against its peers with lower interest rates. When retail sales data is consistently strong, we have an indication of an expanding economy and can expect to see inflation rising along with higher GDP growth. Jobs data should also be improving as merchandise needs to be produced before being sold, and along the distribution chain jobs should be created.
Retail sales are an important part of the wider picture of economic activity, as this metric measures an important part of the economy as can be seen by its contribution to GDP. Traders, therefore, look at this data set because of its capability of giving clues to the direction of the economy. As we have shown in the earlier example, deviations from the average forecast and strong deviations in the number’s revision can cause the markets to react visibly from the increase in volatility.
Where to Find Retail Sales Data Online
The internet has given us the capability to reach economic news releases more quickly than ever. The speed at which retail traders can receive this information now was once only available to institutional traders or investors with the money to pay for premium professional data services, like Reuters or Bloomberg.
Nowadays, a lot of real-time economic data is available online and for free. A good source for economic data in the US, which is nearly real-time is Bloomberg. Other sources are also available, another widely used website for real-time economic data for countries worldwide is FXStreet, which has an economic calendar covering 42 developing and developed countries from around the world.