If you are a fan of channel trading techniques, then you will definitely want to pay attention to the following article. Most traders are aware of how to draw and trade the basic channel structure, however, today we will dive into some advanced concepts around the channel trading methodology using the Andrew’s Pitchfork.
What is the Andrews Pitchfork
The Andrews Pitchfork is an on-chart technical indicator that is drawn around recent price action. It falls into the category of channel indicator studies. The structure of the Andrews Pitchfork indicator consists of two parallel lines and a median line in the middle.
In this manner, the Andrews Pitchfork drawing tool has three parallel levels which are equidistant. It is used to gauge the price behavior during an emerging or prevailing trend.
How to Draw Andrews Pitchfork
The placement of this indicator can sometimes be tricky. In some cases the proper drawing of the indicator requires a bit of trial and error until the Pitchfork channel conforms to the price action.
If the price action begins to react to the levels of the Pitchfork, then this will help confirm the validity of the Pitchfork study drawn on the chart.
Picking the 3 Initial Points of the Andrew’s Pitchfork
Before you can plot the Andrews Pitchfork, you must first find an emerging or existing trend on the chart.
Have a look at the chart below:
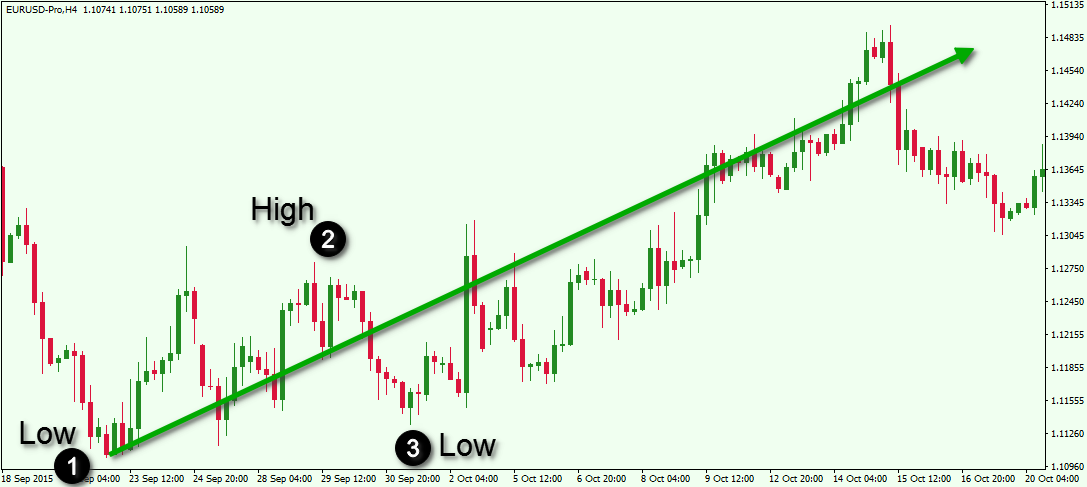
You are currently looking at a bullish trend on the EUR/USD chart. You need to take three reference points from this trend in order to draw the Pitchfork indicator. For this example, the first reference point is at the beginning of the trend move. The second point is a high during the emergence of the trend. The third point is the retracement of the initial swing move.
Drawing the Andrews Median Line
The first thing you need to do when drawing the Andrews Pitchfork indicator is to build a straight line between point 2 and point 3. Take the points’ high and low and connect them with a straight line. Then find the midpoint of this line. Have a look at this example:
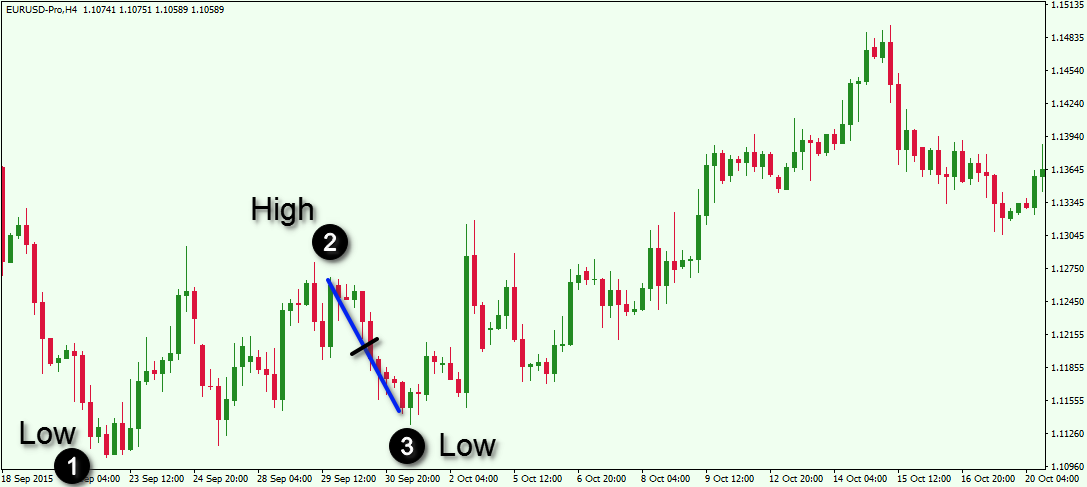
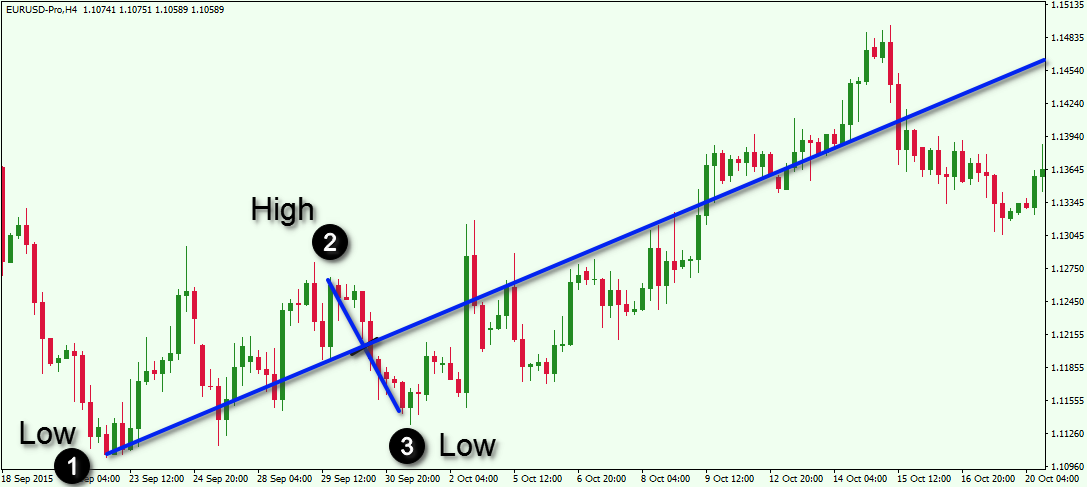
The blue line is the straight line between the high and the low of points 2 and 3. The black mark is the midpoint of the blue line. One you have plotted this, you then need to draw the median line of the trend. You do this by placing a ray starting from the low at point 1 through the midpoint of the blue line between point 2 and 3. This is how the median line should look on your chart:
Building the Pitchfork Channel
We have half of the Pitchfork indicator on the chart, but now we also need to add the Pitchfork channel from here. To do this, we need to draw two rays on the chart starting from point 2 and point 3. The two rays need to be parallel to the Andrews Median Line. When you do this, you will see the following structure on your chart:
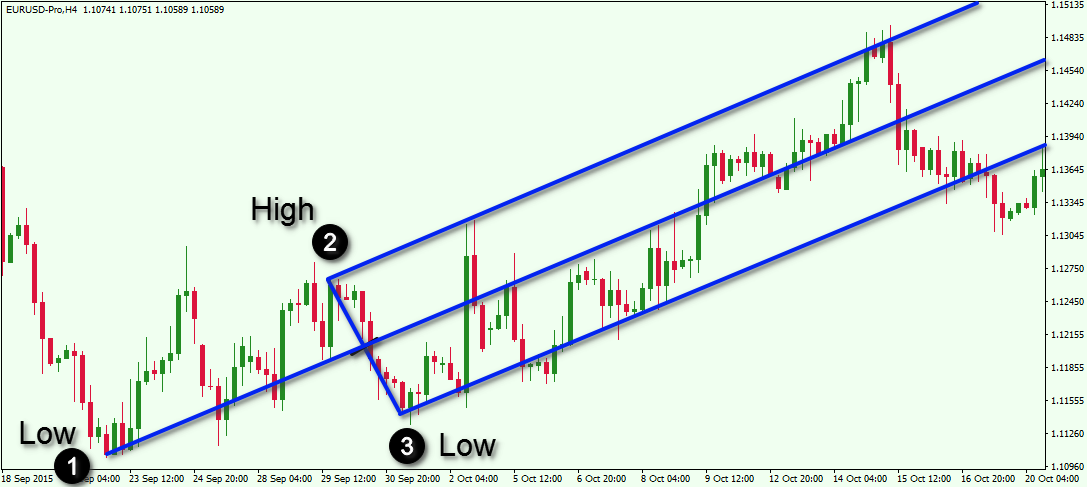
Voila! You have a completed Andrews Pitchfork trading indicator on your chart. The middle line is the Andrews Median line and the upper and the lower lines are the Andrew’s Pitchfork Channel.
Confirming the Validity of the Andrew’s Pitchfork
Now that we have constructed the Andrew’s Pitchfork study on the forex chart, we need to confirm its authenticity. The Pitchfork structure is considered valid if the price action demonstrates reactive movements off the Andrew’s lines. Below you will see the places where the price action conforms to our Pitchfork trading indicator:
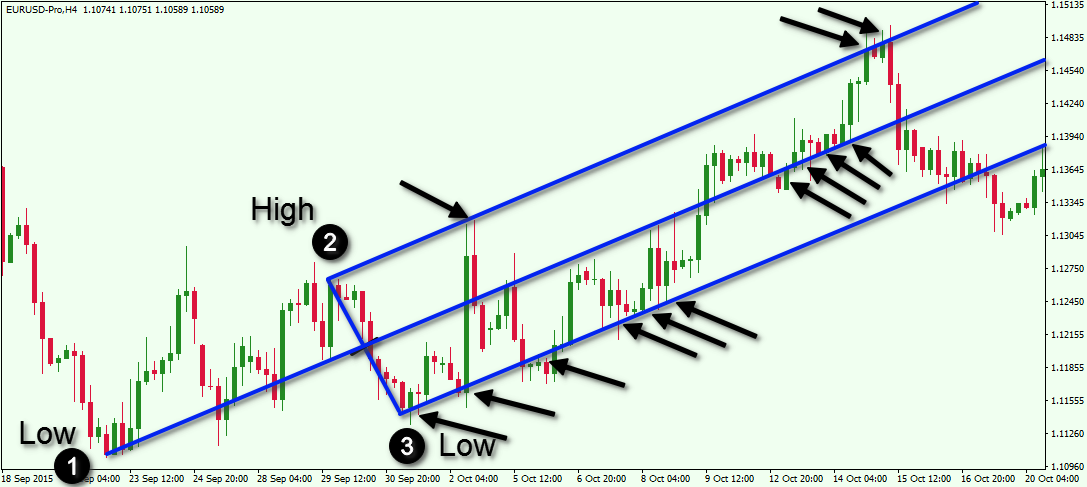
The black arrows on the chart illustrate instances when the price touches the lines of the Pitchfork and then quickly reacts by bouncing in the opposite direction. There are more than 10 cases where price finds support or resistance at the Pitchfork levels.
The Pitchfork Drawing Tool
Although we have discussed step by step how to draw the Andrews Pitchfork on the chart, you should know that this indicator is built into most trading platforms, so you would not have to plot the lines manually. In any case, it is always worthwhile to understand how any technical study is constructed so that you can have a deeper knowledge of its components.
If your preferred trading platform supports the Andrew’s Pitchfork drawing tool, then you should simply choose the Pitchfork drawing tool from within your indicator library. Then you should select the three reference points as detailed earlier on the price chart: Low-High-Low for a bullish trend and High-Low-High for a bearish trend. When you click on each of the three points in the respective order, the indicator will automatically plot the Andrew’s Pitchfork on your price chart.
Breakout Pitchfork Trading System
A popular Andrews Pitchfork Trading Strategy entails trading breakouts outside the expected range. This is typically a trend reversal strategy. When the price breaks the Pitchfork range in the direction, which is opposite to the trend, this gives a reversal signal on the chart. In order to trade these price reversals, you should first become familiar with the steps for implementing this strategy. Let’s take a look at a bearish breakout of the Andrew’s Pitchfork:
- First, you need to identify the Pitchfork breakout. When you see the break, you shouldn’t instantly trade it. You should first wait for a confirmation.
- When the price breaks the pitchfork, it is likely to create a bottom below the Pitchfork indicator.
- Then the price is likely to return to the lower level of the Pitchfork for a resistance test.
- After the lower Pitchfork level is tested as a resistance, the price is very likely to return to the bottom, which was created right after the Pitchfork breakout. If the price breaks this level you get your confirmation signal and you should short Forex pair.
Your stop loss order should be placed right above the top created when the price was testing the already broken Pitchfork as a resistance.
Your take profit approach in this strategy could be fully price action based. Follow basic support and resistance rules and watch out for reversal chart or candlestick patterns.
Let’s illustrate the Pitchfork from the earlier image, and combine this our newly created trade execution rules. Take a look below:
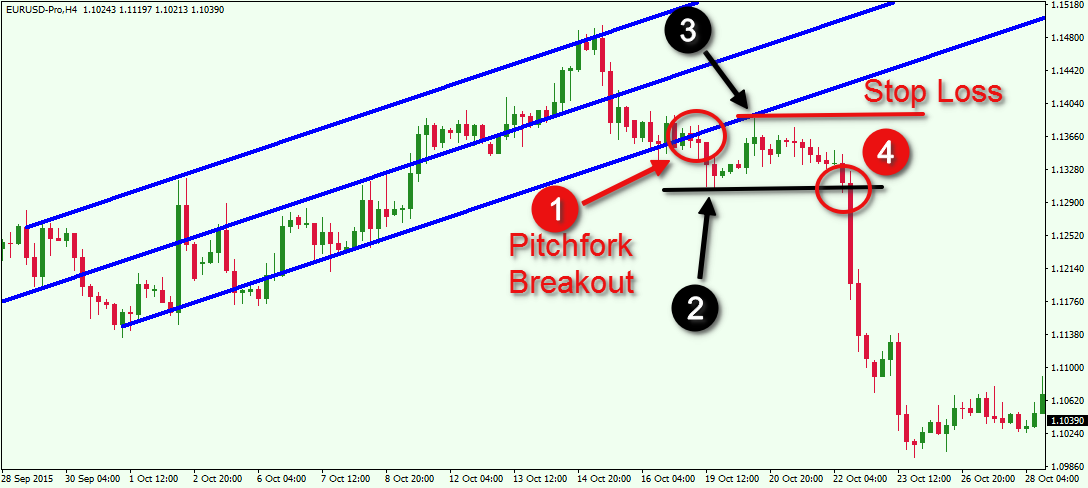
The price graph illustrates the four steps we need in order to confirm the trend reversal via the Andrews Pitchfork indicator.
First we confirm the breakout in the Pitchfork (1). Then the price creates a bottom below the already broken Pitchfork level (2). The price then returns to the already broken level of the pitchfork and tests it as a resistance (3). The price bounces in a bearish direction afterwards and breaks the previous bottom (4).
When you confirm the 4-th step of the Pitchfork reversal, you should prepare to short the pair and put a stop loss above the top at point 3.
In this example, we see a significant price drop after our confirmation signal at point 4.
Price Action Trading Inside the Andrews Pitchfork
You have probably noticed that the price action within the pitchfork routinely breaks the median line and bounces from the upper and the lower level. After all, this is what confirms the validity of the plotted Andrews Pitchfork indicator.
And so, the levels of a valid Pitchfork are likely to act as a support and resistance for the price action. Let’s now take a closer look at the essential rules for trading inside the Andrews Pitchfork:
- Buy when the price bounces from the lower level of the Pitchfork.
- Sell when the price bounces from the upper level of the Pitchfork.
- Use a Stop Loss order as follows:
- If you are buying after a bounce from the lower level of the Pitchfork, place a Stop Loss order below the bottom created from the bounce.
- If you are selling after a bounce from the upper level of the Pitchfork, place a Stop Loss order above the top created from the bounce.
- Hold your inside Pitchfork trades as follows:
- The price reaches the opposite Pitchfork level.
- The price breaks the Median Line in the direction opposite to the initial price bounce.
Now let’s see how these rules work together on the example chart below:
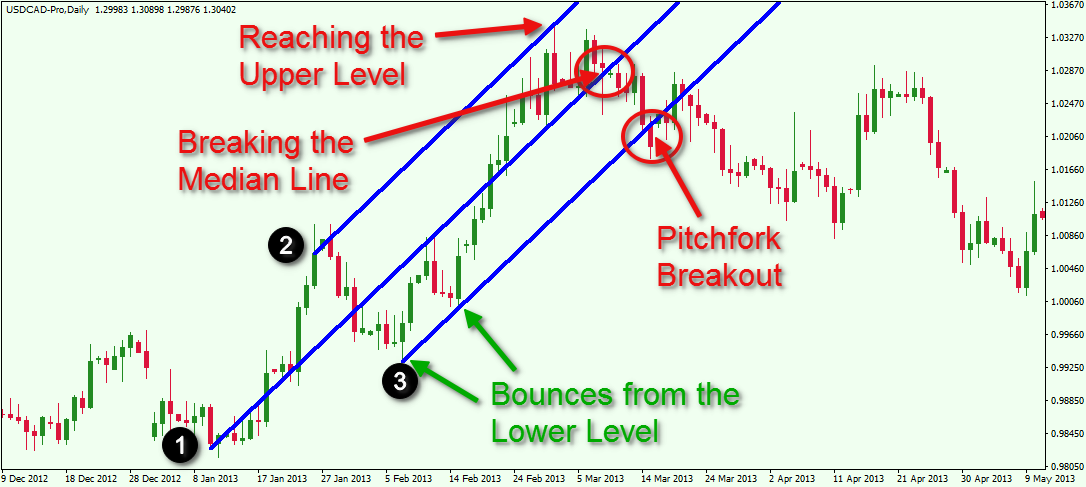
This is the daily USD/CAD chart Dec, 2012 – May, 2013. The image illustrates a bullish price trend along with the Andrew’s Pitchfork. The three black reference markers indicate the Low-High-Low points taken to build the indicator.
Our Pitchfork analysis starts from the lower level of the plotted indicator. See that the price creates a couple of bottoms and bounces upwards. The first bounce is used to build the Andrews Pitchfork tool, which represents the important initial swing low (1). Then prices rise to create the top (2), and subsequently fall to create the second swing low (3). Once we have Point 3, we are ready to plot the Pitchfork on the chart. You could consider a long position off the initial bounce at Point 3, or wait for the subsequent 2nd bounce after Point 3 to enter a long. This second bounce should act as a confirmation of the Pitchfork’s validity. When the second bounce appears, the Pitchfork gets confirmed. This creates a long trading opportunity on the chart.
As you see, the price increases afterwards. On the way up the USD/CAD Forex pair breaks the Median Line. This suggests that the bullish price move is relatively strong. Eight periods after the breakout of the Median Line, the price reaches the upper level of the Pitchfork Channel. This could be used as a signal to exit this long trade.
Some traders, however, may not want to exit their profitable position at this time. Instead, they may reason that the price might return to test the Median Line as a support and then resume the bullish move. This would be a reasonable observation, and so for traders who prefer to stay in the trade further, they may want to perform a Median Line analysis for exiting their trades. In this scenario, if the price breaks the middle line downwards, that would then act as the exit signal for the long position.
As you see on the image above, after breaking the Median, the price also breaks through the lower level of the Andrews Pitchfork. The price then reverses to the downside after the bearish Pitchfork breakout. Let’s now turn our attention to another Pitchfork trading example:
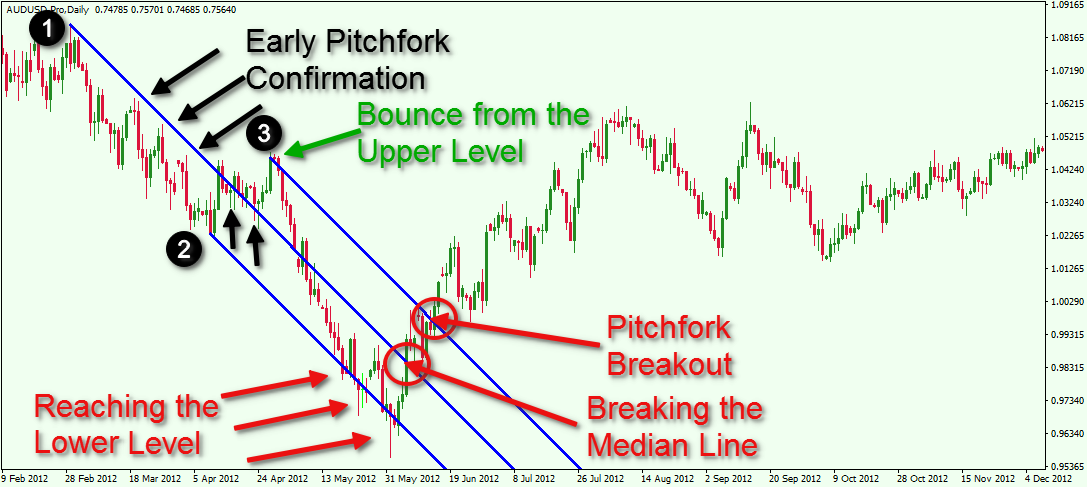
This time we are looking at the daily AUD/USD chart for Feb-Dec, 2012. Starting at the beginning of this period, we can see that the trend is bearish, as such the Pitchfork indicator is pointing downwards. The three black dots on the chart mark the High-Low-High price action pattern, which is used to build the Pitchfork trading indicator.
Notice that the price action creates three tops in the area of the Median Line, which is located before points (2) and (3) on the chart. This gives us an early clue for constructing the Andrews Pitchfork. The bearish bounce which comes after the creation of point (3) could be used to short the AUD/USD pair. The price of the Aussie decreases quickly. On the way down, the price action blows thru the Median Line of the Pitchfork which provides a strong indication of the strength of the bearish move.
The decrease continues further and the price action quickly reaches the lower level of the Pitchfork. Notice that the price creates three more bottoms in the area of the lower Pitchfork line, and then it swiftly reverses the direction of the move. The first exit signal from this trade is received when the price touches the lower level of the Pitchfork. There would have been several more opportunities to exit based on the touch of the lower level.
The second type of exit signal from the trade comes when the price reverses its direction to the upside and breaks the Median Line.
After the breakout through the Pitchfork Median, the price continues to move upward. The upper level of the Pitchfork gets broken soon afterwards. This implies that the bearish trend might be reversed, and also signals a new long trade entry for the AUD/USD. The price then accounts for a strong increase.
One of the reasons that Pitchfork trading works well is because the structure of the Andrews Pitchfork indicator reveals hidden support and resistance levels on the chart, that are not normally recognizable. As such, price action traders who are able to incorporate this type of analysis into their trading plan can benefit from a deeper level of understanding behind current price behavior.
Conclusion
- The Andrews Pitchfork is an on-chart technical indicator, which falls in the category of price channels.
- It consists of three parallel lines: an upper and lower level, split by a central Median Line.
- To build an Andrews Pitchfork on the price chart, you should implement the following steps (for bullish trend):
- Identify a trend, or an emerging trend.
- Take the lowest point of the trend (the beginning) and mark it with (1).
- Take the subsequent swing high point of the trend and mark with (2).
- Then take the next swing low point on the trend and mark it with (3).
- Build a straight line between (2) and (3).
- Mark the midpoint of this line.
- Build the Pitchfork Median Line by adding a ray from (1) through the midpoint between (2) and (3).
- Add a ray starting from (2), which is parallel to the Median Line.
- Add another ray starting from (3), which is parallel to the Median Line.
- Then you should have three parallel lines on the price’s trend, which are equally distanced from each other.
- This is a completed Andrews Pitchfork Indicator.
- Confirm the validity of the Pitchfork by finding places where the price action conforms to the levels of the indicator.
- If you are unable to confirm the validity of the Pitchfork, find a replacement for (2) or (3) or both.
- All the rules are fully applicable for bearish trends, but in the opposite direction (High – Low – High).
- Most trading platforms have built-in Andrews Pitchfork drawing tools, which only require you to indicate the three points on the chart. The software then builds the pitchfork for you.
- One profitable way to trade using Andrew’s Pitchfork analysis is to identify breakouts. You can go short if the following conditions are present on the chart during a bullish trend:
- The price breaks the lower level of the Pitchfork.
- After decreasing the price reverses and creates a bottom below the broken lower level of the Pitchfork.
- The price then increases and tests as a resistance the area around the already broken lower level of the Pitchfork.
- The price action then breaks the level of the bottom created after the Pitchfork breakout. This is the confirmation signal.
- When you have the confirmation signal, then you can prepare to sell the Forex pair.
- You should place a stop loss above the top created when the price tested the lower level of the Pitchfork as a resistance.
- Use price action rules to determine when to exit the trade.
- Another reliable way to trade with this channel indicator is to catch the inside price moves of the Pitchfork:
- Buy when the price bounces from the lower level of the Pitchfork.
- Sell when the price bounces from the upper level of the Pitchfork.
- Put your stop loss orders above/below the created tops/bottoms when the price bounces from the Pitchfork level.
- Hold the trade until the price reaches the opposite Pitchfork level, or until the Median Line gets broken in the opposite direction.